
Salinity Provinces in the Glenelg Hopkins Catchment Management Region
At the south-west corner of Victoria, the Glenelg-Hopkins Catchment Management Region (CMR) is bounded by South Australia to the west, the coast to the south, and the Corangamite and Wimmera catchment management regions to the east and north respectively.
Geology is predominated by extensive undulating basalt plains punctuated by scoria cones and stony rises. In the north, the Grampians ranges and steep sided Mounts Cole, Buangor and Langi Ghiran are the highest points in the landscape.
To the west, the dissected Dundas and Merino tablelands grade down to sand plains along the South Australian border. Limestone, alluvial deposits and sand dunes feature along the coastal zone.
Drainage is mostly via the Glenelg and Hopkins rivers, both of which drain to the sea. To the west, the Glenelg River and its major tributary the Wannon River, drains 45% of the region. In the east, the Hopkins River and its major tributaries Mt Emu Creek and Fiery Creek/Salt Creek drain a further 38% of the region.
The Glenelg Hopkins region has a Mediterranean climate characterised by hot dry summers and cool wet winters. Average annual rainfall varies from 500 mm to 910 mm, while average annual temperatures range from four to 27 °C. The original natural vegetation was extensively cleared, resulting in remnant vegetation now covering less than 13 per cent of the region.
The region's agriculture is mainly focussed on dairying and the extensive grazing industries of sheep and beef production. The region has also had an increasing level of investment in enterprise conversions to cropping and private forestry in recent years, particularly Blue-gum plantations.
The Glenelg-Hopkins catchment has both ‘primary’ and ‘secondary’ salinity. There are large areas of naturally saline soils, salt lakes and salty streams, where the flora and fauna communities are adapted to saline environments. These areas of primary salinity and are not generally considered a problem, but do require conservation management.
However, expansion of primary sites due to secondary salinisation processes has occurred in a number of instances and secondary salinity has occurred in cleared landscapes due to changes to the landscape water balance. Loss of perennial vegetation has caused groundwater levels to rise, bringing stored soil salt or saline groundwater to the surface. Over 3200 individually mapped units1 of soil salinity covering almost 30,000 ha1 have been recorded in the CMA region. These have been grouped into 19 Salinity Provinces (including 12 High priority Provinces) based on geographic and biophysical similarities and to aid in monitoring and reporting salinity risk.
The Glenelg Hopkins CMA has an extensive range of online materials (maps and documents etc.) which outline the biophysical assets of the catchment, as well as their major risks (including soil and water salinity). This material also outlines the programs and projects currently being completed by the CMA to protect and enhance these assets. An example of this is the Glenelg Hopkins CMA ‘Soil Health Strategy 2014-2019’, the link to which can be found at the base of this page.
Provinces displayed in this map are clickable or use the table of links provided
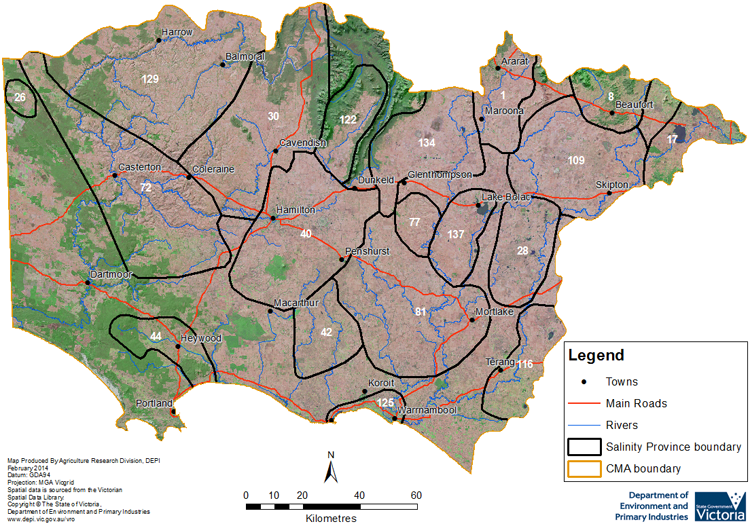
Province Name | No. | Area of Province (ha) | Recorded Soil Salinity Area 1 (ha) | Soil Salinity Area (% of SP) |
| Ararat - Maroona | 1 | 59,240 | 911 | 1.54% |
| Beaufort | 8 | 47,430 | 542 | 1.14% |
| Burrumbeet | 17 | 50,040 | 61 | 0.12% |
| Dorodong | 26 | 10,600 | 48 | 0.45% |
| Dundonnell | 28 | 71,560 | 2,427 | 3.39% |
| East Dundas Tablelands | 30 | 206,480 | 4,927 | 2.39% |
| Hamilton | 40 | 173,780 | 3,082 | 1.77% |
| Hawkesdale | 42 | 56,590 | 65 | 0.11% |
| Heywood | 44 | 47,430 | 11 | 0.02% |
| Merino Tablelands | 72 | 219,910 | 811 | 0.37% |
| Moffat | 77 | 25,590 | 127 | 0.50% |
| Mortlake - Caramut | 81 | 188,140 | 2,541 | 1.35% |
| Skipton | 109 | 139,320 | 585 | 0.42% |
| Terang | 116 | 60,230 | 935 | 1.55% |
| Victoria Valley | 122 | 56,400 | 711 | 1.26% |
| Warrnambool | 125 | 16,900 | 517 | 3.06% |
| West Dundas Tablelands | 129 | 246,570 | 5,266 | 2.14% |
| Willaura | 134 | 103,390 | 2,916 | 2.82% |
| Woorndoo | 137 | 49,780 | 1,279 | 2.57% |
1 Please Note: The ‘Recorded Soil Salinity Area’ and ‘number of individually mapped units’ indicated in the CMA text and/or table, comprises the total geographic area or number of sites that have been mapped as having, or showing symptoms of dryland soil salinity at some time (past or present). As dryland salinity occurrence in the Victorian landscape exhibits many different levels of severity and can change due to climate, landuse and vegetation, previously mapped areas may no longer be showing symptoms. In addition, as not all parts of the state have been mapped, or mapped in the same way, the mapping may not have captured some occurrences.
Recorded soil salinity mapping used for these pages does not cover irrigation regions. Instead, depth to watertable and watertable salinity mapping has been used to convey the threat of high watertables on soil waterlogging and/or soil salinisation.
Please contact the Department, your Catchment Management Authority or your rural water provider for more information about salinity in your location.
Links to further reading and material related to the Glenelg-Hopkins CMR
Glenelg-Hopkins Catchment Management Authority region on VRO
Glenelg-Hopkins Corangamite Catchment Management Authority
Glenelg-Hopkins CMA ‘Regional Catchment Strategy ’ (RCS)
Glenelg-Hopkins CMA ‘Soil Health Strategy 2014-2019’
Information about bores and groundwater resources in the Glenelg-Hopkins CMA can be found on the Visualising Victoria’s Groundwater (VVG) website
© State of Victoria (Agriculture Victoria) 1996 - 2025.

This work, Victorian Resources Online, is licensed under a Creative Commons Attribution 4.0 licence. You are free to re-use the work under that licence, on the condition that you credit the State of Victoria (Agriculture Victoria) as author, indicate if changes were made and comply with the other licence terms.
The licence does not apply to ‘branding’ or some ‘images or photographs’ that may be owned by third parties. We ask you to seek prior approval to use images using the VRO feedback form. Access to higher quality images can also be provided on request.
This page was last updated on 23/03/2020.