
Salinity Provinces in the Wimmera Catchment Management Region
The Wimmera CMA Region covers a little over 10% of Victoria and extends over the central west portion of the State. The catchment of the Wimmera River is the largest in Victoria; the river travels northwest from its headwaters in the highlands of the Grampians and Pyrenees, as well as lower lying areas around Ararat, through the relatively uniform landscape of its middle reaches until terminating at Lake Hindmarsh. The river is seasonally ephemeral being deeply incised in the uplands while becoming broader to the northwest.
Elevation extends from 980 m (AHD) at Mt Buangor towards 70 m (AHD) at Lake Albacutya. Average annual rainfall decreases to the north and ranges from 520 mm at Stawell (east) to 390 mm at Nhill (west). The Grampians Range is a rainfall bullseye with average annual of close to 1000 mm. Temperatures also vary dramatically, depending on topography and location. Maximum summer temperatures are commonly greater than 38 °C throughout the CMA. In winter, temperatures range between 5 °C and 15 °C in the flatter country, but reach below zero in the upland regions.
Public land makes up 16% of land cover, much of which is covered by native vegetation predominately along the Great Dividing Range and Grampians Range. The majority of land is broadacre farming dominated by cropping on the north and western plains and dryland pasture for livestock production (sheep for meat and wool, and beef cattle) in the south and east.
Salinity is an important waterway management issue in the region and entrenched within the Regional Catchment Strategy (RCS). Salt loads from the Wimmera River into the Lake Hindmarsh system are high and have a major negative impact on in-stream health. Saline discharge has been mapped along the western slopes of the Pyrenees Range and the northern slopes of the Great Dividing Range due to ‘break of slope’ processes. Primary salinity in the form of salt lakes is common with shallow water tables in adjacent areas posing a major challenge to productive land.
The Groundwater Flow Systems within the region range in scale from local, through intermediate, to regional or may be a combination of these; they usually increase in scale towards the north and west. Salinity has been recorded at over 1,340 individually mapped units1, covering an area of over 22,000 hectares1. Thirteen Salinity Provinces, of which 10 are High priority, have been defined in the region as a tool to better understand salinity processes and therefor management options.
The Wimmera CMA has an extensive range of online materials (maps and documents etc.) which outline the biophysical assets of the catchment, as well as their major risks (including soil and water salinity). This material also outlines the programs and projects currently being completed by the CMA to protect and enhance these assets. An example of this is the Wimmera CMA ‘Waterways Strategy’, the link to which can be found at the base of this page.
units1
Provinces displayed in this map are clickable or use the table of links provided
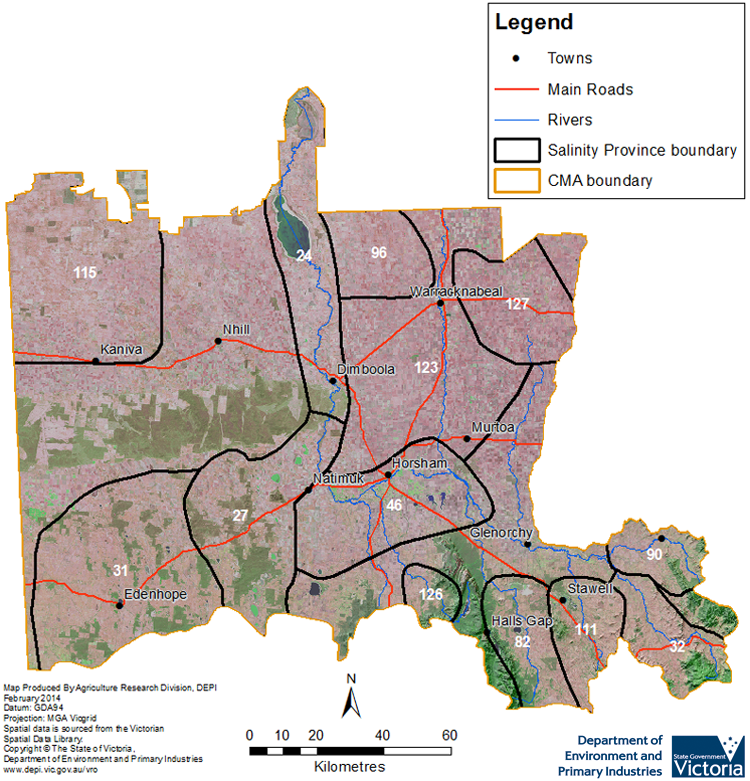
Province Name | No. | Area of Province (ha) | Recorded Soil Salinity Area 1 (ha) | Soil Salinity Area (% of SP) |
| Dimboola | 24 | 135,310 | 5,631 | 4.16% |
| Douglas Depression | 27 | 160,050 | 7,920 | 4.95% |
| Edenhope | 31 | 239,730 | 2,330 | 0.97% |
| Elmhurst | 32 | 69,530 | 137 | 0.20% |
| Horsham | 46 | 147,110 | 1,493 | 1.01% |
| Moyston | 82 | 69,590 | 2,125 | 305% |
| Navarre | 90 | 45,580 | 270 | 0.59% |
| Peppers Plains | 96 | 71,020 | 122 | 0.17% |
| Stawell | 111 | 60,940 | 208 | 0.34% |
| Telopea Downs | 115 | 234,920 | 798 | 0.34% |
| Warracknabeal Murtoa | 123 | 215,530 | 169 | 0.08% |
| Wartook | 126 | 23,540 | 210 | 0.89% |
| Watchem West | 127 | 97,410 | 556 | 0.57% |
1 Please Note: The ‘Recorded Soil Salinity Area’ and ‘number of individually mapped units’ indicated in the CMA text and/or table, comprises the total geographic area or number of sites that have been mapped as having, or showing symptoms of dryland soil salinity at some time (past or present). As dryland salinity occurrence in the Victorian landscape exhibits many different levels of severity and can change due to climate, landuse and vegetation, previously mapped areas may no longer be showing symptoms. In addition, as not all parts of the state have been mapped, or mapped in the same way, the mapping may not have captured some occurrences.
Recorded soil salinity mapping used for these pages does not cover irrigation regions. Instead, depth to watertable and watertable salinity mapping has been used to convey the threat of high watertables on soil waterlogging and/or soil salinisation.
Please contact the Department, your Catchment Management Authority or your rural water provider for more information about salinity in your location.
Links to further reading and material related to the Wimmera CMR
Wimmera Catchment Management Authority region on VRO
Wimmera Catchment Management Authority
Wimmera CMA ‘Regional Catchment Strategy’ (RCS)
Wimmera CMA ‘Waterways Strategy’
Information about bores and groundwater resources in the Wimmera CMA can be found on the Visualising Victoria’s Groundwater (VVG) website
© State of Victoria (Agriculture Victoria) 1996 - 2025.

This work, Victorian Resources Online, is licensed under a Creative Commons Attribution 4.0 licence. You are free to re-use the work under that licence, on the condition that you credit the State of Victoria (Agriculture Victoria) as author, indicate if changes were made and comply with the other licence terms.
The licence does not apply to ‘branding’ or some ‘images or photographs’ that may be owned by third parties. We ask you to seek prior approval to use images using the VRO feedback form. Access to higher quality images can also be provided on request.
This page was last updated on 23/03/2020.