
Salinity Provinces in the Port Phillip and Westernport Catchment Management Region
The Port Phillip and Westernport CMA Region covers almost 12,800 km2 representing about 5.6% of Victoria’s total area. It is extends southwest almost to Geelong, west through Gisborne almost to Daylesford, north almost to Kilmore, east to Drouin and southeast to Korumburra. It also includes both Phillip and French islands.
The region is Victoria’s most diverse and complex by virtue of its location, geography and demography. It encompasses the densely populated and urbanised State capital, Melbourne and its suburbs, growth centres on the urban fringe and rich rural land and natural parklands. The major river catchments are the Werribee, Maribyrnong, Yarra, Lang Lang and Bass Rivers, all with their origins in the uplifted hills in the northern or eastern parts of the region. The region’s system of approximately 8,400 km of waterways and water storage provides drinking water for three quarters of Victoria's population.
Around 50% of the region is rural farmland and 18% urban with major rural industries including horticulture, dairying, poultry farming, beef farming and viticulture producing a gross value in excess of one billion dollars per year. Almost 30% of the region retains remnants of its locally indigenous vegetation, including important areas of grasslands seldom found elsewhere. Of this vegetation, about 70% is protected and managed for conservation in parks or reserves and on other public land.
Catchment hydrology, water use and soil health are being increasingly affected by population growth and new urban development. Dryland salinity has emerged during past wetter climate phases in both urban and rural areas and still poses a risk to urban development in areas where it has been mapped in the past.. Salinity risk in the region is very localised, generally occurring in small areas associated with break of slope discharge or locally high watertables.
There are two independent groundwater basins in region, each consisting of several aquifers that are generally interconnected within each basin. Their groundwater salinity varies considerably between locations but generally increases towards the coast. Most of the Groundwater Flow Systems in the region are local, with few intermediate and regional systems occurring. Salinity has been recorded at almost 500 individually mapped units1, covering an area of nearly 2,600 hectares1. To better understand and manage salinity, 11 Salinity Provinces (seven of which are High priority) have been defined where similar geologic, geographic and biophysical conditions have been observed.
The Port Phillip and Westernport CMA has an extensive range of online materials (maps and documents etc.) which outline the biophysical assets of the catchment, as well as their major risks (including soil and water salinity). This material also outlines the programs and projects currently being completed by the CMA to protect and enhance these assets. An example of this is the Port Phillip and Westernport CMA report ‘Salinity in the Port Phillip and Westernport Region’ (2010), which provides extensive information about dryland salinity processes and occurrence in the region. The link to this document (and others) can be found at the base of this page.
Provinces displayed in this map are clickable or use the table of links provided
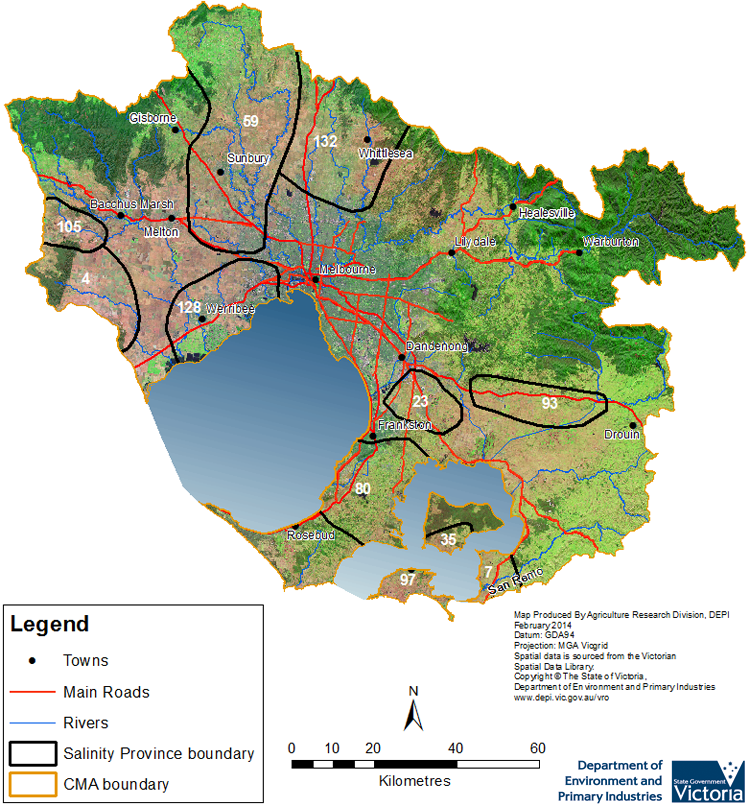
Province Name | No. | Area of Province (ha) | Recorded Soil Salinity Area 1 (ha) | Soil Salinity Area (% of SP) |
| Balliang | 4 | 37,330 | 17 | 0.05% |
| Bass | 7 | 10,380 | 438 | 4.23% |
| Cranbourne | 23 | 18,640 | 54 | 0.29% |
| French Island | 35 | 5,510 | 214 | 3.88% |
| Lancefield - Sunbury | 59 | 129,750 | 214 | 0.17% |
| Mornington | 80 | 44,750 | 226 | 0.51% |
| Pakenham Bunyip | 93 | 27,870 | 50 | 0.18% |
| Phillip Island | 97 | 10,070 | 698 | 6.93% |
| Rowsley | 105 | 14,280 | 18 | 0.13% |
| Werribee | 128 | 42,670 | 389 | 0.91% |
| Whittlesea - Craigieburn | 132 | 70,990 | 177 | 0.25% |
1 Please Note: The ‘Recorded Soil Salinity Area’ and ‘number of individually mapped units’ indicated in the CMA text and/or table, comprises the total geographic area or number of sites that have been mapped as having, or showing symptoms of dryland soil salinity at some time (past or present). As dryland salinity occurrence in the Victorian landscape exhibits many different levels of severity and can change due to climate, landuse and vegetation, previously mapped areas may no longer be showing symptoms. In addition, as not all parts of the state have been mapped, or mapped in the same way, the mapping may not have captured some occurrences.
Recorded soil salinity mapping used for these pages does not cover irrigation regions. Instead, depth to watertable and watertable salinity mapping has been used to convey the threat of high watertables on soil waterlogging and/or soil salinisation.
Please contact the Department, your Catchment Management Authority or your rural water provider for more information about salinity in your location.
Links to further reading and material related to the Port Phillip & Westernport CMR
Port Phillip and Westernport Catchment Management Authority region on VRO
Port Phillip and Westernport Catchment Management Authority
Port Phillip and Westernport CMA ‘Regional Catchment Strategy ’ (RCS)
Port Phillip and Westernport CMA report "Salinity in the Port Phillip and Westernport Region – A reference document for councils, agencies, community groups and landowners to assist the management of salinity.” (May 2010)
Interactive maps of the Port Phillip & Westernport CMR
Information about bores and groundwater resources in the Port Phillip and Westernport CMA can be found on the Visualising Victoria’s Groundwater (VVG) website
Relevant Information
© State of Victoria (Agriculture Victoria) 1996 - 2025.

This work, Victorian Resources Online, is licensed under a Creative Commons Attribution 4.0 licence. You are free to re-use the work under that licence, on the condition that you credit the State of Victoria (Agriculture Victoria) as author, indicate if changes were made and comply with the other licence terms.
The licence does not apply to ‘branding’ or some ‘images or photographs’ that may be owned by third parties. We ask you to seek prior approval to use images using the VRO feedback form. Access to higher quality images can also be provided on request.
This page was last updated on 23/03/2020.