
Soils and landforms of the Buchan and Suggan Buggan region
1. Introduction | 2. How to use this guide | 3. Overview | 4. Climate | 5. Land use | 6. Geology and geomorphology | 7. Rocks and sediments in East Gippsland | 8. Soil issues | Soil - landform units | Plant nutrients and interpretation of soil analytical data | Acknowledgements | References
| 1 Introduction Due to its remote location and lack of suitable cropping areas, there is little available soil and land information for the Buchan valley and Suggan Buggan region of East Gippsland. This manual covers an area of approximately 47,500 hectares of freehold land within the Buchan and Snowy River catchments. The manual presents information about the geology and geomorphology of the study area and includes soil descriptions, management issues and chemical and physical analyses from some but not all of the landform map units. Limitations The soil descriptions in this guide are based on a very limited number of observations. To delineate the map unit boundaries, both geological and topographical maps were used as well as a limited number of field observations. A number of sites were selected as being representative of the map unit and pits dug to about 1 m or until rock was encountered. The exposed soil profiles were described and soil samples sent for limited soil analysis. As no information has previously been published, this guide will help fill a gap in knowledge about the land and its soils. Top |  |
Within a given locality soils which share common characteristics can be grouped together and distinctions can be made between other ‘groups’ of soils. For example, the soils and topography of hills around Buchan are quite different to that around Wulgulmerang.
This guide is based on ‘soil landform map units’ (Table 1), which are map units that have similar geology, topography and range of soil types. Each map unit may have two or three separate ‘types’ of soil, called ‘components’ which would be difficult to separate without making the map too complicated. For example, within a given ‘soil landform map unit’ there may be one component typical of the hill crest, another on the slope and another on the more gently sloping land.
Many of the map units have distinguished between land which has slopes generally less that 15% and land with slopes generally exceeding 15%. This was done to separate land which is regarded here as too steep for normal cultivation.
We have decided to give the same soil landform map unit name to all areas with a similar set of soils formed on a similar type of parent material, similar topography and similar climate. These soils will also usually have similar natural vegetation. For example the soil landform map unit ‘Talbotville’ was named after an area around Talbotville (about 25 km north-west of Dargo) which had mostly shallow soils on steep topography developed on Palaeozoic (Ordovician, Silurian and Devonian) sedimentary rock. Similar soils and landforms occur elsewhere in Gippsland so the same name has been given to all other similar soil landform map units.
Following the soil landform map unit descriptions is a section titled ‘Plant nutrients and interpretation of soil analytical data’ and a glossary of soil terms. These sections will assist some readers to better interpret the soil information provided within each map unit.
Table 1. Soil landform map units based on the underlying rock/sediment, elevation, rainfall and landform pattern
Name | Symbol | Rock/Sediment | Elevation (m) | Terrain Slope | Relief (m) | Landform Pattern |
| Ambyne | Ae | Granite and gniesses | 200-800 | <32 % | 90 - 300 | Rolling hills |
| Buchan# | Bc | Devonian Limestone | 80-350 | <32 % | <300 | Rolling low to steep hills |
| Buchan South# | BS | Early Tertiary sediments | 150-300 | <32 % | 30 - 90 | Undulating low hills |
| Carrabungla | Ca | Devonian acid volcanics | 250 - 1000 | >32 % | 90 - 300 | Steep hills |
| Dargo# | Do | Granite and gniesses | 50-500 | <32 % | 30 - 90 | Rolling low hills |
| Gelantipy# | Gy | Tertiary basalt | 600-950 | <32 % | 30 - 90 | Undulating to rolling low hills |
| Talbotville | Te | Palaeozoic sediments | 250-1200 | 10 - 56 % | >300 | Rolling to steep mountains |
| Tambo# | Tb | Palaeozoic sediments | 200-300 | <32 % | 30 - 90 | Rolling low hills |
| Taravale# | Tv | Devonian marlstone | 80-350 | <32 % | 90 - 300 | Rolling low to steep hills |
| Tea Tree | Tt | Quaternary alluvial sediments | 50-200 | 1-3 % | <9 | Flood plain |
| Tubbut | Tu | Granite and gniesses | 200-800 | >32 % | Up to 500 m | Steep hills to steep mountains |
| W Tree | WT | Tertiary basalt | 450-650 | Mostly <32 % | <300 | Rolling to steep low hills |
| Wulgulmerang | Wl | Devonian acid volcanics | 300-1000 | Mostly <10 % | 30 - 90 | Rolling low hills |
# Slopes within these map units are generally less than 15 %.
Top
3 Overview
3.1 Buchan South to Suggan Buggan
This section of the report covers the freehold land from south of Buchan to Suggan Buggan. The underlying geology of the surrounding steep hills surrounding most of the entire area until descending into Suggan Buggan is predominantly Devonian rocks, mainly acid volcanic rocks collectively known as Snowy River Volcanics. South of Buchan there are remnants of the sandy and gravelly Pliocene (late Tertiary) sediments which also cover most of the coastal lowlands from Bairnsdale to Cann River. Most of the area around Buchan is an enclosed valley comprising Devonian limestone, which is younger than the Snowy River Volcanics. North of Buchan the elevation rises rapidly from about 200 m ASL at Murrindal to 500 m ASL at W Tree. The elevation from W Tree to Wulgulmerang rises gradually from 500 m ASL to 900 m ASL and may be described as a dissected plateau, mostly comprised of Eocene (early to mid Tertiary) basalt, with the rocks below the escarpment and above the dissected plateau being the Snowy River Volcanics. The basalts occupy an old abandoned valley that lies about 200 m above the present valley (Webb et al., 1991). Higher areas within the plateau not mantled with basalt are also Snowy River Volcanics. Just north of Mt Hamilton on the road to Suggan Buggan, Silurian granite rocks are encountered and the road descends rapidly from about 900 m to 390 m at the Snowy River crossing.
Soils
Around Suggan Buggan the soils are developed on Silurian granite. The area has been arbitrarily subdivided into the Ambyne map unit which has slopes generally less than 32% and Tubbut map unit, with slopes generally greater than 32%.
The soils on the Snowy River Volcanics are generally pale coloured, deep, acidic, silty loams to sandy loams overlying sandy clays or medium clays. Because of their sandy nature, they have a low water and nutrient holding capacity. On steep slopes of the Carrabungla map unit the soils are quite shallow and rock outcrops are common. The topography of the Wulgulmerang map unit is much flatter and the soils generally deeper.
The soils on Devonian limestone vary greatly in depth and colour and all are strongly structured. Colours vary from dark greyish brown to dark red. The clay contents above the underlying limestone are high, generally over 50 per cent. Being derived from limestone, the soils are generally alkaline. The little soil existing over the limestone is high in both water and nutrient holding capacity, so the agricultural potential is largely governed by the depth to limestone. The limestone country has been subdivided into two map units, the Buchan map unit and the Taravale map unit, based on the nature of the underlying limestone. The underlying limestone of the Taravale map unit, which is described as marlstone, appears to be softer and results in generally deeper soils. The underlying limestone of the Buchan map unit is dense and recrystallised, resulting in shallower soils and more rock outcrops.
There is a wide variation in the properties of the soils developed on the Tertiary basalts. Mostly the soils are slightly acidic, strongly structured, dark greyish brown or dark reddish brown clays or clay loams overlying similarly coloured medium clays. In flatter and wetter areas the soils tend to be greyer and show a marked increase in clay content between the surface soil and subsoil. In these soils, ironstone pebbles above the clay are a common feature. The soils on basalt generally have a moderate to high water and nutrient holding capacity. Basalt rock is often exposed on the slopes adjoining streams. The W Tree map unit is more hilly and lower in elevation than the Gelantipy map unit. The latter unit covers most of the basaltic soils from just south of Butchers Ridge to Wulgulmerang.
The soils on the gravelly sandy Tertiary sediments south of Buchan are generally dark grey acidic gravelly or sands or sandy loams becoming paler with depth overlying brown to yellow brown sandy clays to medium clays. Because of the sandy or gravelly nature of the surface soils, they tend to have low water and nutrient holding capacity. These are mapped as the Buchan South map unit.
The Recent sediments are in the river and creek flats. The soils of the Buchan river flats appear to be gradational soils with slightly acidic very dark greyish brown clay loam surface soils passing to brown medium clays in the subsoil. South of Buchan, the soils are mostly texture contrast soils with grey acidic sandy loams to clay loams overlying a bleached similarly textured subsurface horizon. Mottled yellowish brown clays occur in the subsoil. Because of their limited extent, all of the soils are grouped under the Tea Tree map unit.
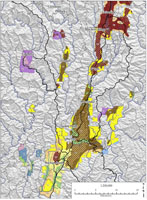 soil - landform map units of the Buchan Gelantipy region | 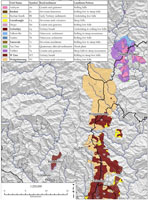 Soil - landform map units of the Gelantipy Suggan Buggan region |
3.2 Elsewhere
Minor areas of other map units are also covered in this manual.
A small area of the Talbotville map unit occurs north of Suggan Buggan. This comprises red gradational soils formed on metamorphosed Palaeozoic sediments. The Tambo map unit west of Buchan is formed on Palaeozoic sediments and is a yellow coloured texture contrast soil prone to tunnel and gully erosion. Small areas of the Dargo map unit occur both west and east of Buchan. These are yellow and brown texture contrast soils on granite.
More detailed information on these map units is given in the report ‘Soils and landforms of the Omeo/Benambra and Tambo Valley region’.
Top
4 Climate
4.1 Temperature
Average daily mean maximum and minimum temperatures for Orbost and Gelantipy are given in Table 2.
Table 2: Mean maximum and monthly temperatures and related plant growth for Orbost and Gelantipy
Jan | Feb | Mar | Apr | May | June | July | Aug | Sept | Oct | Nov | Dec | |
| Orbost (41 m ASL) | ||||||||||||
| Mean maximum temp. | 25.5 | 25.4 | 23.8 | 20.9 | 17.7 | 15.2 | 14.8 | 16.0 | 17.9 | 19.8 | 21.6 | 23.6 |
| Mean minimum temp. | 13.2 | 13.4 | 12.0 | 9.3 | 7.1 | 5.2 | 4.2 | 4.8 | 6.3 | 8.3 | 10.2 | 11.8 |
| Gelantipy (755 m ASL) | ||||||||||||
| Mean maximum temp. | 23.8 | 22.9 | 20.1 | 16.4 | 13.0 | 10.2 | 9.5 | 11.3 | 13.8 | 16.2 | 19.0 | 21.2 |
| Mean minimum temp. | 11.6 | 11.3 | 9.3 | 6.7 | 4.9 | 3.2 | 2.1 | 2.9 | 4.4 | 5.7 | 7.8 | 9.4 |
4.2 Rainfall
The special position of East Gippsland in relation to converging weather patterns from both the north-west and west and the east coast lows from the north means there is a generally even distribution of rainfall throughout most of the year.
Table 3: Mean annual rainfall for Orbost, Gelantipy and Wulgulmerang
Jan | Feb | Mar | Apr | May | June | July | Aug | Sept | Oct | Nov | Dec | Tot | |
| Orbost (41 m ASL) | |||||||||||||
| 1883 - 2010 | 66.7 | 58.7 | 66.0 | 73.8 | 69.9 | 85.1 | 67.4 | 58.4 | 71.4 | 76.8 | 72.5 | 77.7 | 844.4 |
| Gelantipy (755 m ASL) | |||||||||||||
| 1994 - 2010 | 64.1 | 63.2 | 50.6 | 54.0 | 47.9 | 54.3 | 49.4 | 48.1 | 57.8 | 67.2 | 99.7 | 61.0 | 718.8 |
| Wulgulmerang (914 M ASL) | |||||||||||||
| 1970 - 2009 | 56.6 | 58.7 | 58.6 | 45.2 | 43.3 | 54.4 | 45.4 | 46.1 | 59.5 | 65.9 | 87.6 | 63.6 | 691.9 |
North of Buchan the mean monthly precipitation is relatively uniformly distributed until late spring, when there is a weak maximum (Table 3). There is no available information on rainfall intensity but late summer heavy thunderstorms occur erratically. Depending on ground cover, these are potentially critical periods for erosion.
Table 3 does not give any indication of the variability of the rainfall. From year to year the monthly rainfall is highly variable, which makes it difficult to predict beginning and end of the growing season.
Top
5 Land use
5.1 Land use
Agriculture, forestry, nature conservation, recreation and residential use are the main present land uses. Cattle and sheep grazing is the most widespread form of agriculture in the area although there are small areas of horticulture on the red basaltic soils around W Tree.
5.2 Nature conservation and recreation
This manual’s study area adjoins a small part of the Alpine National Park. At 646,000 ha, it is the State's largest park, which, with adjoining national parks in NSW and the ACT, forms a protected area over most of Australia's high country. Extensive snowfields are the primary winter attraction; while the warmer months bring stunning wildflower displays and opportunities for bushwalks and four wheel driving. The 650 km Australian Alps Walking Track traverses the Alps from Walhalla to Canberra.
Top
6 Geology and geomorphology
The account given below of the geological history of East Gippsland has been simplified. Much of the region is in rugged and remote mountain country. Its geology is quite complicated and influenced by numerous faults. Only recently have geologists begun to unravel its geological history.
Table 4: Geological time scale showing approximate age of significant events in East Gippsland
| Era | Period | Epoch | Millions of years | Significant event |
| Quaternary | Recent | Last 10,000 yrs | Modern rivers incise into older flood plains | |
| Pleistocene | 1.6 | Formation of the terraced eastern plains formed by stream deposition from Toongabbie to Lakes Entrance. Several periods of ice age conditions followed by warming | ||
| Pliocene | 5 | Deposition of sands and sandy clays following the uplift of the Eastern Highlands. Plains extend along the southern footslopes of the Highlands from Traralgon to Orbost | ||
| Miocene | 23 | Major uplift of the Eastern Highlands | ||
| Tertiary | Oligocene | 36 | Volcanic flows near Gelantipy and the Fraser Tableland | |
| Eocene | 53 | Brown coal deposits in Latrobe Valley | ||
| Palaeocene | 65 | Australia drifts clear of Antarctica | ||
Cretaceous | 145 | Extinction of dinosaurs Age of upper Otway and Strzelecki rocks | ||
Jurassic | 205 | Development of rift between Australia and Antarctica | ||
Triassic | 250 | Granitic rocks and Volcanic flows near Benambra | ||
Permian | 290 | Ice covered most of Victoria, causing considerable denudation of the highlands | ||
Carboniferous | 360 | Minor tectonic event causing faulting | ||
Devonian | 405 | Major uplift, faulting and folding. Mountains formed in Eastern Victoria. Granitic and volcanic rocks in Central Victoria Buchan basin formed Major uplift, folding and faulting. | ||
Silurian | 436 | Granitic and volcanic rocks in Eastern Victoria Shallow sea in a trough from Bairnsdale to Corryong Major uplift, faulting and folding of much of East Gippsland. Much of Victoria became dry land | ||
Ordovician | 510 | Most of Victoria under a deep sea. Sediment from mountains in South Australia and far western Victoria accumulated on sea floor | ||
Cambrian | 560 | |||
| Pre-Cambrian | 4600 | |||
Palaeozoic Era
The oldest sediments in this area are those deposited under deep marine conditions during the Ordovician (510 to 435 million years ago) when all except the far west of Victoria was under a deep sea. A major period of orogeny, which is the term given to periods of mountain building, occurred during the Late Ordovician – Early Silurian (440 – 420 million years ago ). This orogeny, called the Benambran Orogeny, was very intense and resulted in considerable folding, shearing and faulting. Substantial areas of Victoria subsequently became dry land.
The Late Silurian and Early Devonian Periods (about 400 – 420 m.y.a.) were marked by another period of mountain building, the Bowning/Bindian Orogeny. In Gippsland this resulted in the sediments of the Cowombat Rift being uplifted. Most of the granite intrusions into the region east of Dargo were formed during this period. This granite formed as a result of molten magma melting the overlying sediments and then solidifying. The sediments around these granite intrusions are often hardened into schists due to contact metamorphism. Soon after, still in the Early Devonian, a new north-south depression, called the Buchan Basin, developed across eastern Victoria, partially overlapping the older Cowombat Rift. The Basin contains two major rock units, the Snowy River Volcanics and the overlying Buchan Group, a shallow water limestone, such as around Bindi and Buchan.
The Bowing/Bindian Orogeny, however, did not affect the Melbourne Trough in central Victoria. Sediments in that basin accumulated almost without interruption from the beginning of the Ordovician Period through until the end of the Devonian Period, a period of over 100 million years.
Another dramatic period of major mountain building and deformation which affected most of Victoria, the Tabberabberan Orogeny, occurred during the Early to Mid Devonian Period (about 390 – 370 m.y.a.). This produced a major mountain range, called the Tabberabban Highlands, in Eastern Victoria. Uplift associated with this event caused the sea to retreat to the east, so that by about the end of the Devonian Period the eastern coastline in Victoria was close to its present position. Volcanic activity and granite intrusions occurred in the Melbourne Trough towards the end of the Devonian period.
A large sedimentary basin, 40 - 50 kilometres wide and extending from Valencia Creek to Mansfield developed west of the Tabberabban Highlands. This basin was first partly filled by rhyolites and rhyodacites (volcanic rocks) during the Late Devonian Period (about 370 m.y.a.), and later, during the Early Carboniferous (about 350 m.y.a.), by a thick body of fresh water sediments. These sediments are mainly conglomerate, pebbly sandstone and siltstone. They occur in an area north of Glenaladale and over much of the Avon River catchment but not within the present study area.
Towards the end of the early Carboniferous Period, about 350 m.y.a., there was a widespread but not very intense deformation known as the Kanimblan Orogeny which uplifted central and eastern Victoria. This caused some folding. This was the last major tectonic event in Victoria until the Lower Cretaceous Period, about 120 million years ago. However during the Late Carboniferous and Permian Periods, about 290 m.y.a., Victoria was positioned closer to the South Pole and largely covered by glaciers. Erosion over this period as glaciers moved northwards changed the Victorian landscape greatly, although no glacial sediments occur within our study area.
Over long periods of time, glaciers and other forms of erosion have worn down the land surface with the result that much of the formerly deep granites and metamorphosed sediments are now exposed at the surface.
Mesozoic Era
The earliest rocks from this era are those belonging to the Triassic Mount Leinster Igneous Province (about 230 – 200 m.y.a.) which lies mostly within the Benambra 1:100 000 map area but several of the granites extend into the Omeo 1:100 000 map area and there are also trachyte lavas, plugs and dykes. Examples of the granite– like intrusions are Little Mount Tambo, Prendergast Lookout and The Brothers. No rocks from this period occur within the area covered by this report.
In the Late Jurassic and Early Cretaceous Periods (160 – 96 m.y.a.), Australia and Antarctica began to split apart. As they moved apart, a long rift valley was slowly filled up by as much as 3,000+ metres of fresh water sediments. These were largely volcanic material, probably from volcanoes within the valley. In addition, alluvial material was deposited by river and streams from either side of the valley. Some of these sediments formed coal deposits. Many contain plant and animal fossils, including dinosaurs. The Otway and Strzelecki Ranges, which are formed from these sediments, were uplifted during the Middle to Late Cretaceous Period as Australia continued to move northward. Minor earthquakes associated with faulting still occur from time to time. None of the sediments in these areas are covered by this report.
South of the Dividing Range the sedimentary basin that developed in the Early Cretaceous Period continued to widen and deepen, forming the Gippsland Basin in the Late Cretaceous to Early Palaeocene Periods (about 70 – 60 m.y.a).
Cainozoic Era
Tertiary Period
The Tertiary Period extends from 65 to about 1.8 m.y.a. The earliest Tertiary rocks in this area are minor occurrences of Palaeozoic basalts (57 – 55 m.y.a) for example, near Gelantipy and the Fraser Tableland. More extensive areas occur around Warragul and Thorpdale.
Over most of the Tertiary Period the Gippsland Basin was in-filled, mostly by sediments originating from the highlands. The undulating foothills immediately north of Bairnsdale, around Nowa Nowa and extending to east of Orbost are based on sediments deposited during the Tertiary Period. Early deposits are marine, but later deposits are alluvial. The end result was an extensive plain, which is now quite dissected. These sediments also underlie all of the Gippsland Plains, which are now largely covered by a veneer of younger (Quaternary) sands and clays. There are small remnants of Tertiary sediments just south of Buchan, some being quite gravelly.
Quaternary Period
The Quaternary Period extends from about 1.8 million years to the present and is subdivided into Pleistocene and Recent (10,000 years ago to the present). There were several ice ages during the Quaternary Period which caused considerable rises and falls in sea levels. This was because as ice caps grew in size and water contracted with cooling, the water levels in the oceans dropped.
The last ice age was about 17,000 to 20,000 years ago. It resulted in a sea level fall of about 150 metres and a land bridge being established between Australia and Tasmania. As well as being cold, the climate was dry and windy. Additional sand was probably blown in from the south-west. The lower sea levels caused the major Gippsland Rivers to cut deep valleys into the plains, which then became partly in-filled as the sea level rose to its present level.
The only Quaternary sediments that occur in this area are those covering the rivers and creek flats.
Additional geological information for the area covered by the Murrindal 1:100 000 mapsheet (8523) can be obtained from the Geological Survey of Victoria Report 100 produced by Orth et al (1995). It gives a comprehensive account of the physiography, geological history and landscape evolution, Palaeozoic and Cainozoic rock units, structural and economic geology, and a full list of references. The main geophysical features of the area, and the metallic and non-metallic mineral deposits and mineral exploration history are also described. The Geological Survey Report can be ordered from the Department of Primary Industries website (www.dpi.vic.gov.au).
Top
7 Rocks and sediments in East Gippsland
7.1 General classification of rocks
In East Gippsland the soils have been formed both on hard rock and loose material transported by water or wind, or collecting
from higher up a slope. This is known as the ‘parent material’ of the soil. Hard rocks in the area include:
Igneous rocks: Rocks formed from molten rock – either deep below the earth’s surface (plutonic, such as granites) or at the earth’s surface (volcanic, such as the basalts around Gelantipy). Granitic rocks are normally coarse grained – meaning one can see the different coloured mineral grains in the rock with the naked eye, whereas the mineral grains in volcanic rock are fine and normally only seen under magnification.
Sedimentary rock: Rocks formed from the erosion products of other rocks or sediments, from shells and corals (e.g. limestone) or plant remains (e.g. coal). They may also be subdivided into hard sediments or soft sediments, including unconsolidated sediments that have not yet formed the hard material we would usually think of as ‘rock’. Depending on the particle sizes in the sediments, hard sediments may be subdivided into conglomerates that are mostly of stony material, sandstone, siltstones and mudstones.
In Gippsland, most of the hard sedimentary rocks were formed from ancient sediments deposited in the Palaeozoic era. These rocks vary in hardness depending on the degree of metamorphosis they have experienced; for example, those formed from finer sediments range from mudstones, shales, schists to gniesses, with mudstones being softest and gniesses hardest. The gniesses here are similar to granite in grain size and like granite, weather to produce sandy soils. Sandstone may become metamorphosed into quartzite.
Soft sediments in East Gippsland are generally less ancient, from the Cainozoic era or later, e.g. the brown coal deposits in the La Trobe Valley. Perhaps the most extensive areas of soft sediments in East Gippsland are the undulating plains immediately south of the Eastern Highlands, extending from Stratford to Cann River. These were mostly deposited during and after a major uplift of the Eastern Highlands about 5 million years ago. Periods of wind, aridity and cold during the last ice age, about 20,000 years ago, have resulted in some of this area becoming partially mantled in sand. The youngest sediments are those in the present river valleys and flood plains.
Metamorphic rock: Any rock which has been changed substantially by heat, pressure or deformation. In Gippsland these include schist, gneiss and quartzite. The rocks may be changed by heat and shearing during periods of mountain building, e.g. the rocks around Ensay North, or by heat due to contact with granites as they cooled deep underground, e.g. steep hills around the granites near Dargo.
7.2 Rocks to soils
The longevity of stone, whether it is in a building, gravestone or bridge shows us the transformation of rock to soil is an extremely slow process. Even when a depth of soil has accumulated, the development of a soil profile such as a texture contrast soil similar to those seen in road cuttings, for example between Traralgon and Bairnsdale, and south of Omeo, is believed to take tens of thousands of years.
Soils form from rock as a result a process termed weathering, and includes both physical and chemical processes. Chemical processes are more active at the surface of the rock fragments, the smaller the rock fragment the more rapidly it will decompose. Thus physical processes that break rocks down into smaller fragments greatly speed up the chemical processes that convert rock to soil.
Physical weathering is the breakdown of rock by entirely mechanical methods. Sometimes the forces leading to the breakdown of rock originate within the rock; at other times forces are applied externally. Cracks often develop in rocks close to the surface and frost can crack rocks when water confined in these cracks freezes and expands. Temperature changes cause expansion or shrinkage in rocks, and repeated changes in temperature cause the rock to crack or break up, particularly when soil particles fall into the crack and prevent it from closing. Wetting and drying of mudstones can also result in physical weathering as water molecules orient themselves around the clay particles and force them apart. Other methods of physical weathering include mechanical abrasion and collapse under gravity, causing the rock to break down into smaller fragments.
Plants, including mosses and lichens, are a major factor in soil formation. Roots break open small cracks in the rock, help keep the soil in place and retain water necessary for continued weathering.
Chemical weathering is the change in the mineral composition of the rocks and rock fragments. These changes are brought about by oxygen, water and the dissolved carbon dioxide in water. Higher temperatures accelerate the process. After prolonged weathering, the major weathering products of rocks are clays of various types and quartz, which is most resistant of the common minerals to chemical attack. Most silt, sand and gravel particles in a soil are quartz. Soils formed from granite generally have a high coarse sand component because of the quartz crystals present in granite.
Climate has a major bearing on soil formation. The effects of climate on soil formation are further complicated as it effects both plant production and biological activity, which in turn further influences the soil profile. As the rainfall and temperature increases, biological activity also increases often resulting in deep disturbance of the soil profile and the consequent absence of a marked clay horizon deeper in the soil profile. Organic matter content in surface strata can be higher than of soils formed under lower rainfall. Examples of these types of soils are found under the damp mountain ash forests of Gippsland.
Position within the landscape is a major determinant of the rate at which soil material accumulates. The soil in mountainous and very steep hilly land is generally rapidly eroded away, leaving only a shallow soil cover. Here there are comparatively young soils on geologically old rock. On the other hand, soil tends to be deeper on flatter land as erosion rates are slower. Lower slopes and valleys tend to collect soil washed from elsewhere as colluvium (material that moves under gravity down slope) and alluvium (material moved by water) and can have deeper soils.
A defined soil profile slowly develops once a sufficient depth of soil has accumulated. Over time, clay may gradually move down the soil profile: the end stage of this process is the formation of a texture-contrast soil with well defined clay subsoil. Many soil profiles in East Gippsland show this feature. Organic matter tends to accumulate in the topsoil, resulting in darker colours. Iron oxide also moves downwards resulting in stronger, brighter colours in the clay horizon. Often iron oxide nodules or concretions accumulate above clay, but whether these are remnants of earlier soil profiles is open to conjecture.
In the strongly structured soils developed over basalt, e.g. around Gelantipy, the high amount of free iron oxide converts the clay particles into stable clay aggregates. These clay aggregates are not easily moved down the soil profile and texture contrast soils do not occur. In river valleys and low lying areas, soil accumulates so rapidly a well defined soil profile has little chance to form, other than an accumulation of organic matter in the topsoil. In these situations soil texture is uniform throughout the profile or changes only gradually with depth.
Soil classification
In describing a soil the major properties looked at by soil scientists include:
- The position in landscape and the degree of slope (e.g. eastern mid-slope 15%)
- The sand, silt and clay content – as determined by its soil texture (or feel between the fingers when moist)
- Degree of contrast in texture of successive horizons and the sharpness of the transition
- Colour of each horizon
- Size, shape and consistence of the natural aggregates (peds) and the pattern of cracks between them
- Presence or absence of free lime, either as white streaks or as large round concretions
- Presence or absence of ironstone gravel
- Degree of acidity or alkalinity
- Depth to parent rock or unconsolidated parent material.
Australian soil classification
| Soil order | Example | |
| Human made soils | ANTHROPOSOLS | Highly disturbed building sites |
| Dominated by organic materials | ORGANOSOLS | Dark peaty soil on the High Plains |
| Negligible pedological organisation | RUDOSOLS | Shallow soils on steep hilly uncleared forest land north of Tambo Crossing |
| Weak pedological organisation | TENOSOLS | As above, but slightly deeper soils |
| Bs, Bh, or Bhs horizons* | PODOSOLS | Deep sand soils just east of Providence Ponds (Perry River) |
| Clay ≥ 35% in all horizons, cracks, slickensides | VERTOSOLS | Cracking clay soils on the flats near Lake Omeo |
| Prolonged seasonal saturation | HYDROSOLS | Swamp soils |
| Strong texture contrast between A and B horizons pH < 5.5 in upper B horizon | KUROSOLS | Typical soils exposed on road cuttings between Lakes Entrance and Cann River |
| Sodic in upper B horizon with pH ≥ 5.5 | SODOSOLS | Typical soils on the Munro Plains Common around Swifts Creek |
| Non-sodic in upper B horizon with pH ≥ 5.5 | CHROMOSOLS | Many soils on undulating land around Omeo |
| Lacking strong texture contrast between A and B horizons Calcareous throughout profile or below A1 | CALCAROSOLS | None in this area (Certain Mallee soils) |
| High free iron B2 horizon | FERROSOLS | Dark red and brown heavy loam soils around Gelantipy and Fraser Tableland |
| Structured B2 horizon | DERMOSOLS | Many soils on undulating land around Cobungra |
| Massive B2 horizon | KANDOSOLS | Not common in Gippsland |
Bs (iron or aluminium oxide enriched B horizon)
Organosols with their peaty top-soil are common on the High Plains. Rudosols and Tenosols are generally shallow soils in Gippsland and common on steep slopes with little soil cover. Podosols are mainly sandy soils with ‘coffee rock’ at depth in the soil profile and frequently occur in the foothills. Vertosols are high clay content soils and are found on the Benambra flats. Kurosols and Chromosols are common on undulating land comprising a variety of rock types and sediments. Kurosols are acidic and may benefit from lime applications, whereas Sodosols are sodic and prone to gully and tunnel erosion. Ferrosols, which are dark brown to red well-structured loam soils on basalt, occur around Gelantipy and the Fraser Tableland and are well suited to intensive agriculture. Dermosols and the weakly structured or massive Kandosols are common in higher elevations on the Devonian acid volcanics and granites. With the exception of Anthroposols and Organosols, examples of all of these soil orders are described in East Gippsland.
Top
8 Soil issues
Soil must be physically, nutritionally and biologically balanced to be productive and stable. Soil structure decline, soil acidification and soil erosion are common soil health issues with the potential to severely restrict agricultural productivity on susceptible soil types, while erosion may also contribute to downstream sedimentation and turbidity within water storages (Hollier 2003).
In order to protect the soil, it is important to maintain groundcover in the form of living plant material, failed crops, and crop stubbles or pasture residues. The Drought Preparation and Survival Guide (NRE 2002) points out the amount of groundcover will depend upon the region, soil type and seasonal weather expectations and it is important to remember pasture and stubble will deteriorate over time due to trampling, wind and rain damage.
8.1 Soil structure decline
Soil structure, or pedality, refers to the arrangements of soil particles and the spaces (pores) between them. Natural aggregates are called peds, therefore a soil may be pedal or apedal depending on the presence or absence of peds. The structure of a soil governs infiltration and the volume of air and water available for plant growth. Structural deterioration leads to surface crusts and compaction which inhibit plant growth and reduce soil biological activity. Soil structure can be maintained by paying attention to stocking rates, removing livestock from wet areas, and maintaining vegetation cover (Hollier 2003).
8.2 Soil erosion
The steeper slopes in the study area are highly prone to water erosion, particularly sheet and gully erosion. Sheet erosion is caused by heavy rain falling on unprotected slopes and is characterised by a more or less uniform wasting away of the surface soil. It rapidly reduces the productivity of land by carrying off the rich organic matter and readily available plant food, and may continue for lengthy periods undetected. If unchecked it is rapidly followed by rill and gully erosion (SEC 1938).
Gullies are defined as open erosion channels at least 30 cm deep that conduct ephemeral runoff and are frequently characterised by steep side walls and a lack of vegetation, whereas rills are narrower and shallower than gullies (Boucher 2006).
Topsoil dislodged and carried away by wind or water removes nutrients such as nitrogen, phosphorus and organic carbon, which are integral components for the health of the soil and production. With every millimetre of topsoil eroded, it is estimated about 13 t/ha of topsoil, 130 kg/ha of organic carbon3, 20 kg/ha of nitrogen equivalent to 40 kg of urea and 8 kg/ha of phosphorus equivalent to 100 kg of super phosphate are lost. It is possible to replace phosphorus and some nitrogen through fertiliser application, however organic carbon and nitrogen take years of careful management to restore. Hence soil erosion will decrease the productivity of the land for many years to come (NRE 2002).
Climate in relation to erosion
Rowe (1967) observed high-intensity rainfall is responsible for initiating most of the serious erosion in the region and therefore the condition of the land upon which high intensity rainfall occurs is critical. The remedy is to maintain as dense a ground cover as practicable and careful grazing management of the pastures in summer is necessary, particularly on slopes, so overgrazing does not reduce cover below suitable limits.
Frost can also be a powerful agent of erosion, particularly when occurring upon bare soil, where frost action causes the surface to crumble and become powdery, thus also becoming susceptible to wind erosion. This form of erosion may occur at any time of the year in the sub-alpine and alpine tracts and again is prevented by maintaining ground cover (Rowe 1967). This does not appear to be a major concern in this area.
8.3 Soil acidity
Soil acidity is not a problem for the soils developed over limestone around Buchan. Elsewhere most are moderately acid at the surface, which is with a pH between 5.5 and 6, with areas of strongly acid soils (pH 5-5.5). Landcare Victoria (1992) estimates strongly acid soils, i.e. pH of less than 5.5 in water, affects 1.2 million ha of Victoria’s agricultural land, costing $15 million in lost production annually.
Extremes in acidity present problems for the production of many agriculturally important clover species and their symbiotic rhizobia. Soil chemistry is complex and it can be difficult to identify the precise cause of poor plant growth or nodulation. However, aluminium and manganese toxicities, as well as molybdenum and phosphorus deficiencies, are probable causes of poor production in many strongly acid soils (DPI 2004).
In a report titled ‘The impact of acid soils in Victoria’ Slattery (2002) suggest the causes of soil acidity are:
- Removal of product from the farm or paddock
- Leaching of nitrogen as nitrate below the plant root zone
- Build up of organic matter
- Inappropriate use of nitrogenous fertiliser
- Erosion of top soil, sub-soil becoming surface soil.
Other factors needed to determine an appropriate lime rate include target pH of the specific plant, lime quality, application method and economics (DPI 2004). The use of acid tolerant plants is widespread in the higher rainfall grazing areas. Many producers rely on moderate to highly tolerant pasture species (eg subterranean clover, perennial ryegrass and cocksfoot). Since the mid 1990s there has been a revival in the establishment of perennial systems (phalaris). This trend is reflected in increased lime usage. There is growing interest in low input native pastures for light textured, rocky or steep areas where it is difficult to apply lime (Hughes 2001).
Soil ameliorants
Many of the surface soils, particularly on the Wulgulmerang map unit, are moderately to strongly acid. To overcome soil acidity, lime is often added at rates which are determined by the degree of acidity and the surface texture. Before lime is added it is usual to have test strips to see whether lime is going to provide an economic benefit. When the pH of the surface soils are higher than 5.5 (moderately acid) it is most unlikely that adding lime will be economic. At pH levels between 5.3 and 5.5, adding lime is also unlikely to be economic. Below pH of 5.3, adding lime may be beneficial. A pH test sampled from across the paddock would be most appropriate to determine whether lime is needed to raise soil pH. Other factors need to be considered before lime is recommended (e.g. pasture species grown, method of application, local trial responses, soil surface structure and likely cost/benefit).
Fertilisers
It is not possible for this report to comment specifically on fertiliser requirements for the various map units. The main ones used are phosphatic fertilisers, generally with added molybdenum, and potassium fertilisers. Specialist advice on soil tests should be sought prior to fertiliser applications.
Removal of phosphorus and potassium
The main agricultural uses in the area are grazing for meat and wool production. These activities remove a certain amount of plant nutrients, which in the long term deplete the phosphorus and potassium reserves in the soil. Approximate guides to the amounts removed are given in Table 5.
Table 5: Potassium and phosphorus removed by product, approximate values only
Product | Phosphorus (g) | Potassium (g) |
| Hay 50-50 grass clover (1000 kg) | 16 | 110 |
| Wool (60 kg) | 0.25 | 3 |
| Livestock (live weight) Beef (1250 kg) Lambs (400 kg) | 9 2 | 2.5 1 |
Top
Soil - landform units
Top
Plant nutrients and interpretation of soil analytical data
1. Soil horizons | 2 Field texture | 3. Plant available water | 4. pH | 5. Soil salinity | 6. Nutrients needed by plants | 7. Cation exchange capacity (CEC) and Effective cation exchange capacity (ECEC) | 8. Soil constituents | 9. Exchangeable sodium percentage (ESP) | 10. Calcium:magnesium ratio (Ca:Mg) | 11. Trace elements
Much of the information in this section comes from publications ‘A manual on the soil testing service provided by the Division of Agricultural Chemistry’ by A.J. Brown, K.K.H. Fung and K.I. Peverill (1982), ‘The analytical and interpretive service provided by Ag-Plus’ by K.I. Peverill, S.W. Margetts, A.J. Brown, N.B. Grennhill and G.R. Monro (1987) and a manual by P Hazelton and B Murphy (2007) titled ‘Interpreting soil test results: what do all the numbers mean?’ The definitions of soil horizons are from ‘Australian Soil and Land Survey’ (McDonald et al. 1990).
Much of the information in the section on trace elements comes from ‘Trace Elements for Pastures and Animals in Victoria’ prepared by W. J. Hosking, I. W. Caple, C. G. Haplin, A. J. Brown, D. I. Paynter, D. N. Conley and P. L. North-Coombes (1986) published by the Department of Agriculture and Rural Affairs, (available at http://www.dpi.vic.gov.au/dpi/vro/vrosite.nsf/pages/trace_elements_pastures).
Siegfried Engleitner, Future Farming Systems Research, Department of Primary Industries, also assisted in review and provided helpful comment.
1 Soil horizons
A soil profile may be sub-divided into a number of soil horizons, which are layers of soil approximately parallel to the surface. The O and P horizons are dominated by organic material in varying stages of decomposition that have accumulated on the mineral soil surface, whereas the A, B, C , D and R are dominated by soil minerals. Information about the A, B and C horizons is included here.
A Horizons
These are horizons consisting of one or more surface mineral horizons with some organic accumulation and usually darker in colour than the underlying horizons, or consisting of surface and subsurface horizons that are lighter in colour but have a lower content of silicate clay and/or sesquioxides than the underlying horizons.
A1 horizon mineral horizon at or near the soil surface with some accumulation of humified organic matter, usually darker in colour than underlying horizons and with maximum biologic activity for any given soil profile.
A2 horizon mineral horizon having, either alone or in combination, less organic matter, sesquioxides, silicate clay than immediately adjacent horizons. Usually paler in colour than the A1 horizons
A3 horizon transitional horizon between A and B which is dominated by properties characteristic of an overlying A1 or A2.
B Horizons
These horizons consist of one or more mineral soil layers characterised by one or more of the following: a concentration of silicate clay, iron, aluminium, organic material or several of these; a structure and/or consistence unlike that of the A horizons above or of any horizons immediately below; stronger colours, usually expressed as higher chroma and/or redder hue, than those of the A horizons above or those of the horizons below.
B1 horizon transitional horizons between A and B, which is dominated by properties characteristic of underlying B2
B2 horizon horizon in which the dominant feature is one or more of the following:
- an illuvial, residual or other concentration of silicate clay, or iron, aluminium, or humus either alone or in combination;
- maximum development of pedologic organisation (i.e. all changes in soil material resulting from the effect of physical, chemical and biologic processes) as evidenced by a different structure and/or consistence, and/or stronger colours than the A horizons above or any horizon immediately below.
These are layers below the AB profile of consolidated and unconsolidated material, usually partially weathered, little affected by pedogenic (soil forming) processes and either like or unlike the material from which the solum presumably formed. It lacks properties characteristic of all other horizons and is recognized by its lack of pedological development and/or presence of geologic organisation frequently expressed as sedimentary laminae or as ghost rock structure as in saprolite.
D Horizons
These are considered to be any soil material below the soil solum in that it is unlike the solum in its general character and cannot be given reliable horizon designation.
R Horizons
These horizons consist of continuous masses of moderately strong to very strong rock.
2 Field texture
Field texture is determined by measuring the behaviour of a small handful of soil when moistened with water and kneaded (1-2 minutes) until it is quite moist but does not stick to the hand. This ‘ball’ is called a ‘bolus’. It provides an estimate of the relative amounts of coarse sand, fine sand, silt and clay sized particles. Field texture influences many soil physical properties such as water holding capacity and hydraulic conductivity. Numerous soil properties affect the determination of texture such as type of clay minerals, organic matter, carbonates, etc. Texture is determined by the behaviour of the moist bolus and the length of the ribbon when sheared between the thumb and forefinger.
| Field texture symbol | Field texture grade | Behaviour of moist bolus | Approx clay content (%) |
S | Sand | Coherence slight to nil, cannot be moulded: sand grains of medium size, single grains will stick to the fingers. | less than 5% |
LS | Loamy sand | Slight coherence; sand grains of medium size; can be sheared between the thumb and forefinger to give a minimal ribbon of about 5 mm. | approx 5% |
CS | Clayey sand | Sight coherence; sand grains of medium size; sticky when wet; many sand grains will stick to the fingers; will form a minimal ribbon of 5-15 mm; discolours fingers with clay stain. | 5%-10% |
SL | Sandy loam | Bolus coherent but very sandy to touch; will form a ribbon of 15-25 mm; dominant sand grains are of medium size and are readily visible. | 10%-20% |
FSL | Fine sandy loam | Bolus coherent; fine sand can be felt and heard when manipulated; will form a ribbon of 13-25 mm; sand grains are evident under a hand lens. | 10%-20% |
SCL- | Light sandy clay loam | Bolus strongly coherent but sandy to touch; sand grains dominantly medium sized and easily visible; will form a ribbon of 20-25 mm. | 15%-20% |
L | Loam | Bolus coherent and rather spongy; smooth feel when manipulated but with no obvious sandiness or ‘silkiness’; may be somewhat greasy to the touch if much organic matter present; will form a ribbon of about 25 mm. | approx 25% |
Lfsy | Loam, fine sandy | Bolus coherent and slightly spongy; fine sand can be felt and heard when manipulated; will form a ribbon of approx 25 mm. | approx 25% |
ZL | Silty loam | Coherent bolus; very smooth to often silky when manipulated; will form a ribbon of approx 25 mm. | clay approx 25%; more than 25% silt |
SCL | Sandy clay loam | Strongly coherent bolus; sandy to the touch; medium sized grains visible in the finer matrix; will form a ribbon of 25-40 mm | 20%-30% |
CL | Clay loam | Coherent plastic bolus; smooth to manipulate; will form a ribbon of 40-50 mm. | 30%-35% |
CLS | Clay loam, sandy | Coherent plastic bolus; medium sized sand grains in the finer matrix; will form a ribbon of 40-50 mm. | 30%-35% |
ZCL | Silty clay loam | Coherent smooth bolus; plastic and often silky to touch; will form a ribbon of 40-50 mm. | clay 30%-35%; more than 25% silt |
FSCL | Fine sandy clay loam | Coherent bolus; fine sand can be felt and heard when manipulated; will form a ribbon of 38-50 mm. | 30%-35% |
SC | Sandy clay | Plastic bolus; fine to medium sands can be seen, felt or heard in the clayey matrix; will form a ribbon of 50-70 mm. | 35%-40% |
ZC | Silty clay | Plastic bolus; smooth and silky to manipulate; will form a ribbon of 50-70 mm. | clay 35%-40%; more than 25% silt |
LC | Light clay | Plastic bolus; smooth to touch; slight resistance to shearing; will form a ribbon of 50-75 mm. | clay 35%-40%; more than 25% silt |
LMC | Light medium clay | Plastic bolus; smooth to touch; slight to moderate resistance to forming a ribbon; will form a ribbon of 75 mm. | 40%-45% |
MC | Medium clay | Smooth plastic bolus; can be moulded into a rod without fracturing; has a moderate resistance to forming a ribbon; will form a ribbon of 75 mm or more. | 45%-55% |
HC | Heavy clay | Smooth plastic bolus; strong resistance to manipulation and forming a ribbon; will form a ribbon of 75 mm or more. | More than 50% Source: After McDonald et al. (1990) |
| After a soil has been subject to heavy rain for a prolonged period, most of the soil pores are filled with water. This soil is now saturated. Under the action of gravity, a certain amount of water drains into the subsoil (gravitational water). After this water has drained away, generally after two or three days under non-waterlogged or free draining conditions, the remaining water is called water held at field capacity. The plants grow, removing water. After exploiting all the water they can, the plants wilt to the point beyond which they cannot be revived (wilting point). At this stage the soil still holds water but the plant cannot overcome the strong forces of surface tension associated with the water held in the small soil pores and the thin water layer surrounding the clay particles. However the remaining water can be remover by heating the soil to 105 degrees C (oven dry). The plant available water content of a soil is considered to be the difference between the water content of a soil between field capacity and wilting point, and the values of these water contents vary from soil to soil. To determine these values in a soil in the paddock situation would be extremely difficult, so laboratory tests have been devised to simulate these conditions. This method involves sieving the soil to pass a 2 mm sieve and subjecting the wetted soil to a predetermined pressure to simulate free draining soil under gravity (field capacity) and the maximum suction that roots can exert on the soil when they extract water (wilting point). The water content of the soil is then determined by weighing the soil before and after drying at 1050C. Hygroscopic water is the water absorbed from the air and varies according to temperature, humidity and the nature of the soil. These relationships are shown in the following diagram. | 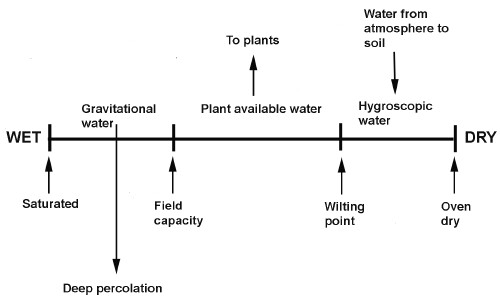 |
| The main problem with the laboratory method is the soil is not intact as the soil aggregates are destroyed in passing through the sieve. Nevertheless these determinations are considered to be a useful guide to how much water can be stored in the various soil horizons. Plant Available Water (PAW) is the amount of soil water that can be extracted by the plant and is influenced by:
| 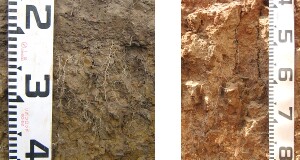 Roots follow the cracks in a soil rather than penetrate the soil peds. (Photos courtesy of Richard MacEwan) |
In this report the PAW is calculated for the pit sites using a model developed by Littleboy (1995). This model uses a computer program to estimate PAW from soil survey data (i.e. % clay, % silt, % fine sand, % coarse sand, % rocks, wilting point and horizon depth). The effective rooting depth has been estimated based largely in soil profile morphology and an assessment of roots in soil pits. Generally, it is assumed effective rooting depth will be restricted by dense and coarsely structured subsoil horizons (particularly if these are sodic and dispersive); hardpans and high levels of soluble salts. Other factors can include extremes of pH and occurrence of frequent waterlogging.
Comparing the values for PAW using the difference between field capacity and wilting point, it is likely the computer program underestimates the plant available water. A possible reason could be the field capacity determination is on a disturbed sample rather than an intact field sample. In addition, the computer model does not take into account the organic matter content of the soil.
Another problem is related to root behaviour in soils. Plant roots need to respire, and research has shown if less than about 10% of the total pore space is occupied by air, the plant root looses function. This is when soils are at the wetter end of the scale. Some plants, such as rice, may be able to cope with lower values of air filled porosity than 10%. At the drier end, if the resistance of the soil is more than about 2.5 MPa, plant roots have a mechanical difficulty in exploring the soil and can only exploit the soil near cracks in the soil. However the soil must still be wetter than wilting point for plant growth.
In summary:
- The roots can’t penetrate if the soil is too hard and therefore can’t get the water out.
- If there is not enough soil air, the roots can’t function properly.
In this report the effective root depth is stated for each soil profile and the following values used for PAW are:
| Interpretation | PAW |
| Extremely low | <25 mm |
| Very low | 25-50 mm |
| Low | 50-75 mm |
| Moderate | 75-125 mm |
| High | >125 mm |
The pH of a soil is a measure of soil acidity and soil alkalinity on a scale of 0 (extremely acidic) to 14 (extremely alkaline), with a pH of 7 being neutral. Soils with pHs (in water) below 4.5 and above 9.5 rarely exist and do not provide a good growth medium. Plant growth is generally favoured by a soil pH between 5.5 and 8.0. With increasing low pHs, particularly below pH 5.5, exchangeable aluminium and sometimes manganese increases to toxic levels and molybdenum becomes increasingly unavailable.
Soil pH is carried out using two methods:
- pH(H2O): the pH of the soil (in water) using a soil:solution ratio of 1:5 (10 grams soil to 50 mL water),
- pH(CaCl2): the pH of the soil (in dilute calcium chloride) using a soil solution ratio of 1:5 (10 grams soil to 50 mL of 0.01M CaCl2)
Some of the effects of increasing pH by liming are to:
- increase microbial activity, hence turnover (mineralisation) of organic matter,
- increase the availability of phosphorus and molybdenum, and
- decrease the availability of manganese and especially, aluminium.
| Descriptive term | pH | Descriptive term | pH |
| Extremely acid | less than 4.5 | Slightly alkaline | 7.1-7.9 |
| Very strongly acid | 4.5-5.0 | Moderately alkaline | 8.0-8.5 |
| Strongly acid | 5.1-5.5 | Strongly alkaline | 8.6-9.0 |
| Moderately acid | 5.6-6.0 | Very strongly alkaline | 9.1-9.5 |
| Slightly acid | 6.1-7.0 | Extremely alkaline | more than 9.5 |
| Neutral | 7.0 |
5 Soil salinity
Soil salinity relates to the presence of water soluble salts in the soil, mainly of sodium, calcium and magnesium, which may be chlorides, sulphates and carbonates. Pure water is a poor conductor of electricity, but as more and more salt is dissolved, the conductivity increases. So measuring the electrical conductivity of the soil in water gives us an indirect measure of the salt content.
Salinity levels are usually determined by measuring the electrical conductivity of soil/water suspensions. Traditionally the electrical conductivity of saturated extracts (ECe) were used but this method is time consuming and difficult. Electrical conductivity is now determined more rapidly and easily on a 1:5 soil/water suspension (EC 1:5) and conversion tables between the soil texture and an appropriate multiplier factor have been derived. The units for electrical conductivity are in decisiemens per metre (dS/m) (Hazelton and Murphy 2007).
Depending on the soil testing laboratory, one of two methods is used to access soil salinity:
- Interpretation of electrical conductivity using the saturation extract (ECe (dS/m))
- Interpretation of electrical conductivity using a 1:5 soil/water suspension (EC 1:5 (dS/m))
Conventionally, saline soils are defined as those having ECe value greater than 4 dS/m. Ranges have been set as per the table below.
| Rating | EC e (dS/m) | Effect on plants |
| Non-saline | <2 | Salinity effects mostly negligible |
| Slightly saline | 2 – 4 | Yields of sensitive crops affected |
| Moderately saline | 4 – 8 | Yields of crops may be affected |
| Highly saline | 8 – 16 | Only salt tolerant crops yield satisfactorily |
| Extremely saline | >16 | Only very salt tolerant crops yield satisfactorily |
There is a lot of information about the interpretation of ECe in regard to plant growth as shown in the above table. To convert the EC(dS/m) 1:5 soil/water electrical conductivity to an approximate value of ECe the following multiplier factors are used.
| Soil Texture | Multiplier factor |
| Loamy sand, clayey sand, sand | 17 |
| Sandy loam, fine sandy loam, light sandy clay loam | 12 |
| Loam, loam fine sandy, silt loam, sandy clay loam | 10 |
| Clay loam, silty clay loam, fine sandy clay loam, sandy clay, light clay | 9 |
| Light medium clay | 8 |
| Medium clay | 7 |
| Heavy clay | 6 |
Thus an electrical conductivity (1:5 soil/water) of (say) 0.35 dS/m of a loamy sand soil would give an ECe of 5.95 dS/m and would be detrimental to sensitive crops, whereas the same electrical conductivity (1:5 soil/water) on a heavy clay soil would not.
Approximate yield reduction for some agricultural crops grown in the area in relation to ECe values
| Plant sensitivity | Agricultural crop | No yield reduction1 | 25% yield reduction2 | 50% yield reduction2 | 75% yield reduction2 |
| Very sensitive | Field and vegetable crops: Beans, Carrots, Celery, Peas, Strawberries | 0 – 1 dS/m | About 3 dS/m | About 4 dS/m | About 6 dS/m |
| Sensitive | Field and vegetable crops: Cabbage, Cauliflower, Lettuce, Maize, Onion, Potato Forage crops: Bent grass, most Clovers Fruit crops: Most (except Figs, Olives) | 1.2 – 1.9 dS/m | About 4 dS/m | About 6 dS/m | About 10 dS/m |
| Moderately tolerant | Vegetable crops: Broccoli, Cantaloupe, Cucumber, Spinach, Tomato, Watermelon Forage crops: Lucerne, Trefoil Fruit crops: Figs, Olives | 2.0 – 3.9 dS/m | About 8 dS/m | About 10 dS/m | About 15 dS/m |
| Tolerant | Field and vegetable crops: Barley, Beets, Safflower, Sorghum, Soybean, Wheat Forage crops: Barley (hay), Perennial ryegrass, Trefoil, Wheat grass | 3.9 – 8 dS/m | About 10 dS/m | About 15 dS/m | About 22 dS/m |
| Halophyte species | Includes Saltbush and Saltmarsh species. Generally unsuitable for crop plants. | Above 8 dS/m |
Sources: 1Hazelton and Murphy (2007), and using generalised data cited in Brady and Weil (19992)
Interpretation of soil salinity using a 1:5 soil/water suspension
Total soluble salts in a soil have been a popular way of expressing soil salinity and is measured by multiplying the electrical conductivity (EC 1:5) of a 1:5 soil/water suspension at 20°C which has been shaken for one hour by 0.33. Although TSS (total soluble salts) is considered an outdated unit you may wish to convert the EC 1:5 (dS/m) figures in this manual to TSS. However there is no exact relationship between electrical conductivity (1:5 soil/water) and total soluble salts as this depends on the different ionic conductivities of the various salts and the influence of the soil particles, but a very approximate value for the percentage total soluble salts is obtained by multiplying the electrical conductivity at 25°C (dS/m) by 0.33.
Soils with EC values less than 0.15 dS/m (TSS approximately 500 ppm or 0.05 %) are regarded as sufficiently low to have harmless salinity.
| EC (1:5 dS/m) | Approx TSS % | Approx. TSS ppm | Interpretation |
| less than 0.15 | less than 0.050 | less than 500 | low and harmless |
| 0.15-0.2 | 0.050-0.067 | 500-670 | slightly higher than normal |
| 0.2-0.5 | 0.067-0.165 | 670-1650 | higher than normal |
| 0.5-0.75 | 0.165-0.248 | 1650-2480 | considerably higher than normal (unfavourable) |
| 0.75-1.00 | 0.248-0.330 | 2480-3300 | high and harmful |
| 1.00-1.50 | 0.330-0.495 | 3300-4950 | very high and harmful |
| more than 1.50 | more than 0.495 | more than 4950 | excessively high |
These are broad interpretations and it should be realised plants vary considerably in their ability to tolerate soluble salts. Salt tolerance within a plant species varies markedly at different stages of growth, with germination and seedling stages generally being less tolerant. As many fertilisers are highly soluble, they also raise the salt content of soil and can lead to salt damage to the roots. This applies particularly to young seedlings of salt sensitive species.
Note this table does not take into account soil texture and applies mainly to medium textured soils such as loams. Given the same EC (dS/m) reading, plants growing on light textured soils are up to three times more as affected by soluble salts as those growing on heavy textured soils.
6 Nutrients needed by plants
| MACRONUTRIENTS | Form taken up by plants | MICRONUTRIENTS | Form taken up by plants |
| Nitrogen (N) 1 | NO3-, NH4+ | Copper (Cu) 2 | Cu++ |
| Phosphorus (P) 1 | H2PO4-, HPO4-- | Molybdenum (Mo) 1 | MoO4-- |
| Potassium (K) 1 | K+ | Zinc (Zn) 2 | Zn++ |
| Calcium (Ca) 1 | Ca++ | Manganese (Mn) | Mn++ |
| Magnesium (Mg) | Mg++ | Iron (Fe) | Fe++ |
| Sulfur (S) 1 | SO4-- | Sodium (Na) | Na+ |
| Carbon (C) | CO2 | Chloride (Cl) | Cl- |
| Hydrogen (H) | H2O | Boron (B) 2 | B4O7-- |
| Oxygen (O) | O2 | Cobalt (Co) 2 | Co++ |
Nutrients needed by animals compared to nutrients needed by plants
Since animals eat plants, it is not surprising that much the same elements are needed by both. Exceptions are: sodium, which is an essential macronutrient for animal health, but not plant health. Similarly, the micronutrients selenium (Se), iodine (I) and fluorine (F) are essential for animal, but not plant health. Conversely, the micronutrient molybdenum (Mo) is essential for plant health (specifically, legumes), but not animal health.
6.1 Nitrogen (N)
Nitrogen (N) is a constituent of all proteins and is found in every living cell. Protein contains 6.25% nitrogen and in plants it is also a key component of chlorophyll. Although the atmosphere contains 79% nitrogen or about 300,000 tonnes above each hectare of land, plants cannot directly access this source and frequently show symptoms of nitrogen deficiency, such as poor growth and yellowing of leaves. The quantities removed by crops vary according to both yield and their protein content. Plants mainly take up nitrogen as nitrate (NO3-), but ammonium (NH4+) can also be taken up.
Nitrogen sources
In nature the ultimate source of nitrogen is lightning in the atmosphere. A small amount of gas is converted to NO3- by electrical discharge and falls with the rain. But most nitrogen in the soil is ‘fixed’ by bacteria. The bacteria may exist freely in the soil (Azobacter) or be associated with leguminous plants such as peas, clover or lucerne (Rhizobium). The process of moving the nitrogen in the air to nitrogen compounds in the soil is called ‘nitrogen fixation’.
Nitrogen is also made available to the plant following the decomposition of dead plants and animals, and the addition of plant wastes such as straw or compost animal wastes such as urine and manure. However if the organic wastes are high in carbon and low in nitrogen (high carbon/nitrogen ratio) soil microbes compete with the plants for nitrogen. Examples of material with a high C:N ratio include straw, sawdusts and some composts.
Fertiliser sources of nitrogen include urea, potassium nitrate, ammonium nitrate, mixed fertilisers, ammonium sulphate, blood and bone and liquid ammonia. In Australia, apart from intensive cropping, relatively little nitrogen fertilisers are used on dryland pasture. Instead, the nitrogen requirement is generally met by the nitrogen fixing bacteria associated with leguminous plants.
Deficiency
Nitrogen deficiency is a potential for all crops excluding legumes, so signs of poor growth and leaf yellowing must be looked for. In pastures, the extreme contrast between growth on urine patches and the surrounding area often indicate nitrogen deficiency. In wheat lands, clover is grown in a rotation between crops and this is used to provide nitrogen for crop growth.
6.2 Carbon (C)
Organic matter is material in a soil which is directly derived from plants and animals, and supports most important microfauna and microflora in the soil. Through its breakdown and interaction with other soil constituents it is largely responsible for much of the physical and chemical fertility of a soil (Charman and Roper, 1991). Organic matter has a high surface area per unit weight compared to most other soil particles and is thus important for the water holding and nutrient retaining properties of the soil.
Organic matter and organic carbon are usually expressed as a percentage of the soil by weight. Care should be taken when presenting and interpreting results as to whether organic matter or organic carbon levels are indicated. In this manual organic carbon levels are used. Organic matter can be calculated from organic carbon. The most commonly used conversion factors vary from 1.72 to 1.9. However, for most practical purposes, simply doubling the organic carbon value provides a reasonable approximation of soil organic matter content.
As the following table shows, typical soil organic carbon levels vary with rainfall as well as intensity of cultivation: the higher the rainfall, the faster the turnover rate (by soil microbes). Cultivating the soil accelerates microbial activity which causes some of the carbon to be lost as carbon dioxide (CO2). One of the main benefits of minimum tillage is it minimises loss of organic carbon as CO2.
Soil organic carbon levels (% )
| Interpretation | Low rainfall | (<500 mm) | High rainfall | (>500 mm) |
| Crops | Pasture | Crops | Pasture | |
| Low | 0.09 | 1.7 | 1.45 | <2.9 |
| Normal | 0.09 – 1.4 | 1.7 – 2.6 | 1.45 – 2.9 | 2.9 – 5.8 |
| High | >1.45 | >2.6 | >2.9 | >5.8 |
6.3 Calcium (Ca)
Calcium is required for cell walls and is necessary for normal cell division and is associated with proteins, nucleic acids and enzymes. As a result, calcium deficiency results in the disintegration of roots and the terminal portion of shoots.
Calcium is also part of the genetic coding material of the nucleus. As calcium is abundant in most soils, deficiency symptoms are rarely seen in the field, although it can be induced through excessive use of nitrogenous fertilisers, particularly in summer (nitrogen-induced tip-burn). High calcium is also beneficial to soil structure, which is why gypsum (calcium sulphate) is applied to (sodic) soil.
| Soil test result | Symptoms |
| Less than 0.5 cmol(+)/kg | Very deficient. Stubby, weakly branched and discoloured roots and fresh shoots dying at the growing point |
| Between 0.5 and 0.7 cmol(+)/kg | As above but less severe |
| Between 0.7 and 1.0 cmol(+)/kg | Symptoms indicate Ca deficiency occurs furthest from the main flow of water |
| Above 1.0 cmol(+)/kg | Above deficiency level |
6.4 Magnesium (Mg)
Magnesium along with nitrogen is found in chlorophyll, the green colouring in plants. Chlorophyll is necessary for the conversion of carbon dioxide in the air to carbohydrates. It also forms soluble organic salts, which help maintain cell rigidity. Although plant deficiencies are rare, sheep and cattle may be unable to get enough magnesium from pasture resulting in an often fatal disorder called ‘grass tetany’ or hypomagnesemia. High potassium in pastures also increases the risk of hypomagnesemia.
Grass tetany has been the main cause of deaths of adult beef cows on farms in south-eastern Australia over the past 40 years (DPI-Vic Agnote AG 0579, June 2007).
It is generally adequate in soils as clays typically contain about 0.05 to 1% magnesium. As these clays weather, the magnesium is released and is held on exchange positions (see section on cation exchange capacity). Plants can normally access this supply of magnesium as its roots extend into the subsoil. Magnesium may be added to the soil as dolomite (CaMgCO3). Some compound fertilisers also contain Mg.
6.5 Potassium (K)
Potassium is an essential constituent of all living cells and is the major nutrient in plants. Potassium plays an important part in many physiological processes in the plant such as respiration, transpiration and the synthesis of carbohydrates and sugars. It is also the major constituent in cell fluid and maintains cell rigidity. Plants take up potassium, as they do all nutrients, from soil solution. Under intensive agriculture (vegetable production and dairying), potassium fertiliser is applied routinely to maintain an adequate supply for plants.
Sources
In general, the clay minerals, mica and illite, contain good reserves of potassium. Some young soils derived from basalt and granite may also contain unweathered potassium, as feldspar.
In high-rainfall regions (more than 700 mm), artificial fertilisers such as potassium chloride (muriate of potash) and potassium sulphate are commonly used to maintain soil reserves, particularly after heavy cropping or fodder removal.
Deficiency
Deficiency symptoms are poor growth, leaf scorch and leaf spotting, particularly in older leaves. Dry vegetative growth contains 1-4% potassium so leafy crops remove quite large amounts.
South of the dividing range, particularly where rainfall is above 700 mm, Victorian soils generally contain low amounts of potassium containing minerals. These soils, when cropped (vegetables or hay cutting) become potassium deficient.
In Northern Victoria, the total potassium content of a soil may be over 1.5% whereas most southern Victorian soils, (Otways and Strzeleckis excluded), total potassium is generally less than 0.5%. However most of this potassium is held rigidly by the clay minerals and is relatively unavailable to growing plants.
Available Potassium
The deficiency levels quoted below for soil samples taken at 0-10 cm are a useful guide for pastures in most circumstances. If exchangeable cation data are given (see Section 1.7), the potassium value (cmol(+)/kg ) may be multiplied by 390 to give the potassium level in the soil in parts per million.
| Interpretation | Sand | Sandy loam | Clay loam | Clay |
| Low | less than 50 | less than 80 | less than 110 | less than 120 |
| Deficiency level | 50-100 | 80-120 | 110-160 | 120-180 |
| Moderate | 100-150 | 120-200 | 160-250 | 180-300 |
| High | greater than 150 | greater than 200 | greater than 250 | greater than 300 |
6.6 Aluminium (Al)
Aluminium (Al) comprises about 8% of the earth’s crust compared with <1% for phosphorus and 4% for calcium. Most of the soil clay minerals contain aluminium, but it is usually not until soil pH(CaCl2) falls below 4.8 [pH(H2O) <5.5] that aluminium is ‘readily measurable’ in the soil solution and on exchange sites, and can become toxic to plant growth. Aluminium affects plant roots by causing lateral and tip root thickening, greatly reducing the development of fine branching roots and root hairs and reducing the or excluding the uptake of other cations. Plants vary in their tolerance to concentrations of aluminium.
7 Cation Exchange Capacity (CEC) and Effective Cation Exchange Capacity (ECEC)
The cation exchange capacity (CEC) is a measure of the soil’s ability to absorb and hold cations (positively charged ions). The four most abundant cations are calcium (Ca2+), magnesium (Mg2+), potassium (K+) and sodium (Na+), and if the soil is acid, hydrogen (H+). The cations manganese (Mn2+), iron (Fe2+), copper (Cu2+) and zinc (Zn2+) are usually present in amounts that do not contribute significantly to the cation compliment. If the soils are strongly acid, the exchangeable aluminium and manganese are added to the cation exchange capacity and this is called ‘Effective Cation Exchange Capacity’ (ECEC). This latter figure is used when calculating the exchangeable sodium percentage of acid soils.
The cations have a positive electrical charge and are held on the negatively charged surfaces of clay minerals and organic matter. These cations can be exchanged for other cations, for example one Ca2+ cation can be exchanged for two Na+ cations, and are therefore said to be ‘exchangeable’ cations. Some clays e.g. montmorillonite, have a greater negative charge than others, e.g. kaolinite, but the types of clay in the soils described in this manual have not been determined. Little can be done to improve the soil clay content. However organic matter has a high ability to hold cations and additions of manure, crop waste and other organic materials will improve the cation exchange capacity, albeit temporarily.
A high cation exchange capacity means a soil has good nutrient cation retention. Soils high in clay and organic matter have a high cation exchange capacity and can retain fertiliser cations. In contrast, sandy soils, which are low in clay and/or organic matter, have a low cation exchange capacity so fertiliser is more easily leached.
The cation exchange capacity of a soil is a major controlling agent of stability of soil structure, nutrient availability for plant growth, soil pH and the soil’s responsiveness to fertilisers and other ameliorants (e.g. lime, gypsum and dolomite).
Anions are also present in a soil, being held on positively charged surfaces of oxides and iron and aluminium. An example of an anion is H2PO4-, which denotes the usual form of phosphorus in a soil when superphosphate is added.
Nutrient status
The exchangeable cation capacity may be used as a guide to the nutrient status of the soil. This is calculated as the sum of exchangeable calcium, magnesium and potassium (in cmol(+)/kg) and can be used as a rough guide to availability of nutrients in general. The categories used are given in the table below.
| Potential fertility rating | Total (cmol(+)/kg) |
| Very low | 0 – 3.9 |
| Low | 4 – 7.9 |
| Moderate | 8 – 17.9 |
| High | More than 18 |
8 Soil constituents
This table sets out the components of soil, their surface area per gram and their negative charge, i.e. ability to hold cations, e.g. calcium (Ca), magnesium (Mg), potassium (K) and sodium (Na)
| Component | Size (mm) | Surface area (m2 /g) | Cation exchange capacity (cmol (+)/kg) |
| Gravel | more than 2.0 | nil | |
| Coarse sand | 2.0 - 0.2 | 0.01 | nil |
| Fine sand | 0.2 - 0.02 | 0.1 | nil to very slight if mica present |
| Silt | 0.02 - 0.002 | 1.0 | nil to very slight if mica present |
| Clay | less than 0.002 * | 5 - 750 * | varies according to clay type - kaolinite (a non-swelling clay): about 8 illite: about 30 montmorillonite (a swelling clay): about 100 vermiculite: about 150 |
| Iron, aluminium and manganese oxides and hydroxides | 100 - 200 | varies according to pH about +5 at low pH (i.e. anion adsorbing) to about -5 at pH 7 (i.e. cation adsorbing) | |
| Other oxides (very little) (titanium and zircon) | |||
| Water * | |||
| Air* | |||
| Dissolved salts | |||
| Undissolved salts | |||
| Colloidal organic matter | very high surface area | varies according to organic matter type and pH, up to 300 (i.e. strongly cation adsorbing) |
* Soil air and soil water combined make up about 40 - 50% of the volume of surface soil. Even apparently dense clay subsoil will contain about 35 - 40% pore space which is occupied by either soil air or soil water.
Source: I. J. Sargeant, unpublished lecture notes, Monash University.
9 Exchangeable Sodium Percentage (ESP)
This is calculated as the proportion of the cation exchange capacity occupied by sodium ions and is expressed as a percentage.
| Interpretation | ESP |
| Non-sodic | <6% |
| Sodic | 6-15% |
| Strongly sodic | >15% |
These sodium dominated (strongly sodic) clays have a tendency to swell on wetting. They are also likely to be dispersive which means the soils are structurally unstable and disperse in water into their basic particles i.e. sand, silt and clay. The fine clay particles that have dispersed clog up the small pores in the soil, degrading soil structure and restricting root growth and water movement.
10 Calcium: Magnesium Ratio (Ca:Mg)
Ca:Mg ratios were thought to be important for optimal plant growth but it is now known this ratio is not as important as first claimed, with research results showing a variation between 1 and 20 in Ca:Mg ratios of little consequence in agricultural production. However a low Ca:Mg ratio in association with high levels of exchangeable sodium may enhance soil dispersion. (NSW Agriculture, Leaflet No 7).
Soils with a Ca:Mg ratio of less than 0.1 are classified in the Australian Soil Classification as being magnesic.
11 Trace elements
The relationship between chemical tests for trace elements and plant response is generally poor. Nevertheless many soil testing laboratories do tests for trace elements and make fertiliser recommendations on the basis of these tests. The usual method of determining whether a micronutrient is deficient is to undertake plant tissue analyses. The selection of plant parts to be analysed and the stage of growth is critical to correct interpretation of the results.
11.1 Copper (Cu)
Cu is a component of many enzymes that are involved in complex reactions in plants. Cu deficiency is more likely in high rainfall areas, particularly on both calcareous and acid sands and gravels, although it can occur in heavier clay loams. Copper deficiency has been reported in the sandy soils of the ‘Red Gum Plains’ in Gippsland.
In animals, copper is required for body, bone and wool growth, pigmentation, myelination of nerve fibres and blood cells.
As far as animal health is concerned, there is a well known interaction between the levels of Mo and Cu in the pasture with high levels of Mo requiring supplementary Cu.
Only about 2 kg of copper as copper sulphate per ha every 5 - 7 years is required to overcome the deficiency.
Warning: Do not apply copper if the weeds Paterson’s Curse or Heliotrope are present. |
11.2 Zinc (Zn)
Zn is required for the production of the plant hormone auxin, which promotes stem elongation and leaf expansion. Cu and Zn deficiency in soils often go hand in hand, and can be overcome using 2 kg of zinc sulphate every 7 or so years. Zinc deficiency does not appear to be a major problem in East Gippsland, and there have been some negative growth responses in pasture experiments. Therefore, this trace element should only be applied if plant tissue analysis has indicated a deficiency.
11.3 Molybdenum (Mo)
Mo is required by plants to convert nitrates to proteins. As well the fixation of atmospheric nitrogen by Rhizobium bacteria in legumes (e.g. clover , lucerne) depends on the presence of Mo. Mo deficiency often occurs in the sandy soils around Bairnsdale, particularly those on the ‘Red Gum Plains’. To overcome the deficiency, sodium molybdate is generally applied with the superphosphate. Liming acidic soils generally increases the availability of Mo and growth responses attributed to liming are often due to increases in Mo availability.
Molybdenum availability in soils is related to the soil’s acidity, the stronger the acidity the lower the availability.
In sheep and cattle Mo combines with sulphur in the rumen to form compounds which reduce the availability of copper. Thus where copper deficiency has occurred in livestock, or could be induced by molybdenum fertilisers, it may be advisable to include some copper with the application of molybdenum.
Molybdenum should be applied with fertiliser on responsive soils (where soil pH is less than 5.7) every 5-6 years at the rate of 50-60 g/ha. Copper is normally applied at the same time, at the rate of 1-2 kg/ha since molybdenum can interfere with copper metabolism in stock.
Warning: Excessive molybdenum can be harmful to stock. Do not apply fertiliser containing molybdenum on more than 25% of farm annually. Do not graze for four weeks after application. |
Warning: Do not apply copper if the weeds Paterson’s Curse or Heliotrope are present. |
11.4 Manganese (Mn)
The role of Mn is poorly understood but it appears to have a major role in photosynthesis and respiration. It is also essential for nitrogen transformations in both microorganisms and plants.
The chemistry of manganese in the soil is exceedingly complex. The manganese supply for plant growth is normally adequate on acid soils. Thus in south eastern Australia manganese deficiencies are rare and have generally only appeared where naturally acidic soils have been made alkaline by liming. Manganese toxicity is more common, and has been recorded in north-eastern Victoria and in stock grazing on lupins. Manganese toxicity has not been recorded as a problem in Gippsland.
11.5 Iron (Fe)
Fe is also a constituent of chlorophyll and when plants are deficient the leaves become much paler than usual. Although Fe is abundant in most soils, the presence of free lime in a soil may restrict its uptake, and a plant disorder called lime induced chlorosis results. Iron chelates can be applied to the soil to overcome the deficiency. Foliar sprays are particularly effective. There is no evidence that Fe deficiency occurs in pastures or in livestock in Victoria.
11.6 Boron (B)
Boron is one of the most commonly deficient of all the micronutrients. Its availability is greatly influenced by soil pH and is most available in acid soils. At higher pH values, boron is less easily utilised by plants and over liming can result in a boron deficiency. This element plays an important role in the uptake and use of calcium within the plant and death of the growing points of the plant occurs as a result of its deficiency. Boron is also important in protein synthesis and associated nitrogen metabolism.
Carbohydrate metabolism is also concerned with this element. Boron deficiency has been recognised all over the world. Seawater contains a relatively high concentration of boron and soils derived from the marine sediments, unless subjected to prolonged and extensive leaching, commonly contain a good reserve of the element. In Victoria often the problem is not a boron deficiency but excess. Although boron plays a vital role in plant nutrition, the range between deficient and toxic levels is so small that great care must be taken with any recommendations for treatment of boron deficiency.
Acidic sandy surface soils cover most of the Red Gum Plains and boron levels were probably initially low in these soils. Unfortunately it is easily leached from acid sandy soils and boron deficiency can be a matter of a low supply rather than low availability. As the soils were initially acidic the boron levels were generally adequate and of the ten field trials conducted in East Gippsland before the early 1980s, only one showed deficiency symptoms. Since then, the liming of soils has been a common practice and this, together with the naturally low boron levels in the soil could have lead to deficiency symptoms. As for other trace elements, the application of boron fertiliser should be guided by plant tissue analyses.
11.7 Cobalt (Co)
Co is required by the Rhizobium bacteria found in the nodules on the roots of legumes where it is required for vitamin B12. When Co is insufficient legumes show the typical symptoms of N deficiency, including yellowing of leaves and poor growth.
Sheep and cattle can synthesise this vitamin from dietary Co and in Co deficient areas they may suffer from a disorder called ‘wasting disease’, even though the pasture is growing vigorously. Wool production is also seriously affected. Cobalt deficiency has been reported on the soils of the ‘Red Gum Plains’ but rather than adding Co fertilisers, it is best supplied orally in pellet form or as drenches or licks.
11.8 Sodium and chlorine (Na and Cl)
Sodium chloride is common salt. In Australia deficiencies of Na and Cl are unknown as far as the plant is concerned. However, plants can take up both Na and Cl in quite large quantities and the Na concentration in pasture is frequently over 0.5 percent. Some species take up little Na and when this occurs, or when the soil itself is low in Na, grazing animals may show a craving for salt, particularly after giving birth or when lactating.
11.9 Selenium and Iodine (Se and I)
Selenium deficiency has been reported in the sandy soils of East Gippsland as well as rare instances of iodine deficiency. These elements are not needed by plants, and are best supplied as animal supplements. However, selenium may be incorporated into fertiliser and applied as a broadcast application. In some cases, this is a more practical alternative to animal supplements.
Warning: Selenium toxicity can be induced in stock through excessive application of Se in fertiliser. It should only be applied to pasture where there is a demonstrated history of Se deficiency in stock. |
Top
Acknowledgements/thanks
The Department of Primary Industries would like to acknowledge the significant contribution of Ian Sargeant (Soil Consultant) in undertaking the interpretative analysis required to develop the soil landform maps within this manual.
The following people also contributed:
Project Management: Wayne Burton1, Heather Adams1
Field Survey: Ian Sargeant2, David Rees1
Soil Pit Descriptions: Ian Sargeant, David Rees
Text: Ian Sargeant
Map Products: Brett Mitchard1
Photographs: Ian Sargeant
Glossary of Terms: Mark Imhof1
Editing Advice: Trish Lothian1
Booklet formatting: Griffin Graphics
1 Department of Primary Industries
2 Ian Sargeant, Soil Consultant, 5 Railway Parade North, Glen Waverley
Top
References
Aldrick J. M., Hook R. A., van de Graaff R. H. M., Nicholson B. M., O’Beirne D. A. and Schoknecht N. R., 1992. A Study of the Land in the Catchment of the Gippsland Lakes. Department of Conservation, Forests and Lands, Victoria, Australia. Technical Communication No 17.
Baker, D.E., and Eldershaw, V.J., 1993. Interpreting soil analyses - for agricultural land use in Queensland. Dept. of Primary Industries, Project Report Series QO93014, Australia.
Boucher, S.C. 2006. Gully erosion. Victorian Resources Online article, available at www.nre.vic.gov.au/DPI/Vro/vrosite.nsf/pages/lwm_land_deg_gully_new
Brown A. J., Fung K.K.H. and Peverill K.I., 1982. A manual on the soil testing service provided by the Division of Agricultural Chemistry
Charman, P.E.V., and Murphy B.W., 1991. Soils Their Properties and Management. Sydney University Press and Oxford University Press, Melbourne, Australia.
Commonwealth of Australia . 2001 Australian Agriculture Assessment. Published by: National Land and Water Resources Audit .
Department of Primary Industries. 2004. Surface soil pH.
Obtainable at www.dpi.vic.gov.au/dpi/vro/vrosite.nsf/pages/surface-soil-pH
Department of Primary Industries, 2005. Sustainable Soil Management. A reference manual to the major agricultural soils of the Bairnsdale and Dargo Region. State of Victoria. Also available online at www.dpi.vic.gov.au/dpi/vro
Glendinning, J.S. 1986 Fertiliser Handbook, Australian Fertilisers Limited.
Hazelton, P. and Murphy, B., 2007. Interpreting soil test results: What do all the numbers mean? CSIRO Publishing. Melbourne.
Hollier, C., 2003. Small farm: what is a healthy soil? Agriculture Note. Available from www.dpi.vic.gov.au
Isbell R.F., 1996. The Australian Soil Classification. CSIRO Publishing, Melbourne.
Land Conservation Council, 1977 Report on the Alpine Study Area. Land Conservation Council, Melbourne.
Landcare Victoria 1992 Victoria’s Decade of Landcare Plan. Landcare Victoria.
Lines-Kelly, R. ,1994. Soil Sense Soil Management for NSW North Coast Farmers. NSW Agriculture, Wollongbar, NSW, Australia.
Littleboy, M., 1995. Computer Programs to Estimate Plant Available Water Capacity from Soil Survey Data. Resource Management Institute, Queensland Department of Primary Industries.
Lorimer, M.S. and Rowan, J.N. TC. 15. Soil Conservation Authority, Vic., Australia. 1982. Study of the Land in the Catchment of the Avoca River.
McDonald R.C., Isbell R.F., Speight J.G., Walker J. and Hopkins M.S., 1990. Handbook of Australian Soils – Field Handbook. 2nd Ed., Inkata Press, Melbourne.
Munsell Color Company .1975. Munsell Soil Color Charts. Macbeth - Division of Kollmorgen Instruments Corp. Distributed by: Frank McCarthy Color P/L, 38 Marshall Ave. Kew. Vic. Australia.
Natural Resources and Environment (Dept of). 2002. Drought Preparation and Survival Guides. DNRE, Victoria.
NSW Agriculture and Fisheries, 1989. Soil Testing Methods and Interpretation. Biological and Chemical Research Institute, NSW Agriculture and Fisheries, Rydalmere.
NSW Agriculture, Leaflet No. 7. 2002. Interpreting soil test for calcium, magnesium and Ca:Mg ratios.
Northcote, K.H. and Skene J.K.M., 1972. Australian soils with saline and sodic properties. CSIRO Soil Publication 27.
Orth K., VandenBerg A.H.M., Nott R.J. and Simons B.A.1995. Murrindal 1: 100,000 map geological report. Geological Survey of Victoria Report 100.
Peverill, K. I, Margetts,S. W., Brown, A. J., Greenhill, N. B., and Munro, G. R., 1987. The analytical and interpretive service provided by Ag-Plus.
Sargeant, I. J. and Sargant, J., 2005 Sustainable Soil Management – a reference manual to the major agricultural soils of the Bairnsdale and Dargo regions. Department of Primary Industries, Bairnsdale, Victoria.
Slattery, B., 2002. The impact of acid soils in Victoria. State of Victoria. Department of Natural Resources and Environment. (available at www.dpi.vic.gov.au)
Soil Erosion Committee. 1938. Erosion in Victoria. Department of Lands and Survey, Melbourne. Online report available at www.dpi.vic.gov.au
Willman, C.E., Morand, V.J., Hendrick, M.A., VandenBerg, A.H.M., Haydon, S.J., Carney, C., 1999. Omeo 1:100 000 map area geological report. Geological Survey of Victoria Report 118.
Webb, J.A, Finlayson, B.L., Farel, D. and Ellawat, M, 1991. The geomorphology of the Buchan Karst – implications for the landscape history of the Southeastern Highlands of Australia. Cited in ‘Geology of Victoria’ Edited by W. D. Birch. Geological Society of Australia. Special Publication 23. (Page 541)
© State of Victoria (Agriculture Victoria) 1996 - .

This work, Victorian Resources Online, is licensed under a Creative Commons Attribution 4.0 licence. You are free to re-use the work under that licence, on the condition that you credit the State of Victoria (Agriculture Victoria) as author, indicate if changes were made and comply with the other licence terms.
The licence does not apply to ‘branding’ or some ‘images or photographs’ that may be owned by third parties. We ask you to seek prior approval to use images using the VRO feedback form. Access to higher quality images can also be provided on request.
This page was last updated on .