
Tinamba (Ti)
|
|  |
Late Pleistocene alluvial sediments.
Landform
Stagnant alluvial plain. This is defined as an alluvial plain where erosion and aggradation, by channelled and overbank stream flow, is barely active or inactive due to reduced water supply.
Prior to the incision of the modern stream system, earlier stream systems (referred to as prior streams) deposited alluvium that now makes up the Tinamba, Denison and Montgomery map units. The brown and red soils of the Tinamba map unit occur on the levees and what was then the near flood plains associated with the prior stream channels. Both the Montgomery map unit and the Denison map unit occur on the far flood plain of the earlier stream system and both are greyer and more clayey soils.
Photo | Panoroma | Information | Soil pit | Video |
NOTE: Use the '?' icon, inside the panorama, for help with navigation controls. To zoom in use the mouse's 'scroll wheel' (if you have one) or the + and - keys. To explore the landscape, click and hold the left mouse button on the landscape and move the mouse left, right, up or down or use cursor keys.
The interactive landscapes is 28 MB in size, this might take some time to automatically download if you're using a slow internet connection.
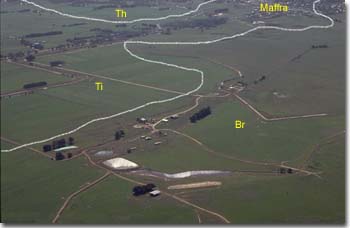
This photo is looking NW towards Maffra and shows the Maffra-Sale road in the background. The Tinamba (Ti) and adjacent Briagolong (Br) units are marked.
Original Vegetation
It is likely that this map unit was predominantly grassland (Lunt, 1997) with only about 5% of the area timbered.
Previous Maps and Reports
Skene and Walbran (1948, 1949) mapped much of the area that is now irrigated, in considerable detail. In the Nambrok district, the Tinamba map unit mainly comprises Heyfield clay loam (a brown to red soil) and Acre clay loam (duller brown to brown in color).
Immediately north and east of Sale the soils have not been previously mapped in detail and have been included here in the Tinamba map unit.
Ward (1977) mapped this map unit into his Bundalaguah soil association.
This map unit is included within the Sale and Nambrok and Freestone Land Systems as described by Aldrick et al. (1992).
Soils
Most, but not all, of the soils have a texture contrast between the surface soil and the subsoil. The majority have a dominantly brown fine sandy loam to fine sandy clay loam surface soil. Usually a sharp to clear change occurs at about 35 to 45 cm to dominantly red or brown light to medium clays becoming fine sandy clays to light clays before 1 m. Small nodules of lime frequently occur in the deep subsoil. The soils are generally classified as Red or Brown Chromosols or Sodosols using the Australian Soil Classification. Some soils lack strong texture contrast between the surface and subsoil – and are generally Red Dermosols.
Although they are similar, the soils of the Tinamba map unit have consistently lower fine sand contents than those of the Clydebank map unit.
Small areas of Nuntin sandy loam may occur as low dunes east of the Thomson and Macalister Rivers, for example west of the Sale Racecourse and north of Maffra. In the lower parts of the landscape, minor areas of Denison clay loam may also be present.
Section of the original map by Skene and Walbran (1948) showing detailed soil mapping south of the
Thomson River near Denison. Note: the complex soil pattern associated with the prior streams.
Chemical and Physical Analysis
Analytical data has been provided for six soil pit sites GP29, GP30, GP36, GP68, GP69, GP74 which are located on this map unit. Five sites have been examined by Skene and Walbran (1998) and one by Aldrick et al. (1992). The chemical data from these soil pits show that the surface soils are generally below pH 6.0 and often below pH 5.5. The subsoils are generally near neutral and the deep subsoils are slightly to moderately alkaline. The calcium to magnesium ratios in the deep subsoil ranged between 0.3 to 1.3. About half of the soils examined were sodic in the subsoil.
GP29. Soil Pit Site (Sargeant and Imhof, 2000)
Depth cm | Texture | pH | EC dS/m | Cl % | Nitrogen % | Carbon % | Ca meq% | Mg meq% | K meq% | Na meq% | H meq% | ESP % | Coarse sand % | Fine sand % | Silt % | Clay % | LAT % |
0-15 | FSL | 5.6 | 0.13 | 0.05 | 0.99 | 1.6 | 1.3 | 0.3 | 0.3 | 6.3 | 10 | 2 | 57 | 26 | 14 | 1 | |
15-45 | LC | 8.8 | 0.42 | 0.03 | 3.4 | 6.3 | 0.2 | 2.6 | 21 | <1 | 32 | 29 | 38 | 1 | |||
45-80 | FSLC | 8.9 | 0.52 | 0.07 | 2.5 | 5.0 | 0.2 | 2.6 | 26 | <1 | 36 | 24 | 31 | <1 | |||
80-110 | FSLC | 8.9 | 0.65 | 0.09 | 2.2 | 5.0 | 0.2 | 2.8 | 28 | <1 | 31 | 41 | 30 | <1 | |||
110+ | FSLC | 9.0 | 0.56 | 0.07 | 2.0 | 4.9 | 0.2 | 2.9 | 29 | 1 | 24 | 45 | 32 | <1 |
GP30. Soil Pit Site (Sargeant and Imhof, 2000)
Depth cm | Texture | pH | EC dS/m | Nitrogen % | Carbon % | Ca meq% | Mg meq% | K meq% | Na meq% | H meq% | ESP % | Coarse sand % | Fine sand % | Silt % | Clay % | LAT % |
0-40 | FSCL | 5.2 | <0.05 | 0.09 | 1.1 | 1.6 | 0.4 | 0.4 | 0.1 | 5.7 | 6 | 2 | 55 | 28 | 13 | 1 |
40-60 | FSL | 6.0 | <0.05 | 1.2 | 0.5 | 0.1 | 0.1 | 5 | 2 | 56 | 32 | 13 | <1 | |||
60-100 | LMC | 6.5 | <0.05 | 3.6 | 6.2 | 0.4 | 0.5 | 5 | 1 | 27 | 23 | 49 | 1 | |||
100+ | LMC | 7.7 | <0.05 | 2.6 | 6.1 | 0.2 | 0.5 | 6 | 3 | 41 | 20 | 36 | <1 |
GP36. Soil Pit Site (Sargeant and Imhof, 2000)
Depth cm | Texture | pH | EC dS/m | Carbon % | Ca meq% | Mg meq% | K meq% | Na meq% | ESP % | Coarse sand % | Fine sand % | Silt % | Clay % |
0-5 | ZCL | 6.5 | 0.13 | 3.6 | 7.9 | 3.3 | 0.2 | 1.2 | 10 | 7 | 21 | 39 | 27 |
2-20 | ZCL | 6.9 | 0.08 | 4.8 | 1.8 | 0.2 | 0.9 | 12 | 1 | 26 | 44 | 28 | |
20-30 | ZCL | 7.6 | 0.07 | 2.7 | 0.8 | 0.4 | 0.9 | 19 | 1 | 26 | 43 | 29 | |
30-50 | ZLC | 7.7 | 0.07 | 2.1 | 0.9 | 0.1 | 1.2 | 28 | 1 | 24 | 43 | 32 | |
50-90 | MC | 7.8 | 0.08 | 2.7 | 4.2 | 0.2 | 2.3 | 25 | 1 | 14 | 49 | 55 | |
90+ | LMC | 8.0 | 0.11 | 2.6 | 4.7 | 0.2 | 2.2 | 23 | <1 | 13 | 35 | 51 |
GP68. Soil Pit Site (Sargeant and Imhof, 2000)
Depth cm | Texture | pH | EC dS/m | Nitrogen % | Carbon % | Ca meq% | Mg meq% | K meq% | Na meq% | ESP % | Coarse sand % | Fine sand % | Silt % | Clay % | LAT % |
0-10 | FSCL | 5.8 | 0.47 | 0.57 | 5.4 | 13.0 | 4.2 | 2.0 | 0.2 | 9 | 24 | 27 | 26 | 3 | |
10-30 | FSCL | 6.4 | 0.11 | 6.1 | 3.0 | 1.4 | 0.2 | 5 | 27 | 37 | 27 | 2 | |||
30-45 | FSCL | 7.7 | 0.09 | 4.3 | 3.7 | 1.2 | 0.4 | 4 | 3 | 28 | 39 | 29 | 1 | ||
45-80 | MC | 8.1 | 0.25 | 4.7 | 7.5 | 1.8 | 0.5 | 4 | 2 | 20 | 28 | 49 | 1 | ||
80-100 | LMC | 9.0 | 0.54 | 2.5 | 8.0 | 0.9 | 2.3 | 17 | 1 | 11 | 44 | 43 | 1 | ||
100+ | LMC | 9.1 | 0.60 |
GP69. Soil Pit Site (Sargeant and Imhof, 2000)
Depth cm | Texture | pH | EC dS/m | Nitrogen % | Carbon % | Ca meq% | Mg meq% | K meq% | Na meq% | ESP % | Coarse sand % | Fine sand % | Silt % | Clay % | LAT % |
0-10 | SL | 7.1 | 0.23 | 0.26 | 3.1 | 5.6 | 3.4 | 0.9 | 0.7 | 29 | 37 | 14 | 14 | 2 | |
10-45 | SL | 6.2 | 0.18 | 1.2 | 0.7 | 1.1 | 0.8 | 31 | 43 | 12 | 13 | <1 | |||
45-60 | SL | 5.8 | 0.12 | 0.7 | 0.5 | 0.8 | 0.5 | 30 | 45 | 11 | 14 | <1 | |||
60-100 | LC | 6.7 | 0.22 | 3.5 | 3.0 | 1.5 | 1.0 | 12 | 3 | 38 | 24 | 35 | <1 | ||
100-130 | LC | 7.8 | 0.22 | ||||||||||||
130+ | ZLC | 8.0 | 0.33 |
GP74. Soil Pit Site (Sargeant and Imhof, 2000)
Depth cm | Texture | pH | EC dS/m | Nitrogen % | Carbon % | Ca meq% | Mg meq% | K meq% | Na meq% | H meq% | ESP % | Coarse sand % | Fine sand % | Silt % | Clay % | LAT % |
0-7 | ||||||||||||||||
7-30 | FSCL | 4.8 | 0.82 | 0.36 | 4.2 | 6.4 | 2.3 | 2.3 | 0.2 | 27 | 25 | 20 | 21 | 2 | ||
30-50 | FSCL | 5.7 | 0.27 | 4.8 | 2.0 | 1.9 | 0.1 | 6.0 | 2 | 27 | 22 | 15 | 35 | 1 | ||
50-100 | LMC | 6.1 | 0.22 | 2.9 | 2.3 | 2.5 | 0.4 | 4.3 | 5 | 24 | 16 | 21 | 40 | 1 | ||
100-140 | SC | 7.4 | 0.28 | |||||||||||||
140+ | SC |
Heyfield clay loam, (Skene and Walbran, 1948)
Depth cm | Texture | pH | EC dS/m | Cl % | Nitrogen % | Carbon % | Ca meq% | Mg meq% | K meq% | Na meq% | H meq% | ESP % | Coarse sand % | Fine sand % | Silt % | Clay % |
0-10 | CL | 5.9 | 0.09 | .007 | .208 | 2.47 | 3.3 | 1.1 | 0.7 | 0.3 | 7.9 | 2 | 2 | 33 | 35 | 25 |
10-20 | CL | 6.4 | 0.10 | .009 | 2 | 35 | 35 | 27 | ||||||||
20-36 | CL | 6.6 | 0.04 | .001 | 1 | 34 | 32 | 30 | ||||||||
36-56 | LC | 6.6 | 0.05 | .003 | 2.1 | 3.0 | 0.3 | 0.3 | 3.9 | 3 | 1 | 31 | 28 | 36 | ||
56-81 | MC | 6.7 | 0.08 | .007 | 2 | 25 | 21 | 46 | ||||||||
81-102 | LC | 6.7 | 0.13 | .016 | 2.8 | 5.0 | 0.5 | 0.7 | 3.6 | 6 | 2 | 30 | 20 | 40 | ||
102-137 | LC | 7.3 | 0.18 | .025 | 6 | 35 | 20 | 30 | ||||||||
127-191 | LC | 8.3 | 0.27 | .038 | 1 | 18 | 39 | 37 |
Acre clay loam, (Skene and Walbran, 1948)
Depth cm | Texture | pH | EC dS/m | Cl % | Nitrogen % | Carbon % | Coarse sand % | Fine sand % | Silt % | Clay % | LAT % |
0-8 | L | 5.5 | 0.12 | .010 | 0.242 | 3.35 | 4 | 36 | 35 | 15 | 1 |
8-18 | L | 6.3 | 0.06 | .004 | 5 | 41 | 37 | 13 | <1 | ||
18-25 | LC | 7.1 | 0.13 | .012 | 4 | 23 | 28 | 41 | 1 | ||
25-51 | HC | 7.4 | 0.33 | .044 | 2 | 7 | 26 | 63 | 1 | ||
51-84 | MC | 8.0 | 0.53 | .080 | 1 | 10 | 27 | 58 | 1 | ||
84-132 | LC | 8.6 | 0.49 | .076 | <1 | 26 | 33 | 38 | 1 | ||
132-208 | FSC | 8.7 | 0.46 | .072 | 1 | 40 | 27 | 27 | 1 | ||
208-269 | FSC | 8.9 | 0.32 | .054 | <1 | 45 | 28 | 22 | 1 |
Acre clay loam, (Skene and Walbran, 1948)
Depth cm | Texture | pH | EC dS/m | Cl % | Nitrogen % | Carbon % | Coarse sand % | Fine sand % | Silt % | Clay % | LAT % |
0-15 | CL | 5.7 | 0.14 | .013 | 4 | 33 | 32 | 25 | 1 | ||
15-38 | CL | 6.2 | 0.12 | .015 | 0.103 | 1.23 | 3 | 33 | 34 | 26 | 1 |
38-64 | MC | 8.0 | 0.36 | .049 | 1 | 17 | 20 | 55 | 3 | ||
64-86 | LMC | 9.3 | 0.73 | .094 | 1 | 26 | 23 | 44 | 4 | ||
86-114 | FSC | 9.0 | 0.77 | .119 | 1 | 42 | 23 | 32 | 1 | ||
114-198 | FSCL | 9.0 | 0.74 | .101 | 2 | 57 | 20 | 19 | 1 |
Acre clay loam, (Skene and Walbran, 1948)
Depth cm | Texture | pH | EC dS/m | Cl % | Nitrogen % | Carbon % | Coarse sand % | Fine sand % | Silt % | Clay % | LAT % |
0-20 | CL | 5.4 | 0.09 | .010 | .113 | 1.26 | 1 | 43 | 33 | 20 | 1 |
20-33 | CL | 5.9 | 0.07 | .005 | 2 | 41 | 32 | 24 | 1 | ||
36-81 | MC | 5.9 | 0.34 | .058 | 1 | 23 | 22 | 52 | 1 | ||
81-102 | MC | 6.9 | 0.45 | .069 | 1 | 28 | 25 | 45 | 1 | ||
102-122 | LC | 7.2 | 1.07 | .191 | <1 | 36 | 23 | 38 | 2 |
Acre clay loam, (Skene and Walbran, 1948)
Depth cm | Texture | pH | EC dS/m | Cl % | Nitrogen % | Carbon % | Coarse sand % | Fine sand % | Silt % | Clay % | LAT % |
0-20 | CL | 5.7 | 0.10 | .008 | 0.237 | 3.50 | 1 | 23 | 35 | 33 | 1 |
20-30 | 5.8 | 0.07 | .003 | 1 | 23 | 36 | 38 | 1 | |||
LC | LC | 5.9 | 0.08 | .008 | <1 | 21 | 33 | 41 | 2 | ||
38-81 | MC | 6.3 | 0.21 | .028 | <1 | 11 | 25 | 58 | 2 | ||
81-117 | LC | 7.4 | 0.23 | .018 | <1 | 22 | 32 | 42 | 1 | ||
117-183 | LC | 8.3 | 0.23 | .008 | <1 | 21 | 38 | 38 | 1 |
Profile 42, Maffra 1,4, (Aldrick et al., 1992)
Depth cm | Texture | pH | EC dS/m | Cl % | Nitrogen % | Carbon % | Ca meq% | Mg meq% | K meq% | Na meq% | H meq% | ESP % | Gravel % | Coarse sand % | Fine sand % | Silt % | Clay % |
0-5 | L | 5.6 | 0.05 | .001 | 0.17 | 1.9 | 2.2 | 1.3 | 0.6 | 0.1 | 7.8 | <1 | 13 | 8 | 41 | 28 | 18 |
20-30 | CL | 5.9 | 0.02 | .001 | 0.046 | 0.31 | 1.3 | 1.0 | 0.2 | 0.1 | 3.4 | 2 | 3 | 8 | 46 | 28 | 17 |
40-60 | MC | 6.1 | 0.07 | .001 | 3.5 | 5.7 | 0.2 | 1.0 | 9.2 | 5 | 5 | 2 | 24 | 17 | 54 |
The following abbreviations are used to describe field texture: S - sand; LS - loamy sand; ClS - clayey sand; SL - sandy loam; L - loam; CL - clay loam; SCL - sandy clay loam; SC - sandy clay; FSCL - fine sandy clay loam; FSC - fine sandy clay; LC - light clay; MC - medium clay; HC - heavy clay; GR - gravel; ZL - silty loam; ZCL - silty clay loam; ZLC - silty light clay; ZMC - silty medium clay.
Particle size distribution data given for Skene and Walbran (1948, 1949) does not include the water content of the soil. As a result the coarse sand, fine sand, silt, clay and loss on acid treatment (LAT) may not add up to 100%. Aldrick et al. (1992) does not provide LAT data.
Other symbols include: pH - analysed in water; EC - electrical conductivity; Cl - chloride; Ca - exchangeable calcium; Mg - exchangeable magnesium, K - exchangeable potassium; Na - exchangeable sodium; H - exchangeable hydrogen; ESP - exchangeable sodium percentage.
For Soil Pit Sites (Sargeant and Imhof, 2000) exchangeable cations have been determined using Gilman method (where pH >7) and Tucker method (pH <7). Exchangeable Sodium % (ESP) has been calculated here as the percentage of sodium in relation to the sum of the exchangeable basic cations.
Land Use
The soils of this map unit have always been regarded as ideally suited for irrigated permanent pastures and irrigated lucerne. Skene and Walbran (1948) state: “It apparently has a high field moisture capacity and will probably take relatively large waterings. Under irrigation, there is some possibility of percolation of water into the deep subsoil of this soil type, particularly where this is of sandy clay texture. Judicious handling of water should be advocated at the onset to prevent the formation of elevated water tables in this and adjoining soil types; although fortunately salinity is not a factor in this type.” They also mention that the uneven topography of the landscape is the main handicap to irrigation and mention the additional attention required to apply water efficiently to an irrigation layout of short runs and variable slopes.
Thus over-watering of the soils of this map unit has long been recognised and it is likely that spray irrigation will afford the best water control.
© State of Victoria (Agriculture Victoria) 1996 - 2025.

This work, Victorian Resources Online, is licensed under a Creative Commons Attribution 4.0 licence. You are free to re-use the work under that licence, on the condition that you credit the State of Victoria (Agriculture Victoria) as author, indicate if changes were made and comply with the other licence terms.
The licence does not apply to ‘branding’ or some ‘images or photographs’ that may be owned by third parties. We ask you to seek prior approval to use images using the VRO feedback form. Access to higher quality images can also be provided on request.
This page was last updated on 09/04/2021.