
Denison (De)
Geology
Quaternary (Late Pleistocene) alluvium.
Landform
Stagnant alluvial plain - defined as an alluvial plain where erosion and aggradation, by channelled and over-bank stream flow, is barely active or inactive due to reduced water supply.
An interactive visualisation of the landscape in the Denison mapping unit is provided here. Zooming and panning functionality is provided as well as the ability to click on icons to provide further information about the landscape (e.g. soils, geology).
Photo
Panoroma
Information
Soil reference site
Video
Use your keyboard and mouse to navigate the study area. To zoom in or out, left mouse click inside the panorama and use the mouse's 'scroll wheel' (if you have one). To explore the landscape, click and hold the left mouse button on the landscape and move the mouse left, right, up or down or use 'cursor keys'.
Prior to the incision of the modern stream system, earlier stream systems (referred to as prior streams) deposited alluvium that now makes up the Tinamba, Denison and Montgomery map units. The Denison map unit occurs on what was then the far flood plain of these earlier stream systems, with redder soils of the Tinamba map unit occurring closer to the prior stream channels themselves. The surface soils on the far flood plains of the earlier stream systems are usually finer and heavier textured than the soils closer to the prior stream channels. Whilst the Montgomery map unit also occurs on the far flood plains, the surface soils are deeper and the overall profile less clayey than the soils of the Denison map unit.
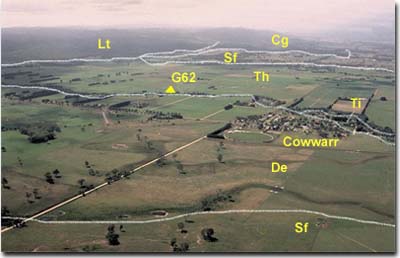
This photo shows an extensive area of the Denison (De) map unit south of Cowwarr. Note the drainage depressions within the area. The Tinamba (Ti) map unit (redder soil) occurs in the eastern part of the Cowwarr township. The extensive river flats Thomson map unit (Th) are in the middleground.
Original Vegetation
It is likely that this map unit was predominantly grassland (Lunt, 1997). Skene and Walbran (1948,1949) described these areas as sparsely timbered plains. The more westerly occurrences did carry scattered red gum (Eucalyptus camaldulensis).
Previous Maps and Reports
Skene and Walbran (1948, 1949) mapped in considerable detail much of the area now irrigated. In the Nambrok district, the Denison map unit mainly comprises Denison clay loam, Wandocka clay loam and Nambrok clay loam soil types as mapped by Skene and Walbran (1948). Note: The current map unit Wandocka, north-east and east of Sale, is considered to be predominantly the former Wandocka clay loam.
Ward (1977) mapped similar areas near Sale into the Bundalaguah soil association.
This map unit is included within the Sale and Nambrok and Valencia Land Systems as described by Aldrick et al. (1992).
Soils
The soils have a dark greyish brown clay loam surface soil with a greyish brown clay loam to light clay sub-surface which is sporadically to conspicuously bleached. An abrupt to clear change occurs at about 20 to 35 cm to a mottled greyish brown to dark brown, medium to heavy clay. This clay continues to at least 1 metre depth. The area of the Denison map unit east of Clydebank, has a light clay to silty clay loam deeper subsoil rather than heavy clay [referred to as Denison clay loam, light phase by Skene and Walbran, (1949)]. The soils in this map unit are generally classified as Brown or Yellow Sodosols using the Australian Soil Classification.
Chemical and Physical Analysis
Analyses are provided below for soil pit Site GP31 [equivalent to Type IV, Newell (1962)] and Site GP66 [equivalent to Denison clay loam, Skene and Walbran (1948)] which are in this map unit. Analyses of six profiles on this map unit are provided below from Skene and Walbran (1948, 1949). A profile on this map unit is also described by Aldrick et al. (1992).
The surface soils generally have a pH of between 5.5 and 6.0 in the surface and become alkaline with depth. All subsoils analysed were sodic to strongly sodic.
GP31. Soil Pit Site (Sargeant and Imhof , 2000)
Depth cm | Texture | pH | EC dS/m | Cl % | Nitrogen % | Carbon % | Ca meq% | Mg meq% | K meq% | Na meq% | H meq% | ESP % | Gravel % | Coarse sand % | Fine sand % | Silt % | Clay % | LAT % |
0-25 | FSCL | 6 | 0.06 | 0.13 | 1.5 | 3.8 | 1.5 | 0.3 | 0.3 | 2 | 21 | 48 | 27 | 1 | ||||
25-35 | CL | 6.1 | 0.08 | 2.0 | 2.0 | 0.4 | 0.4 | 4 | 19 | 44 | 33 | <1 | ||||||
35-60 | LMC | 7.1 | 0.11 | 2.8 | 7.0 | 0.4 | 1.3 | 12 | 3 | 9 | 28 | 60 | 1 | |||||
60-110 | MHC | 8.5 | 0.21 | 2.8 | 8.2 | 0.4 | 2.0 | 15 | 1 | 5 | 33 | 61 | 1 | |||||
110+ | MC | 9.0 | 0.20 | 2.0 | 6.6 | 0.3 | 2.4 | 22 | 1 | 6 | 39 | 54 | 1 |
GP66. Soil Pit Site (Sargeant and Imhof, 2000)
Depth cm | Texture | pH | EC dS/m | Cl % | Nitrogen % | Carbon % | Ca meq% | Mg meq% | K meq% | Na meq% | H meq% | ESP % | Gravel % | Coarse sand % | Fine sand % | Silt % | Clay % | LAT % |
0-10 | ZCL | 5.4 | 0.28 | 0.36 | 3.7 | 4.4 | 3.3 | 1.2 | 0.4 | 4 | 24 | 31 | 32 | 2 | ||||
10-20 | CL | 5.7 | 0.10 | 2.6 | 2.1 | 0.7 | 0.4 | 3 | 28 | 34 | 35 | 1 | ||||||
20-35 | MC | 6.0 | 0.07 | 2.8 | 5.5 | 0.6 | 1.0 | 6 | 13 | 20 | 61 | 1 | ||||||
35-50 | HC | 7.0 | 0.12 | 3.2 | 8.9 | 0.5 | 2.1 | 15 | 2 | 10 | 18 | 70 | 1 | |||||
50-90 | HC | 8.1 | 0.30 | 3.0 | 10.0 | 0.5 | 3.8 | 22 | 1 | 10 | 19 | 70 | 1 | |||||
90+ | HC | 8.9 | 0.07 | 2.9 | 9.5 | 0.5 | 7.4 | 37 |
Denison clay loam, (Skene and Walbran, 1948)
Depth cm | Texture | pH | EC dS/m | Cl % | Nitrogen % | Carbon % | Ca meq% | Mg meq% | K meq% | Na meq% | H meq% | ESP % | Gravel % | Coarse sand % | Fine sand % | Silt % | Clay % | LAT % |
0-13 | CL | 5.7 | 0.15 | .016 | 0.351 | 4.36 | 3 | 19 | 38 | 31 | 1 | |||||||
13-23 | CL | 6.1 | 0.08 | .010 | 3 | 19 | 39 | 33 | 1 | |||||||||
23-30 | LC | 6.5 | 0.07 | .010 | 3 | 17 | 39 | 35 | 1 | |||||||||
30-53 | HC | 7.4 | 0.27 | .034 | 2 | 6 | 20 | 66 | 2 | |||||||||
53-91 | HC | 8.7 | 0.41 | .051 | 1 | 6 | 27 | 61 | 2 | |||||||||
91-147 | MC | 9.0 | 0.36 | .050 | 6 | 16 | 24 | 50 | 2 | |||||||||
147-183 | MC | 8.9 | 0.19 | .046 | 6 | 18 | 18 | 52 | 1 | |||||||||
183-213 | MC | 9.0 | 0.08 | .046 | 6 | 20 | 17 | 52 | 1 | |||||||||
213-244 | LC | 9.0 | 0.34 | .047 | 2 | 30 | 21 | 44 | 1 | |||||||||
244-279 | ZC | 8.8 | 0.37 | .047 | <1 | 7 | 38 | 50 | 1 | |||||||||
279-310 | ZC | 8.7 | 0.36 | .047 | 1 | 13 | 42 | 41 | 1 |
Denison clay loam, (Skene and Walbran, 1948)
Depth cm | Texture | pH | EC dS/m | Cl % | Nitrogen % | Carbon % | Ca meq% | Mg meq% | K meq% | Na meq% | H meq% | ESP % | Gravel % | Coarse sand % | Fine sand % | Silt % | Clay % | LAT % |
0-10 | CL | 5.8 | 0.11 | .009 | 0.218 | 3.06 | 4.7 | 3.1 | 0.5 | 0.3 | 1 | 29 | 37 | 25 | 2 | |||
10-24 | CL | 5.8 | 0.06 | .002 | 1 | 30 | 37 | 27 | 1 | |||||||||
24-34 | CL | 6.0 | 0.06 | .003 | 2 | 29 | 35 | 29 | 2 | |||||||||
36-62 | HC | 6.6 | 0.19 | .022 | 1 | 11 | 20 | 61 | 2 | |||||||||
62-89 | HC | 8.7 | 0.40 | .033 | <1 | 9 | 24 | 62 | 2 | |||||||||
89-139 | MC | 8.7 | 0.29 | .034 | <1 | 17 | 34 | 46 | 1 | |||||||||
139-187 | LC | 8.8 | 0.27 | .033 | <1 | 12 | 43 | 41 | 1 |
Denison clay loam, (Skene and Walbran, 1948)
Depth cm | Texture | pH | EC dS/m | Cl % | Nitrogen % | Carbon % | Ca meq% | Mg meq% | K meq% | Na meq% | H meq% | ESP % | Gravel % | Coarse sand % | Fine sand % | Silt % | Clay % | LAT % |
0-14 | CL | 6.0 | 0.15 | .013 | 0.169 | 1.96 | 3.8 | 1.8 | 0.3 | 0.2 | 8.6 | 1 | 1 | 17 | 45 | 32 | 1 | |
14-24 | CL | 5.7 | 0.08 | .005 | 2.5 | 2.2 | 0.3 | 0.2 | 8.2 | 1 | 1 | 15 | 43 | 36 | 1 | |||
24-34 | LC | 5.9 | 0.08 | .006 | 1 | 14 | 38 | 43 | 2 | |||||||||
34-50 | HC | 6.4 | 0.14 | .013 | 1.6 | 10.7 | 0.6 | 2.1 | 8.3 | 9 | <1 | 5 | 21 | 68 | 2 | |||
50-67 | HC | 7.6 | 0.21 | .019 | <1 | 3 | 20 | 70 | 1 | |||||||||
67-89 | HC | 8.4 | 0.25 | .026 | 3.7 | 11.7 | 0.6 | 3.5 | 0 | 18 | <1 | 3 | 25 | 66 | 1 | |||
89-144 | HC | 8.7 | 0.33 | .036 | <1 | 5 | 28 | 63 | 1 | |||||||||
144-187 | HC | 8.7 | 0.35 | .041 | <1 | 6 | 22 | 66 | 1 |
Nambrok clay loam, (Skene and Walbran, 1948)
Depth cm | Texture | pH | EC dS/m | Cl % | Nitrogen % | Carbon % | Ca meq% | Mg meq% | K meq% | Na meq% | H meq% | ESP % | Gravel % | Coarse sand % | Fine sand % | Silt % | Clay % | LAT % |
0-15 | CL | 6.5 | 0.10 | .005 | 0.142 | 1.68 | 2 | 311 | 35 | 27 | 1 | |||||||
15-36 | LC | 6.0 | 0.05 | .004 | 2 | 30 | 32 | 32 | 1 | |||||||||
36-69 | HC | 6.5 | 0.11 | .013 | 8 | 5 | 10 | 15 | 63 | 1 | ||||||||
69-112 | HC | 8.2 | 0.21 | .022 | 3 | 2 | 10 | 19 | 67 | 1 | ||||||||
112-147 | HC | 8.9 | 0.23 | .019 | 1 | 16 | 18 | 62 | 1 |
Wandocka clay loam, (Skene and Walbran, 1948)
Wandocka clay loam, (Skene and Walbran, 1948)Depth cm | Texture | pH | EC dS/m | Cl % | Nitrogen % | Carbon % | Ca meq% | Mg meq% | K meq% | Na meq% | H meq% | ESP % | Gravel % | Coarse sand % | Fine sand % | Silt % | Clay % | LAT % |
0-8 | CL | 6.3 | 0.08 | .004 | 0.188 | 2.39 | 3.0 | 2.1 | 0.4 | 0.2 | 3 | 33 | 32 | 25 | <1 | |||
8-15 | CL | 5.8 | 0.05 | .003 | 3 | 33 | 32 | 28 | 3 | |||||||||
15-30 | LC | 6.0 | 0.05 | .007 | 2.5 | 2.0 | 0.3 | 0.4 | 3 | 32 | 30 | 33 | 1 | |||||
30-53 | HC | 6.5 | 0.12 | .010 | 2.5 | 6.6 | 0.6 | 2. 1 | 18 | 2 | 18 | 18 | 56 | 2 | ||||
53-66 | HC | 7.6 | 0.18 | .018 | 1 | 4 | 12 | 17 | 64 | 1 | ||||||||
66-97 | HC | 8.3 | 0.27 | .030 | 2.7 | 10.6 | 0.7 | 3.9 | <1 | 22 | 1 | 11 | 17 | 67 | 1 | |||
97-162 | HC | 8.8 | 0.10 | .037 | 1 | 10 | 18 | 67 | 1 | |||||||||
162-221 | HC | 8.8 | 0.16 | .041 | 1 | 10 | 21 | 63 | 1 |
Denison clay loam, light phase, (Skene and Walbran, 1949)
Depth cm | Texture | pH | EC dS/m | Cl % | Nitrogen % | Carbon % | Ca meq% | Mg meq% | K meq% | Na meq% | H meq% | ESP % | Gravel % | Coarse sand % | Fine sand % | Silt % | Clay % | LAT % |
0-20 | CL | 5.7 | 0.13 | .018 | 0.202 | 2.44 | 5.3 | 2.3 | 0.2 | 0.3 | 3 | 41 | 30 | 21 | 2 | |||
20-36 | CL | 5.7 | 0.16 | .020 | 1 | 45 | 29 | 22 | 1 | |||||||||
36-43 | CL | 5.8 | 0.16 | .024 | 1 | 42 | 28 | 25 | 1 | |||||||||
43-71 | MC | 6.5 | 0.34 | .053 | 4.1 | 7.9 | 0.1 | 1.5 | 11 | <1 | 34 | 17 | 43 | 2 | ||||
71-89 | LC | 7.4 | 0.39 | .053 | <1 | 42 | 19 | 33 | 1 | |||||||||
89-114 | LC | 8.7 | 0.44 | .060 | 1 | 23 | 38 | 33 | 1 | |||||||||
114-157 | MC | 9.4 | 0.51 | .059 | 20 | 1 | 21 | 26 | 47 | 3 |
Profile 66, Valencia 1, (Aldrick et al.,1992)
Depth cm | Texture | pH | EC dS/m | Cl % | Nitrogen % | Carbon % | Ca meq% | Mg meq% | K meq% | Na meq% | H meq% | ESP % | Gravel % | Coarse sand % | Fine sand % | Silt % | Clay % | LAT % |
0-10 | CL | 5.5 | 0.10 | .010 | 0.29 | 3.17 | 1.8 | 1.9 | 0.6 | 0.5 | 12.8 | 3 | 4 | 28 | 37 | 23 | ||
10-18 | CL | 5.4 | 0.06 | .007 | 0.14 | 1.43 | 1.0 | 1.3 | 0.3 | 0.4 | 10.4 | 3 | 5 | 30 | 50 | 13 | ||
20-30 | ZCL | 5.7 | 0.06 | .006 | 0.065 | 0.59 | 0.9 | 2.1 | 0.2 | 0.6 | 7.0 | 6 | 4 | 30 | 39 | 26 | ||
30-60 | HC | 7.5 | 0.33 | .036 | 3.0 | 11.2 | 1.0 | 4.5 | 5.4 | 18 | 1 | 1 | 9 | 17 | 71 | |||
90-120 | HC | 8.4 | 0.90 | .11 | 1.9 | 9.9 | 0.8 | 5.7 | 2.1 | 28 | <1 | 11 | 20 | 67 |
Particle size distribution data given for Skene and Walbran (1948, 1949) does not include the water content of the soil. As a result the coarse sand, fine sand, silt, clay and loss on acid treatment (LAT) may not add up to 100%. Aldrick et al. (1992) does not provide LAT data.
Other symbols include: pH - analysed in water; EC - electrical conductivity; Cl - chloride; Ca - exchangeable calcium; Mg - exchangeable magnesium, K - exchangeable potassium; Na - exchangeable sodium; H - exchangeable hydrogen; ESP - exchangeable sodium percentage.
For Soil Pit Sites (Sargeant and Imhof, 2000) exchangeable cations have been determined using Gilman method (where pH >7) and Tucker method (pH <7). Exchangeable Sodium % (ESP) has been calculated here as the percentage of sodium in relation to the sum of the exchangeable basic cations.
Land Use
Where irrigation water is available, these soils are irrigated. The Skene and Walbran soil types: Denison clay loam and Nambrok clay loam, are regarded as the better soils, as they have a deeper surface soil and are slightly lighter in texture than Wandocka clay loam.
© State of Victoria (Agriculture Victoria) 1996 - 2025.

This work, Victorian Resources Online, is licensed under a Creative Commons Attribution 4.0 licence. You are free to re-use the work under that licence, on the condition that you credit the State of Victoria (Agriculture Victoria) as author, indicate if changes were made and comply with the other licence terms.
The licence does not apply to ‘branding’ or some ‘images or photographs’ that may be owned by third parties. We ask you to seek prior approval to use images using the VRO feedback form. Access to higher quality images can also be provided on request.
This page was last updated on 25/01/2019.