Current and predicted extent of salinity
 Groundwater Flows Salinity | This map shows the distribution of mapped discharge salinity in the Glenelg-Hopkins region - overlayed on Groundwater Flow Systems mapping. At present 27 472 hectares of discharge salinity have been mapped in the Glenelg-Hopkins region. Much of the mapped salinity is primary, although this distinction has little meaning anyway in situations where the rate of naturally occurring salinity is modified by human changes to the environment, especially when the changes have occurred over centuries. The mapping does not include all large lakes, or all estuarine areas (such as the Glenelg River estuary). In fact, the salinity mapping is regarded as incomplete and it is believed that many hectares of salt affected land remain unmapped. |
A major study conducted as a part of the salinity component of the National Land and Water Resources Audit for Victoria, was the ‘Extent and Impact of Dryland Salinity in Victoria’. The main aim of the study was to estimate the current and future extent and impact of shallow water tables and dryland salinity, and to consider the adequacy of the groundwater monitoring network.
The total area of land predicted (SKM 2000) to have shallow water tables, in the worst case scenario (144 500 ha) is more than five times the area of land mapped as having dryland salinity as estimated by Munro (Munro 2000). The area of land predicted to have shallow water tables in 2020 is 19.7% (429 600 ha) and for 2050 is 43% (947 500 ha) of the Glenelg-Hopkins Catchment Management Region. Glenelg-Hopkins is one of three CMA regions where more than 40% of the catchment in 2050 is predicted to contain shallow water tables given a worse-case scenario projected trend (projection of 1988-93 groundwater trends). It is important to recognise that the NLWRA projections are purely based on historic trend information without consideration of a recharge-discharge equilibrium circumstance being reached beforehand - so that the projections are likely to over-estimate the extent of future shallow watertables. | 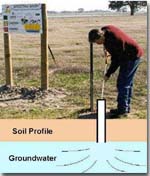 |
Predicted water table levels throughout Victoria for the year 2050:
The study is essentially predicting shallow water tables, not salinity. The connection between maps of water table levels and salinity is built around the assumption where water tables are within 2 m or less from the ground surface, processes of capillary rise occur, which concentrate salinity. Although this assumption is based on strong empirical evidence, it is acknowledged that not all of the land mapped (as having water tables < 2 m from the ground surface) will become salt affected. The Glenelg-Hopkins Catchment Management Region is one of the 20 catchments within Australia that has been selected to be part of the National Action Plan (NAP), commencing in 2001. The NAP is a program for Salinity and Water Quality, where the Federal Government have made $152 million available over a period of seven years, which is to be matched by state funds. |  Watertable Levels Source: SKM (2000) |
© State of Victoria (Agriculture Victoria) 1996 - 2025.

This work, Victorian Resources Online, is licensed under a Creative Commons Attribution 4.0 licence. You are free to re-use the work under that licence, on the condition that you credit the State of Victoria (Agriculture Victoria) as author, indicate if changes were made and comply with the other licence terms.
The licence does not apply to ‘branding’ or some ‘images or photographs’ that may be owned by third parties. We ask you to seek prior approval to use images using the VRO feedback form. Access to higher quality images can also be provided on request.
This page was last updated on 23/03/2020.