
IrriGate Newsletter, Issue Spring 2011 - Issue 7
Download the PDF version of this document: Irrigate Newsletter - Spring 2011 - Issue 7 (PDF 277 KB)
To view the information PDF requires the use of a PDF reader. This can be installed for free from the Adobe website (external link).
Sustainable Irrigated Landscapes - North East - Mid and Upper Goulburn Broken
 |  |
| North East Dryland Catchment | Goulburn Broken Dryland Catchment (excluding the Shepparton Irrigation Region) |
Welcome to IrriGate Issue 7
It is getting close, or may have already past, time to consider the first irrigation to avoid production losses. Dig up some dirt and make an assessment, and remember there is still grant money available for soil moisture monitoring tools. I would also like to thank Wendy Paglia for her help over many years and welcome Suzanne Briggs to the team.
Dennis Watson - Editor
Inside this issue
Counting the cost of poor distribution uniformity | Seeking interest in Tracking irrigation | NE/GB Sustainable Irrigation Team - Dryland
Counting the cost of poor distribution uniformity
The distribution uniformity of a spray irrigation is a measure of how efficiently water is applied across the paddock. This is measured as a percentage the higher the better. A low distribution uniformity can mean crop growth is reduced, or more irrigation water needs to be applied to compensate. As well as using more water this also increases pumping costs.
An average water demand for most fodder crops and pastures in the North East and Goulburn Broken Dryland CMA regions is around 6 ML/ha. Compensating for a poor distribution uniformity of 70% and applying more water to make it equivalent to a 90% system means applying an extra 1.9 ML/ha. The extra cost of this water and pumping is likely to be around $60 to $150 per hectare depending on the irrigation system and the power source. For high yielding viticulture the average demand is around 4ML/ha, which means applying an extra 1.3 ML/ha to compensate for a distribution uniformity of only 70%; costing around $60 to $95/ha. The difference between four typical irrigation system used across the regions is shown in Table 1.
extra water cost ($/ha) | extra fuel cost ($/ha) | Total ($/ha) | ||
| Centre Pivot | electricity | 38 | 24 | 62 |
| diesel | 38 | 42 | 80 | |
| Bike shift | electricity | 38 | 46 | 84 |
| diesel | 38 | 74 | 112 | |
| travelling gun | electricity | 38 | 70 | 108 |
| diesel | 38 | 114 | 152 | |
| Drip irrigation | electricity | 26 | 35 | 61 |
| diesel | 26 | 68 | 94 |
Assumptions:
- Diesel at $1.2/litre
- Electricity at $0.17 /Kwatt.hr
- Water at $20/ML (temporary water value)
- 70% pump efficiency
- Operating at typically average pump pressures.
Seeking interest in Tracking irrigation again this season
Over the last irrigation season some irrigators took part in a program where they recorded their irrigation and rainfall. This information was examined each month to check whether irrigation application rates where keeping up with crop demands or if too much water was applied. An example from last year is sown in Figure 1. The horizontal blue dotted line represents a full soil water profile, while the horizontal red dotted line represents plant stress levels. The black line represents the theoretical plant use or soil moisture level, responding to rainfall, irrigation and evaporation. When this line drops past the red line the crop is theoretically suffering from moisture stress.
Figure 1: Tracking the soil moisture level over the 2010/2011 irrigation season
In this case there where a couple of times where an irrigation may have been warranted prior to December but subsequent rainfalls occurred before any major crop stress would have occurred. The crop started to enter a stressed stage late December to early January and a serries of irrigations of 11mm occurred but these where only enough to keep up with evaporation and not enough to lift the crop out of the stressed stage. The crop was then saved by some reasonable rainfall events early February. A similar scenario occurred towards the end of January. The crop was also again placed under stress for the March April period, however this may have been a deliberate method to avoid waterlogging overwinter. All up from March to February the crop could have been under moisture stress for over 70 days. Soil moisture probes were installed under the crop which validated these results.
If anyone is interested in participating in this program over the coming irrigation season please contact Dennis Watson on (02) 6030 4567 or 0429 304 567
DPI NE/GB Sustainable Irrigation Team - Dryland
| Dennis Watson Irrigation Specialist DPI Rutherglen Centre (02) 6030 4567 0429 304 567 dennis.watson@dpi.vic.gov.au |  Dennis Watson |
| Suzanne Briggs Catchment Management Officer DPI Wangaratta Centre (03) 5723 8674 0400 884 813 suzanne.briggs@dpi.vic.gov.au |  Suzanne Briggs |
Welcome to IrriGate Issue 6.
I would like to take this opportunity to say farewell, I will be relocating to DPI Wangaratta to take up a new position. I have enjoyed my time with irrigation immensely, meeting and getting to know you all, originally with Water for Growth and Project Leader John Nieuwenhius and in recent times with Water Smart Farms and Project Leader Dennis Watson.
Best Wishes Wendy Paglia - Editor
Tracking water requirement over the season | Monitoring the plant’s moisture not the soils | Contact Us
Tracking water requirement over the season
What an unusual irrigation season this one has been. The majority of irrigators across the region only irrigated 2 to 3 times over the season; some not at all. Figure 1 shows an example of a theoretical water budget for lucerne grown in the Myrtleford area over the 2010/2011 irrigation season. The blue line indicates a water filled soil profile, while below the red line indicates plant stress. In this case only two irrigation events occurred, 15 mm applied on the 5 January and 25 mm applied on the 28 January indicated on the graph by the light blue triangles. This with the addition of rainfall was enough to just about keep the water balance out of a negative state, until the start of March. Another irrigation at this point in hind sight could have been useful. However given the rainfall events prior, at the time it made sense not to irrigate and exacerbate potential water logging issues as winter approaches.
Figure 1: Water balance of lucerne over the 2010-2011 irrigation season
The yellow dots on the graph are soil moisture readings shown in Kpa using the scale on the right hand side of the graph. These were recorded from a “G-dot” installed at 30 cm. The soil moisture readings correlate pretty well with the theoretical water balance.
i.e. when the theoretical water balance is indicating the soil moisture is adequate the probe is saying the same thing, and when the water balance is getting dry the probe reflects this.
Monitoring the plant’s moisture not the soils
A number of irrigators are striving to improve water use efficiency by measuring the level of moisture stored in the soil to determine if irrigation should occur and how much water should be applied. There is a myriad of equipment out there that can help do this. There is however other equipment which can measure moisture stress directly from the plant. There are a couple of benefits of doing this.
This can be a little bit awkward and time consuming to use in the field on a daily basis but can provide some very useful information at strategic times throughout the irrigation season. The “Pump-Up Pressure Chamber” is more commonly used in horticulture than the fodder industry. This units sell for approximately $1,500, but remember you may be eligible for a 50% rebate. More information can be found on the following website. www.pmsinstrument.com (external link) | 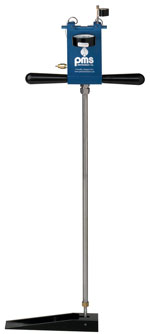 Figure 2: Pump-Up Pressure Chamber |
Figure 3: Diagram a leaf in the Pump-Up Pressure Chamber
| Wendy Paglia Project Support Officer DPI Ovens Centre (03) 5731 1206 wendy.paglia@dpi.vic.gov.au |  Wendy Paglia |
If you would like to receive this information/publication in an accessible format (such as large print or audio) please call the Customer Service Centre on: 136 186, TTY: 1800 122 969, or email customer.service@dpi.vic.gov.au
Published by the Department of Primary Industries, Sustainable Irrigated Landscapes, March 2011,
© The State of Victoria, 2011
This publication is copyright. No part may be reproduced by any process except in accordance with the provisions of the Copyright Act 1968.
Authorised by the Victorian Government, 1 Spring Street, Melbourne 3000
ISSN :1837-4077
Disclaimer:
This publication may be of assistance to you but the State of Victoria and its employees do not guarantee that the publication is without flaw of any kind or is wholly appropriate for your particular purposes and therefore disclaims all liability for any error, loss or other consequence which may arise from you relying on any information in this publication.
For more information about DPI go to www.dpi.vic.gov.au or call the Customer Call Centre on 136 186.
© State of Victoria (Agriculture Victoria) 1996 - 2025.

This work, Victorian Resources Online, is licensed under a Creative Commons Attribution 4.0 licence. You are free to re-use the work under that licence, on the condition that you credit the State of Victoria (Agriculture Victoria) as author, indicate if changes were made and comply with the other licence terms.
The licence does not apply to ‘branding’ or some ‘images or photographs’ that may be owned by third parties. We ask you to seek prior approval to use images using the VRO feedback form. Access to higher quality images can also be provided on request.
This page was last updated on 25/01/2019.