
Tunnel Erosion in East Gippsland
|
| Acknowledgements | Executive Summary | Introduction | Information gathering | Mechanisms of tunnel erosion | Demonstration site | Regional soil pit information | Conclusion | Future projects | References | Appendix 1 | Appendix 2 | Appendix 3 | Appendix 4 | Appendix 5 |
Acknowledgements
The project management team would like to thank the following individuals and groups who were involved in this project over the past four years:
Landholders for sharing their methods for tunnel erosion rehabilitation from which these methods were developed.
Contractors Riley Earthmoving and in particular Peter Riley, Anthony “Butch” York, Steve Bartlett and Gary Cornall for enabling us to put theory into practice Ewan Waller for agreeing to have the demonstration site on his property.
Landholders involved in the onground works who have enthusiastically adopted new technologies to an old problem so willingly.
Dr Keith Thomas for raising tunnel erosion as an issue in the major Gippsland Lakes studies that were occurring when this project started.
The East Gippsland Landcare Network committee and staff for their continuous support of the project, in particular Darren Williams, Tracey McRae, Irene Meadley and Natalie Jenkins David Rees, Doug Crawford, David Cummings and Ian Sargeant for their technical support.
This report was prepared to document investigation and rehabilitation of tunnel erosion in the Bairnsdale area. This project was a collaborative program between DPI Sustainable Landscapes (Bairnsdale) and the East Gippsland Landcare Network. Funded by Department of Sustainability and Environment (external link) (Bairnsdale) through the Gippsland Lakes Future Directions and Actions Plan (external link), the National Landcare Program (external link) and the Natural Heritage Trust.
| Authors/contributors Primary Authors: Peter Robinson1 and Dr Julianne Sargant1 Research and Report: Peter Robinson1 and Dr Julianne Sargant1 Soil Analysis: Doug Crawford2 and David Rees2 Appendices formatting and editing: Heather Adams1 Map Products: Anne Williams3 and Brett Mitchard1 Editing: Trish Lothian1 Artwork: Griffin Graphics Images: Peter Robinson1, Dr Julianne Sargant1 and Trevor Howden4 | 1 DPI, Farm Services Victoria 2 DPI, Future Farming Systems Research Division 3 Department of Sustainability and Environment 4 Glenaladale Landcare Group |
1. Executive Summary
Tunnel erosion poses a severe threat to livestock and people, inhibits use of the land and has considerable off-site impacts through suspended sediments and nutrients discharged to waterways.
This document reports on work done to recognise and reduce the tunnel erosion problem in East Gippsland. The work was initiated in response to sediment and nutrient entering the Gippsland Lakes via the Mitchell River, and the disruption to Bairnsdale’s water supply through periods of high turbidity in the Mitchell River. Work was done in two stages.
Stage 1
1. Determined the extent of tunnel erosion in the region.
2. Increased the awareness of tunnel erosion and how to detect it in the early stages of development.
3. Evaluated methods to rehabilitate tunnel erosion in the East Gippsland region using a combination of heavy machinery disturbance, and the amount and type of calcium required to ameliorate the soil dispersiveness in these soils.
In the past recommendations for the rehabilitation of tunnel erosion have been to revegetate and construct stock exclusion fencing. Knowledge about tunnel erosion in the Bairnsdale region had come from extension staff’s field knowledge through dealing with landholder requests for technical advice. Site visits by staff observed that where the erosion was frequently very visible, it was already threatening high value assets making remediation difficult. Another field observation was that tunnel erosion in East Gippsland affects whole farms and the traditional recommendations are therefore difficult to implement if the farms are to remain profitable and productive.
Stage 1 was carried out as a project “Reduction of sediment and nutrient export from tunnel affected areas of the Mitchell, Nicholson and Tambo Rivers”. It was funded by the Gippsland Lakes Future Directions and Actions Plan. This project has been the main focus of the information in this report.
Stage 2
This stage was the implementation of a tunnel erosion control using a rehabilitation technique developed from the demonstration in Stage 1.
Overall the demonstration site and the regional soil analysis provided sufficient data to develop a method for tunnel erosion rehabilitation that was comparable to gully erosion works termed “cost effective” in this report that have been used extensively in the East Gippsland region. As well, this report provides information about the extent, severity and location of tunnel erosion in this region.
The final cost effective method of rehabilitation for tunnel erosion that was developed involves the following process:
- application of 4t/ha of gypsum
- single pass deep ripping by a dozer no less than 38 tonnes and 300 horse power on contour with the rip lines 1 metre apart at 1 metre deep over the whole local paddock catchment area from top to bottom
- establishment of perennial pasture and in some cases, in combination with a crop in the first year depending on the slope of the site
- trees indigenous to the area were planted where it was impractical to put the sites back into production.
Both these projects have been implemented over the four year period from 2004 to 2008 and 445 hectares of tunnel erosion affected agricultural land has been rehabilitated, 37 km of fencing constructed and 10,500 trees planted. The total project cost has been $1.58 million with $800,000 of government funds and $780,000 of landholder contribution. This has prevented an estimated 2,850 tonnes of soil from entering the Bairnsdale region’s major rivers and the Gippsland Lakes.
Future projects
The method of rehabilitation of tunnel erosion in East Gippsland’s Foothill area has developed as result of these projects. However, further work is required to provide landholders with recommendations of how to manage these areas into the future to monitor rehabilitated sites and refine repair methods.
The demonstration site results indicate that soil disturbance is an effective method in itself of rehabilitation. This report has established the soils are highly dispersive (15 tonnes of gypsum is needed to ameliorate the soil) and recommended rates (4 tonnes of gypsum per year) are unable to address this issue in one year. Therefore further investigations are needed to determine effective application rates and follow-up application of ameliorants after rehabilitation works are completed, would be beneficial and if so at what rates and at the same time ensuring they are cost effective in the long term for the landholders.
2. Introduction
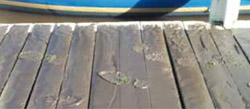
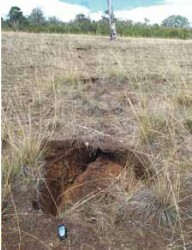
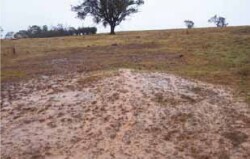
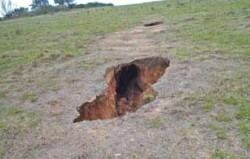
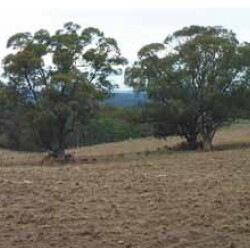
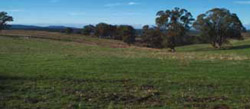
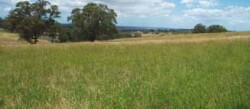
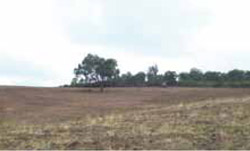
Tunnel erosion is a form of water erosion that results in underground passages, or tunnels, that develop in dispersive subsurface soils (Figures 1 & 2) and is a natural form of drainage (Boucher 1990). It has been well studied in parts of Victoria but little was known about its extent and impact in East Gippsland. Two main factors prompted the Department of Primary Industries to investigate the issue in the Bairnsdale region:
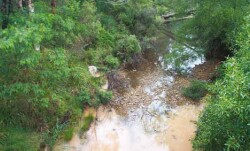
- the high volumes of nutrients and sediments entering the waters of the Gippsland Lakes via the Mitchell River (Figure 1) and,
- high turbidity levels in the catchment streams of the Lower Mitchell River causing interruptions to Bairnsdale water supply.
The key features about tunnel erosion in this area are:
- Knowledge about tunnel erosion in the Bairnsdale region has come from the field experience of extension staff dealing with landholder requests for technical advice.
- Standard advice across Victoria has been to exclude stock for at least a year when rehabilitating and revegetating.
- Tunnelling in East Gippsland is perhaps more widely distributed in sloping landscapes (but less concentrated) when compared to western Victoria (Ziebell and Richards 1993). This enables a different reclamation regime.
- When erosion is very visible it is difficult to remediate especially when it threatens high value assets.
This constituted the work of two projects: “East Gippsland Catchment Protection Project” (funded by Department of Sustainability and Environment Sustainable Landscapes Section and the Gippsland Lakes Future Directions and Actions Plan); and “What’s Beneath Your Feet – Sustainable Soil Management” (a collaborative program between DPI and the East Gippsland Landcare Network, funded by the National Landcare Program). This expanded the demonstration work into a large scale rehabilitation program across the foothills region north of Bairnsdale that forms part of the catchment for the Gippsland Lakes.
3. Information gathering
3.1 Spatial extent of tunnel erosion in East Gippsland - survey
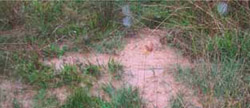
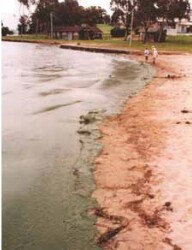
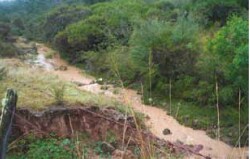
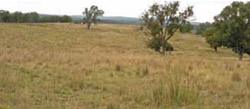
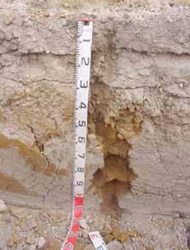
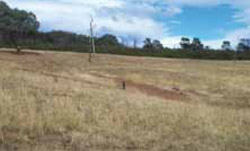
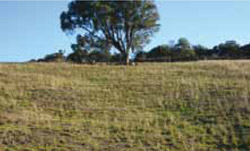
| Initially DPI contacted 3,047 landholders in an area around Bairnsdale from Stratford in the east to Lake Tyers in the west and Dargo in the north including Buchan, Bruthen, Gelantipy and Wulgulmerang. Property maps and a questionnaire about erosion severity were then sent to respondents. As a result over 100 properties were inspected. Erosion was assessed as detailed in Appendix three. Soil pits were excavated and examined at 15 locations both with and without tunnel erosion across the survey area (Figure 17). As a result of the survey and property inspections, tunnel erosion was classified as two different types in the East Gippsland region — and named ‘paddock’ and ‘escarpment’ tunnel erosion. The areas that ‘Paddock’ tunnel erosion (Figure 2) is predominant is mainly the Foothill region and usually develops at depths of up to 1.5 metres deep. ‘Escarpment’ tunnel erosion (Figure 3) is predominatly located on the Gippsland Lakes foreshore and frontage of the major river areas. These different types of erosion and where they occur have been depicted in Figure 4. The Foothills area (53,466 hectares) was identified from property inspections as having the highest proportion of tunnel erosion in the region (Figure 4). The Glenaladale area in the Foothills north of Bairnsdale was identified as the area of highest priority for remediation works because of the threat posed by tunnel erosion to quality of water for both the town’s water supply and the Lakes, and to farm safety. 3.2 Raising the awareness of tunnel erosion in the community From this regional survey a large gap was identified in regard to information available to service providers and land managers about how to identify tunnel erosion in East Gippsland. To resolve this knowledge gap, an East Gippsland Tunnel Erosion identification brochure (Appendix two) was developed. | 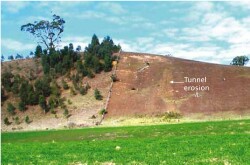 Left of the fence has been revegated with indigenous species and right of the fence has not been rehabilitated. Note the lines of sediment from the working tunnel erosion on the right. Left of the fence has been revegated with indigenous species and right of the fence has not been rehabilitated. Note the lines of sediment from the working tunnel erosion on the right.Figure 3: Example of escarpment tunnel erosion and rehabilitation |
The brochure has been used to support talks, radio interviews and media articles. Talks involved Landcare groups, EGCMA Catchment Advisory Groups, school and TAFE students and individual property owners in discussions of tunnel erosion to increase awareness of the processes and the effects of the erosion on and off the farm.
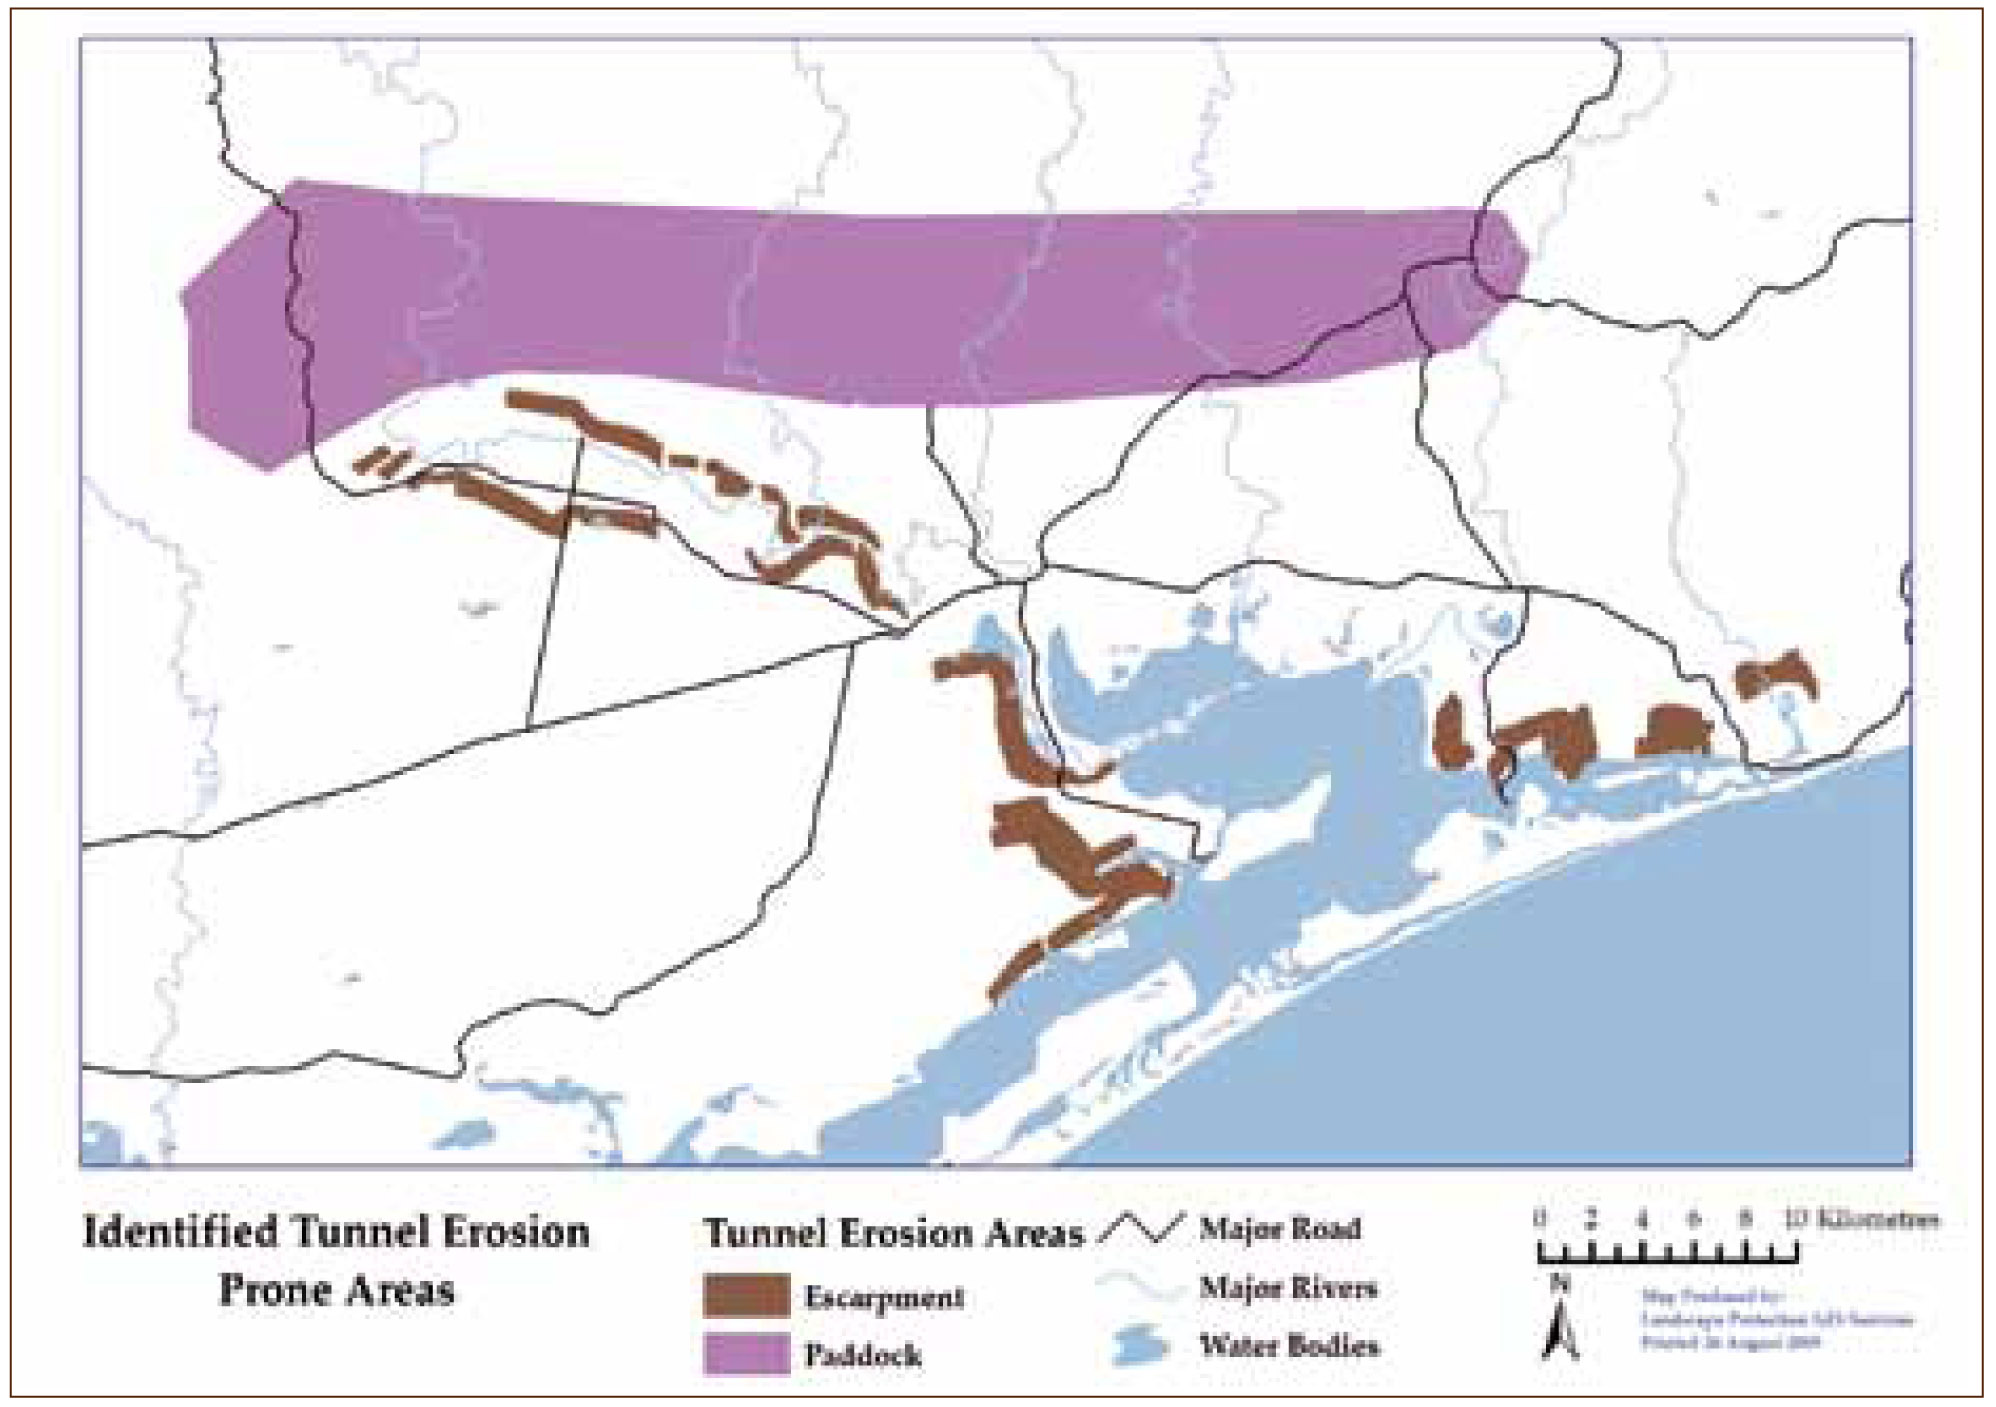 Figure 4: Areas inspected and determined as being affected by tunnel erosion in the Foothills Asset Management unit was 9,800 ha | 3.3 Pit sampling across the area, delineation of the foothill area, and pit site locations Soil pits were excavated at 15 locations across the Bairnsdale region (see Figure 17). Of these, 10 were located in the Foothills and five on the Red Gum Plains (East Gippsland Catchment Management Authority 2005). Locations were based on DPI field staff knowledge and the postal survey results. Samples were taken at different depths in the soil profiles by soil scientists Doug Crawford and David Rees. The following analyses were performed by the State Chemical Laboratories:- total phosphorous; available phosphorous or Olsen P; exchangeable calcium, magnesium, sodium and potassium and hydrogen; electrical conductivity; pH; total soluble solids; total carbon; organic matter; slaking; dispersion; and the proportions of coarse sand, silt and clay. From these results, the following were calculated: cation exchange capacity (CEC); calcium:magnesium ratio (Ca:Mg); and the amounts of calcium, magnesium; sodium and potassium expressed as a percentage of the cation exchange capacity. The results of these analyses are detailed in Section 6 of this report. 3.4 Erosion severity in the East Gippsland region - base line data The sediment transport from the Foothills area (Figure 4) as a result of tunnel erosion has been estimated as high as 1.6 tonnes of soil per hectare per year from severely affected areas to as low as 0.54 tonnes per hectare per year in paddocks low to moderately affected by tunnel erosion (Hancock et al 2007). The CSIRO SedNet model has estimated a soil loss of 8,000 tonnes per year from the Bairnsdale Foothills area, with 5,000 tonnes of soil per year reaching the Gippsland Lakes. In comparison gully erosion has also been modelled and estimated to produce sediment at between 1,000 and 5,000 tonnes per year entering the Gippsland Lakes (Hancock et al 2007). This information indicates that tunnel erosion is as effective at removing soil from the catchments as gully erosion and poses the same environmental and production risks in this region. |
4.1 Process of tunnel erosion
Soils susceptible to tunnel erosion typically have hard setting surface soils and dispersive subsoils (i.e. contain clay particles which readily separate into individual mobile particles when in direct contact with water). It often, but not exclusively, occurs on duplex soils (i.e. soils with sandy or loamy surface horizons with a sharp or clear boundary to clay subsoils) which are sodic. Sodicity is a measure of the exchangeable sodium in relation to other exchangeable cations (mainly calcium and magnesium) held on negative charges on the clay and is expressed as the exchangeable sodium percentage (ESP). If the ESP value is less than 8, the soil is non-sodic; from 8 – 15 the soil is sodic; and greater than 15 the soil is strongly sodic. The ESP and other exchangeable cation data is given in Section 5 of this report (Sargeant I and Sargant J 2005).
The chemical process of dispersion is caused by high levels of exchangeable sodium inherently present in sodic soils. When sodic soils are wet the sodium cations held onto the clay particles are surrounded by a water shell that forces the clay particles away from each other. This in turn results in the disintegration of the soil aggregates and causes dispersion (Lines-Kelly et al 2000). Thus when the sodic B horizon becomes wet, the clays that bind the fine and larger particles (silt and sand) together into soil aggregates swell and become suspended in the soil water. Dispersion typically affects clay particles less than 0.002 mm in diameter. Slaking is said to occur when the soil aggregates collapse but dispersion occurs when soil aggregates not only collapse but subsequently separate out into individual soil particles. Thus dispersion influences the microscopic structure of the soil through the breaking of the chemical bonds that hold the soil together (Peverill et al 2001). Once dispersed the clay particles then move into the soil pores from which they are easily washed via the tunnels away from the paddock.
Chemical treatment to modify dispersion involves the addition of calcium compounds to reduce the quantity of sodium ions on the exchange complex of clays by direct replacement. The two main sources of calcium for this purpose are gypsum and lime. There are two main effects when added to the soil. Firstly, the electrolyte strength is raised in the soil solution which suppresses dispersion and swelling. Secondly, for both lime and gypsum, calcium replaces the sodium at exchangeable sites (Peverill et al 2001). The sodium cations then become dissolved in the soil solution and usually leached from the system (Abbott and McKenzie 1996). This process can lead to better aggregation, enhanced porosity and improved soil structure. Historically in Australia gypsum has been used to reduce the dispersion of sodic soils (McKenzie et al 1993). However, studies overseas have shown that lime, while not as soluble as gypsum, still has the same chemical effects and may even remain in the soils for a longer period of time (Nadiu et al 1993). The other significant difference between lime and gypsum is the cost. Locally sourced lime delivered and spread in East Gippsland is half the cost of gypsum. Thus lime was included in the demonstration as a potential alternative to gypsum for the remediation of dispersive soils under East Gippsland conditions.
5. Demonstration site
A demonstration site was designed on one Glenaladale property (Figure 5) to demonstrate a cost effective method for remediation of typical paddock tunnel erosion, see Figure 6. Three things were to be evaluated. Firstly, could we influence the soil chemistry, through the use of ameliorants and reduce the dispersive behaviour of the soil? Secondly, what might the best mechanical treatment of the soil be to incorporate the ameliorants and to consolidate the tunnelled subsoil? Thirdly, could we establish perennial pasture to use enough soil water to decrease water available to potential tunnel systems?
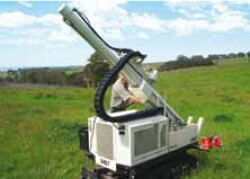
| 5.1 Rehabilitation method being tested Remediation techniques investigated the use of heavy machinery (bulldozer minimum size D8) to deep rip, chemical treatment through the addition of gypsum and lime and perennial pasture establishment. The deep ripping incorporated the gypsum or lime, improving soil structure. Together these processes had a synergistic effect on reducing the dispersiveness of sodic soils (Peverill et al 2001). Another benefit of deep ripping is the physical disturbance of the subsoils which, after settling, inhibits the path of the water and reduces its ability to develop hydraulic pressure and thus reduces the ability of water to transport soil downhill and the threat of tunnel erosion. The establishment of perennial pasture reduces the amount and speed of water entering into the profile decreasing the risk of erosion and at the same time improving farm productivity (Appendices four and five). 5.2 Demonstration site treatments Figures 7 and 8 show the demonstration site treatments. Six 0.5 ha plots were established on one Glenaladale property. Applications of lime or gypsum were applied before mechanical works commenced in the following ways: lime was spread in Plot A at a rate of two tonne/ha and in Plot B at one tonne/ha; gypsum was spread at a rate of two tonne/ha in Plot C and one tonne/ha in Plot D. Mechanical treatment consisted of ripping by a bulldozer to a depth of 1.4 m collapse existing tunnels and incorporate the lime or gypsum. Plots A, C and D were ripped up and down the slope as well as on the contour. Plots C and E were ripped along the contour only. No ripping was done in Plot F. | 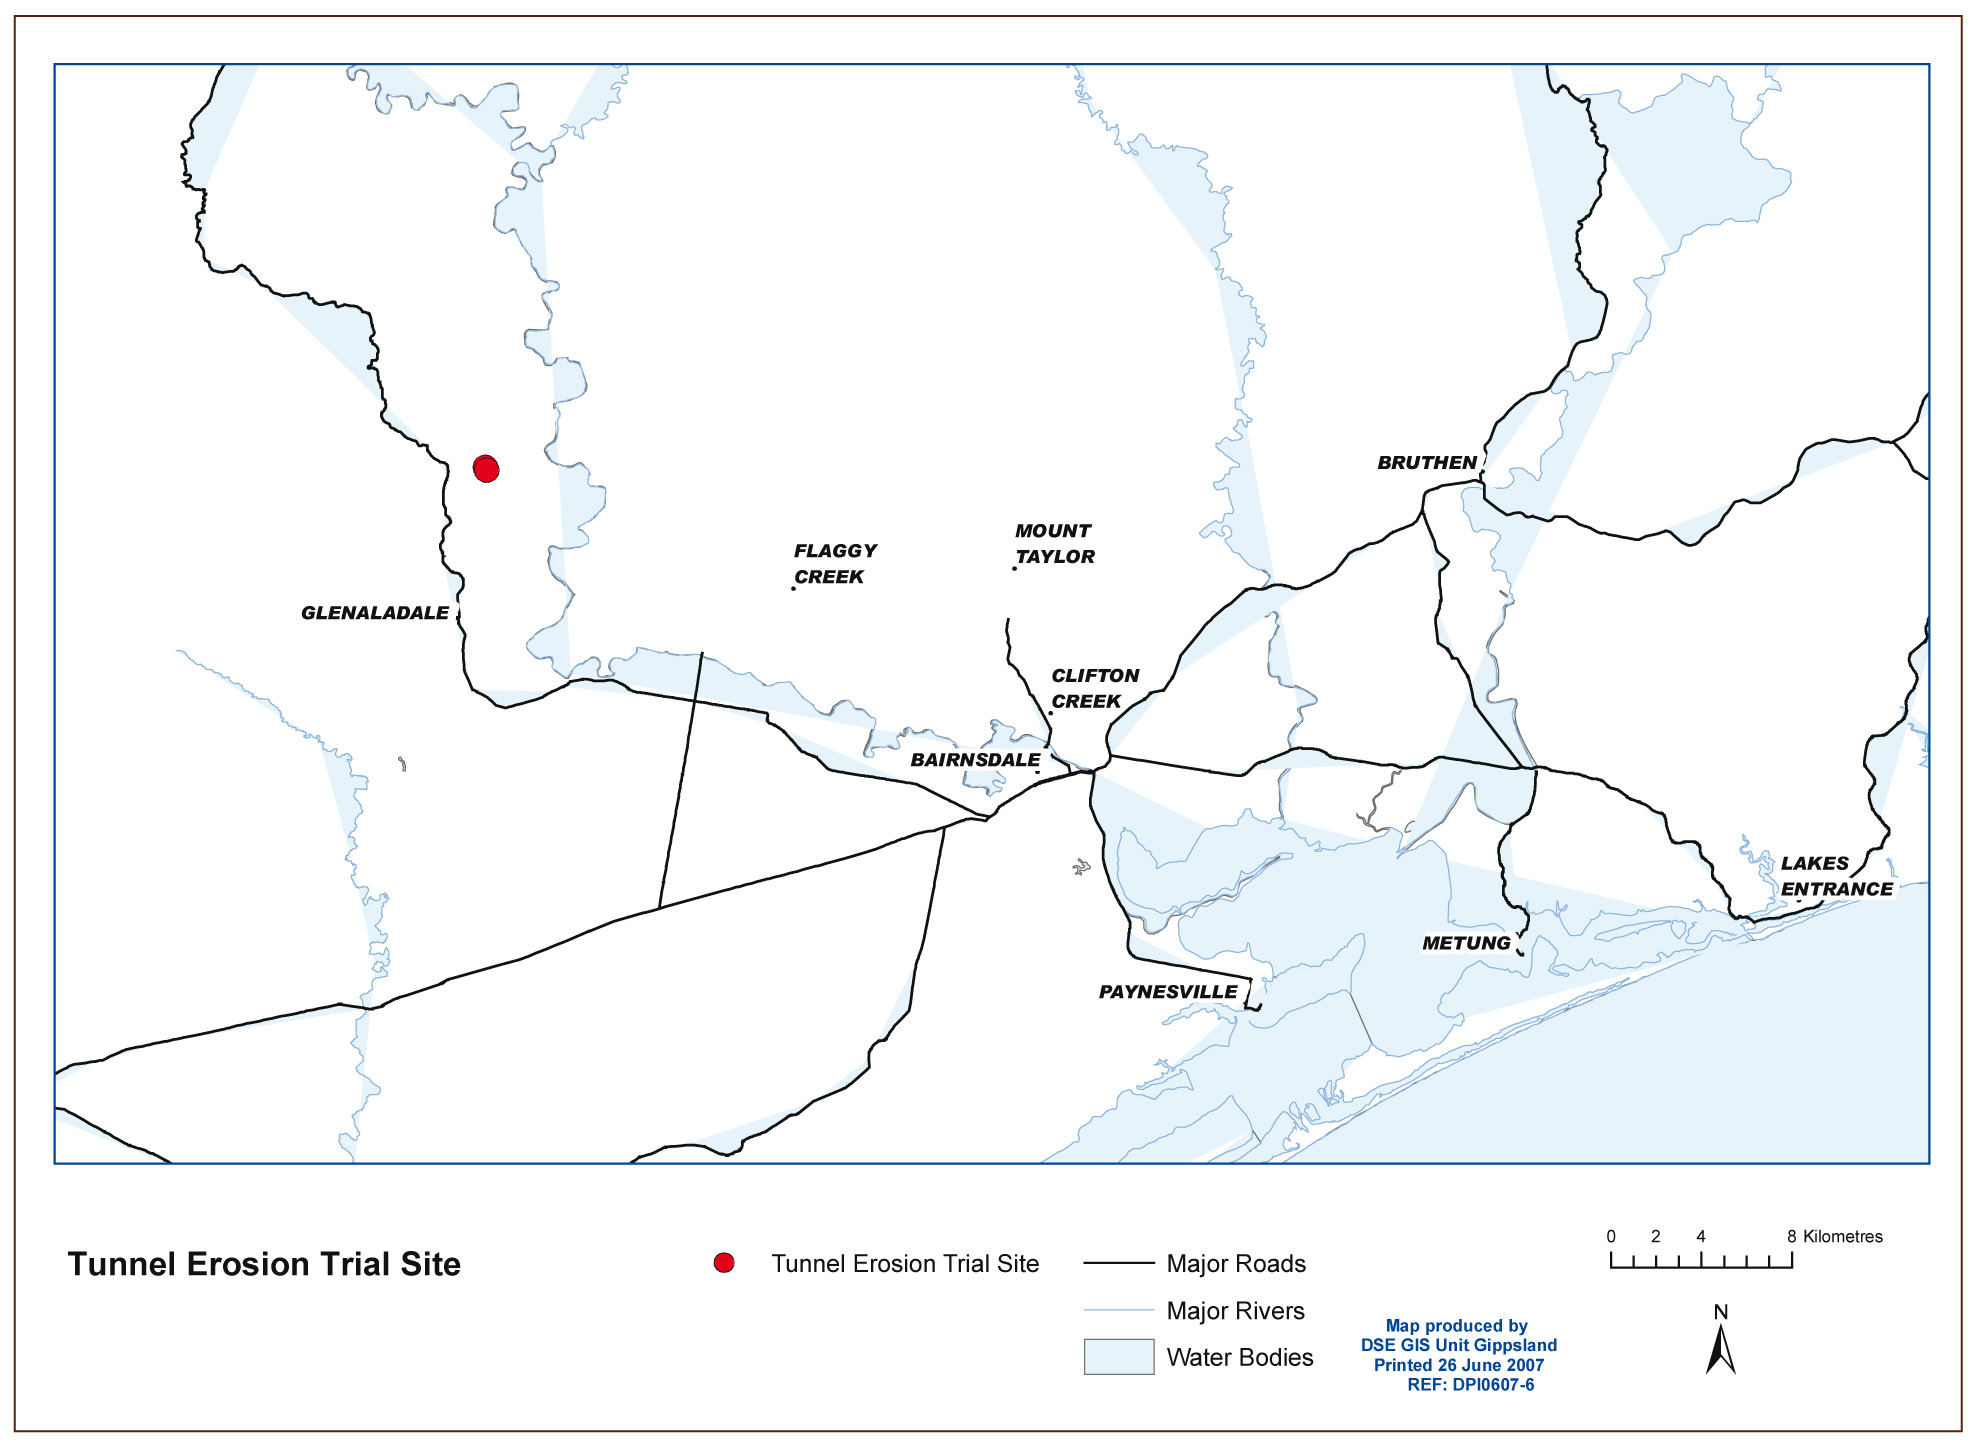 Figure 5: Location of Glenaladale four hectare demonstration site |
Superphosphate was spread in Plots A-D at a rate of 250 kg/ha. A perennial pasture seed mix was used in Plots A-D.
Plot F is the control plot where no treatment was applied.
The timeline of works is shown in Table 2. Three soil pits were excavated (Figure 9) on the property to gather baseline data on the soil’s physical and chemical characteristics (Table 1). In brief, chemical analysis showed that the three soil pits were strongly acidic at the surface, low in fertility, low in calcium and had strongly sodic subsoils. Physical testing demonstrated the soils were highly dispersive, particularly if cultivated when wet.
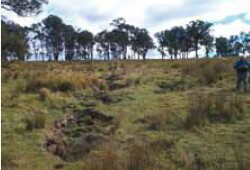
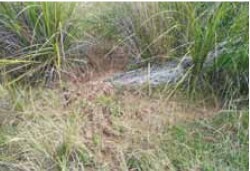
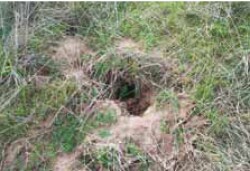
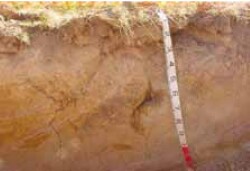
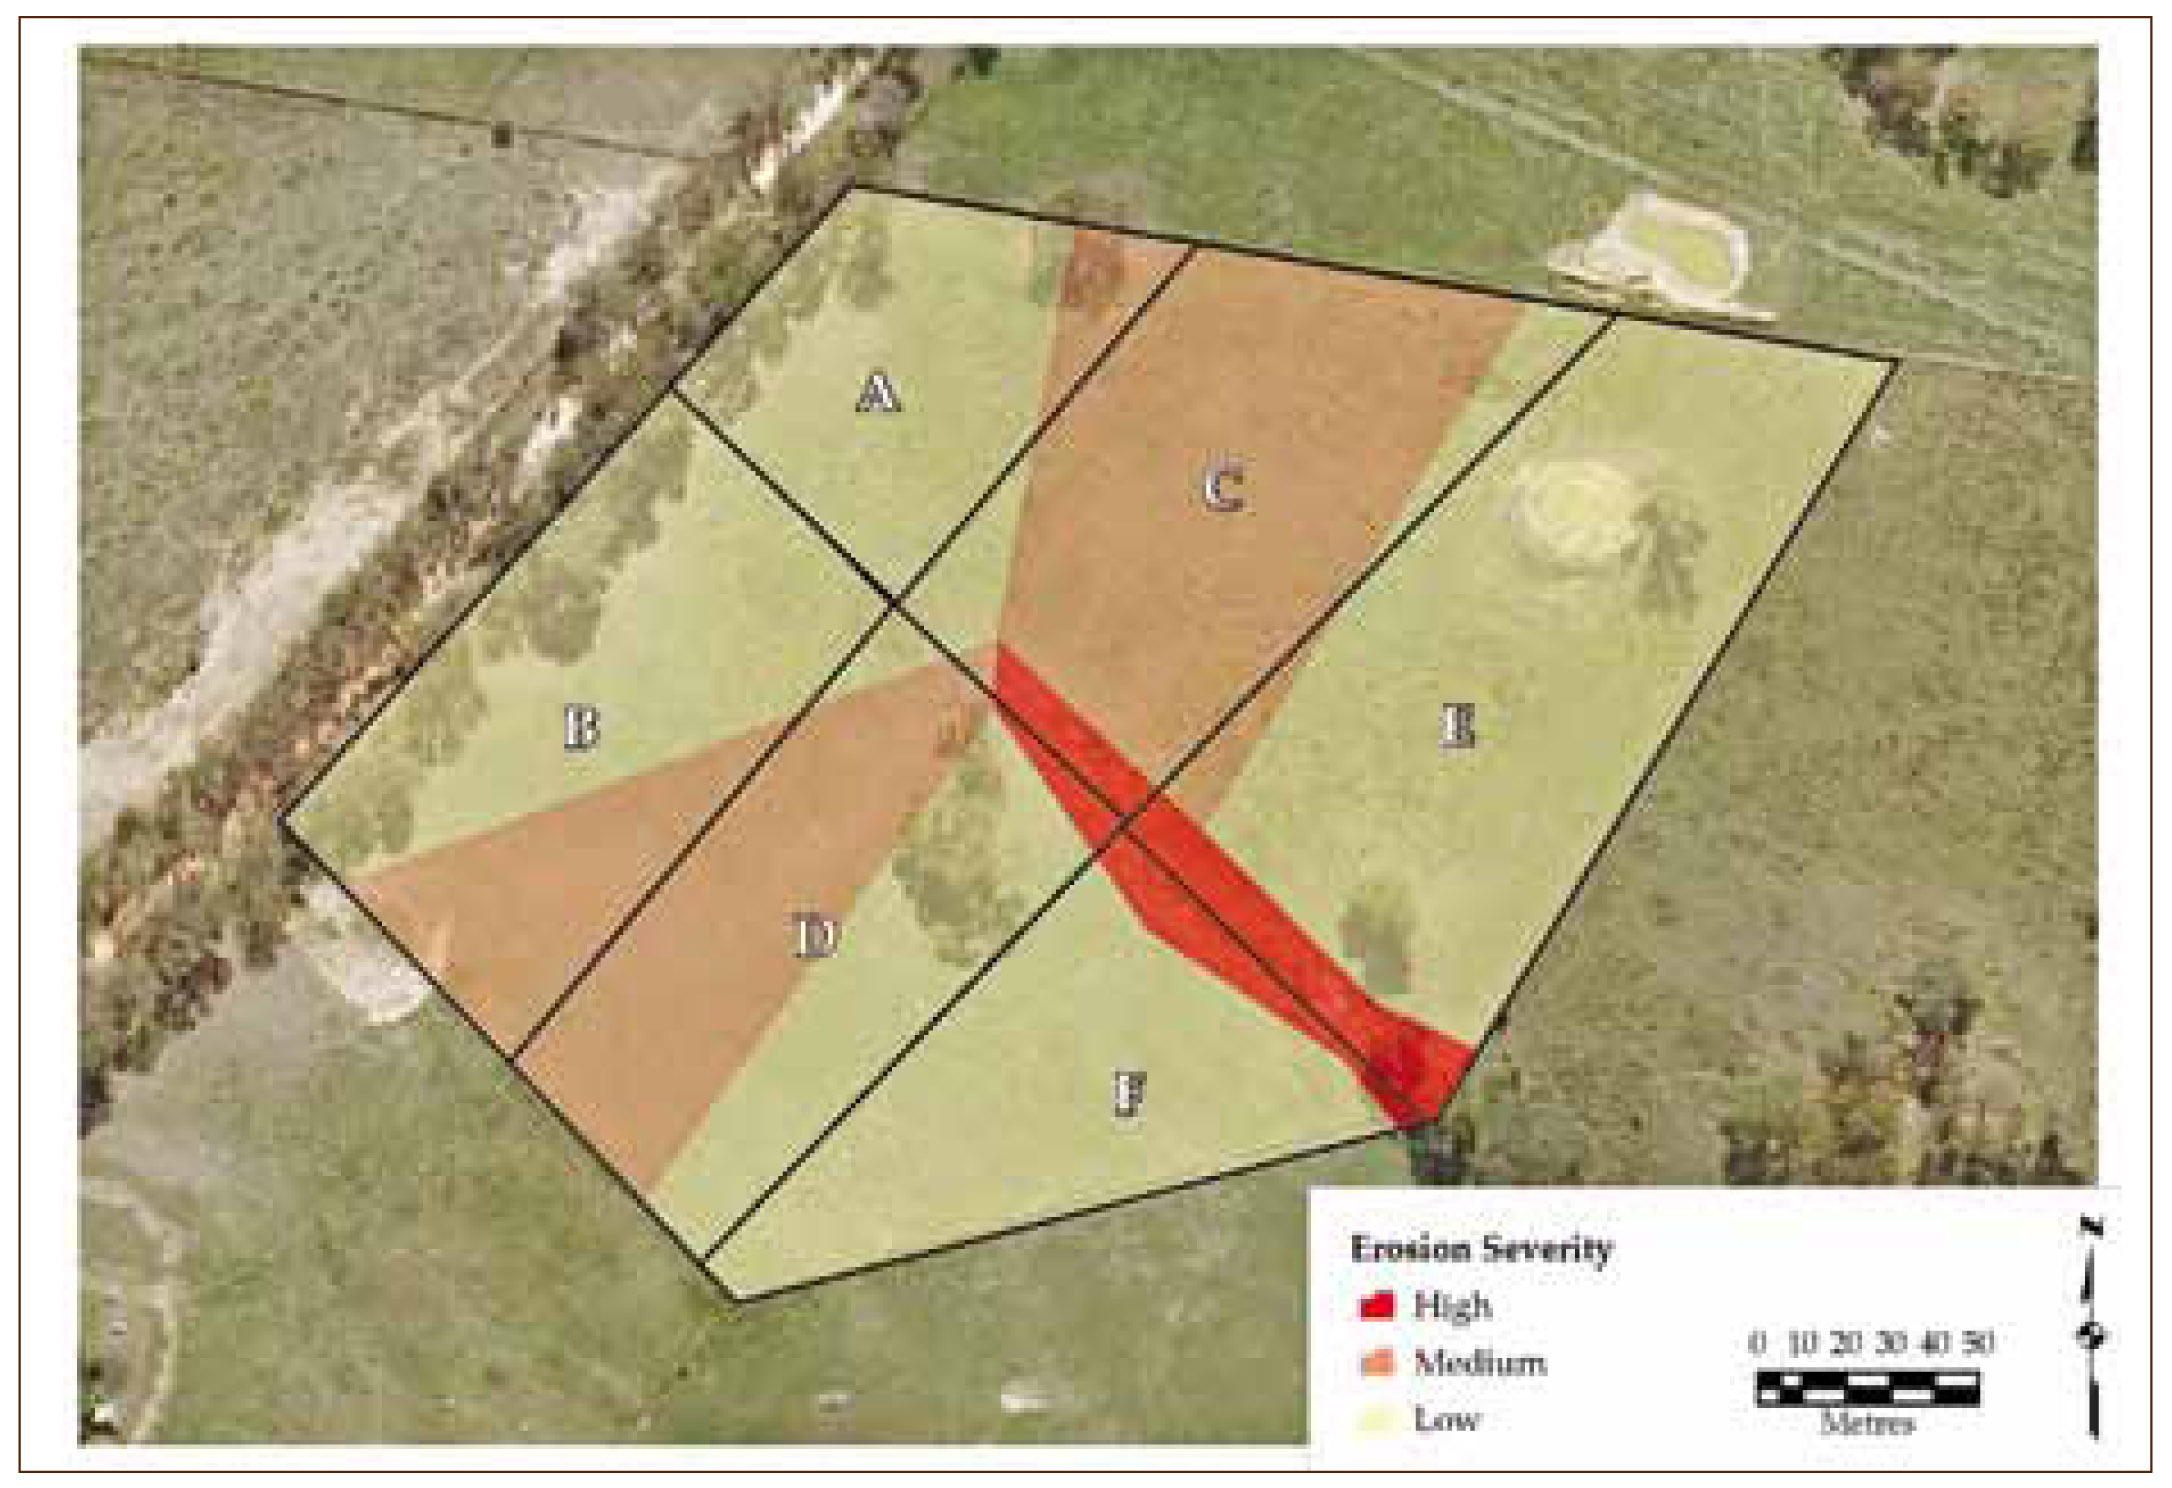 Figure 7: Location of tunnel erosion visible in the demonstration site area and the severity of the erosion | Analysis of variance was conducted to compare these three pits and the demonstration control area (Plot F). There was no statistically significant difference in pH (H2O), exchangeable aluminium or calcium:magnesium ratio. Only one pit showed a slight statistical difference from the control for exchangeable sodium. In other words, there was little variability in the chemistry of the soil across the four areas sampled in this property at the commencement of the demonstration. Nine months after the rehabilitation works were completed an Intact corer (Figure 10) was used to take soil samples to analyse if there were any changes in soil chemistry. The samples were taken as single cores of soil from 0 – 90 cm. Ten cores were taken in each plot and pooled into two main samples for analysis. Chemical and physical analysis was then carried out on samples at 10 cm intervals (i.e. 10, 20, 30 cm etc). Each of the treatment samples were pooled together and analysis was carried out by the State Chemistry Laboratories. The analyses performed were the same as those detailed for the 15 pit sites and mentioned previously in Section 3. All plots were grazed to reduce vegetation and then sprayed with a glyphosate-based herbicide before works commenced. |
Table 1: Baseline data presented as an average of analysis of three soil pits in demonstration site.
ESP% | Ca:Mg ratio | pH H2O | Exch Al mg/kg | CEC (4+cations) cmol (+)/kg | |
| Ave A Horiz 0-25 cm | 5.8 | 1.5 | 5.3 | 86.9 | 2.7 |
| Ave B Horiz 25-70 cm | 12.0 | 0.1 | 5.7 | 208.7 | 9.1 |
| Ave C Horiz 70-140 cm | 15.0 | 0.1 | 7.1 | 20.3 | 10.2 |
A Lime (2t/ha) Ripped both ways Seed Super | C Gypsum (2t/ha) Ripped on contour only Seed Super | E Ripped on contour only |
B Lime (1t/ha) Ripped both ways Seed Super | D Gypsum (1t/ha) Ripped both ways Seed Super | F Control site No treatment |
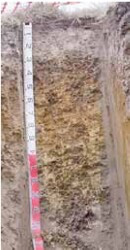
Table 2: Timeline of works for the funnel erosion demonstration site
| Month | Job Description |
| June 2002 | Clean paddock of stumps, logs etc Onsite inspection with contractor |
| July | Mapping of tunnels (some instrument) Visual assessment of tunnels in paddock Start soil and water sampling Spray tussocks (spot spray) |
| October | Spray tussocks (spot spray) |
| January 2003 | Graze area to reduce vegetation Spray areas A-E in paddock with glyphosate |
| March start | Spread gypsum and lime Dozer – 3 days (sites A-E) Pasture renovation |
| March end | AUTUMN BREAK |
| April | Photo monitoring |
| May | Photo monitoring |
| June | Photo monitoring |
| July | Photo monitoring |
| August | Photo monitoring |
| September | Photo monitoring |
| October | Photo monitoring |
| November | Intec Corer sampling |
5.3 Demonstration site soil analyses information
Soil core chemical information relevant to tunnel erosion impacts
The chemical information provided focuses on several soil characteristics that are commonly used to indicate sodic, and potentially tunnel-prone soils: exchangeable sodium, exchangeable calcium, exchangeable magnesium, pH. Aluminium content was also measured as this negatively affects certain pasture species and needed to be taken into consideration using this method of rehabilitation. Two ripping directions were trialled to determine the minimum level of mechanical disturbance required to rehabilitate tunnel erosion affected areas. These treatments were as follows:
- “Contour only” ripping – around the side on the hill on contour
- “Both ways” involved ripping up and down the slope and followed by contour ripping.
 | 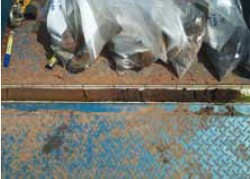 | |
| Figure 10: The intact corer at work (left) and the core sample from plot C showing the sandy subsoil (right) | ||
The standard recommendation for the rehabilitation of tunnel erosion has been to construct stock proof fencing and revegetation with species indigenous to the region, starting from the base of the hill upwards (Waters 2002). However, in East Gippsland when whole farms are affected this advice has not been practical for landholders to implement. Over recent years there has been an increase in size and capabilities of modern machinery that can be used in the rehabilitation process and as a result some of the landholders in the region have had success in rehabilitation with deep ripping and perennial pasture establishment which reduced the off site impacts of the erosion and at the same time improved the productivity of the affected land.
Previous documented trials in NSW using deep ripping and chemical treatment of tunnel erosion that started in 1957 appeared to stop tunnels altogether if crop rotation was used, but tunnels began to appear after 13 years in areas sown to permanent pasture (Floyd 1974). However, the modern machinery (D8) that is now available for use is heavier, and stronger and therefore has a capacity to rip at a more constant depth than machinery used in earlier trials. There has been local success with this technique more recently. It is therefore difficult to compare the results of the mechanical disturbance with earlier work.
The demonstration site aimed to determine the most cost effective methods of rehabilitating tunnel erosion in the East Gippsland area, in particular the Foothills area north of Bairnsdale. The land use history of the region generally was that it was cleared around 100 years ago and has been predominantly used for grazing sheep and cattle over this time. Local landholders who have been farming in this area for generations have reported that tunnel erosion has been active over different periods of time. Some have said that grandfathers lost horse and drays in collapsed erosion as they were walking across the paddocks. These people have observed that there is an increase in erosion activity when long periods of dryness precede a wet period. The demonstration site is a typical example of the Foothill area history, being cleared around the turn of the century. The main type of landuse was the grazing of merino sheep. The current landholders have owned this land for 80 years and observed the tunnel erosion starting to be highly active 60 years ago.
| When sites treated in a similar method by local landholders 10 years ago were inspected there were no signs of erosion redeveloping in the areas treated. Therefore it is with some confidence that the recommendations developed will have a positive effect for the long term success of the rehabilitation of tunnel erosion issues in the Foothills region. Initial soil analysis indicated that to completely ameliorate the soils, 15t/ha of gypsum were needed at the Glenaladale demonstration site (D Crawford, DPI, 2006, pers. com). However, this would have been prohibitively expensive and would have compromised the soil’s productivity, so much less (4t/ha) was used. Soils affected by tunnel erosion are typically duplex soils. That is, soils with three distinct horizons A, B and C. The B horizon is highly dispersive and the C horizon is stable clay and is also often acidic and sodic. All 60 samples considered for this report showed soils were sodic (ESPs of 6-15) or strongly sodic (ESPs of 15+) (Table 1). ESP is calculated as the proportion of the cation exchange capacity occupied by sodium ions and relates to how soil reacts in contact with water. Sodium dominated soils tend to swell on wetting and are likely to be dispersive. Gypsum and lime are conventionally added to sodic soils to replace the exchangeable sodium (and in some cases magnesium) with calcium (Hazelton et al 1992). | 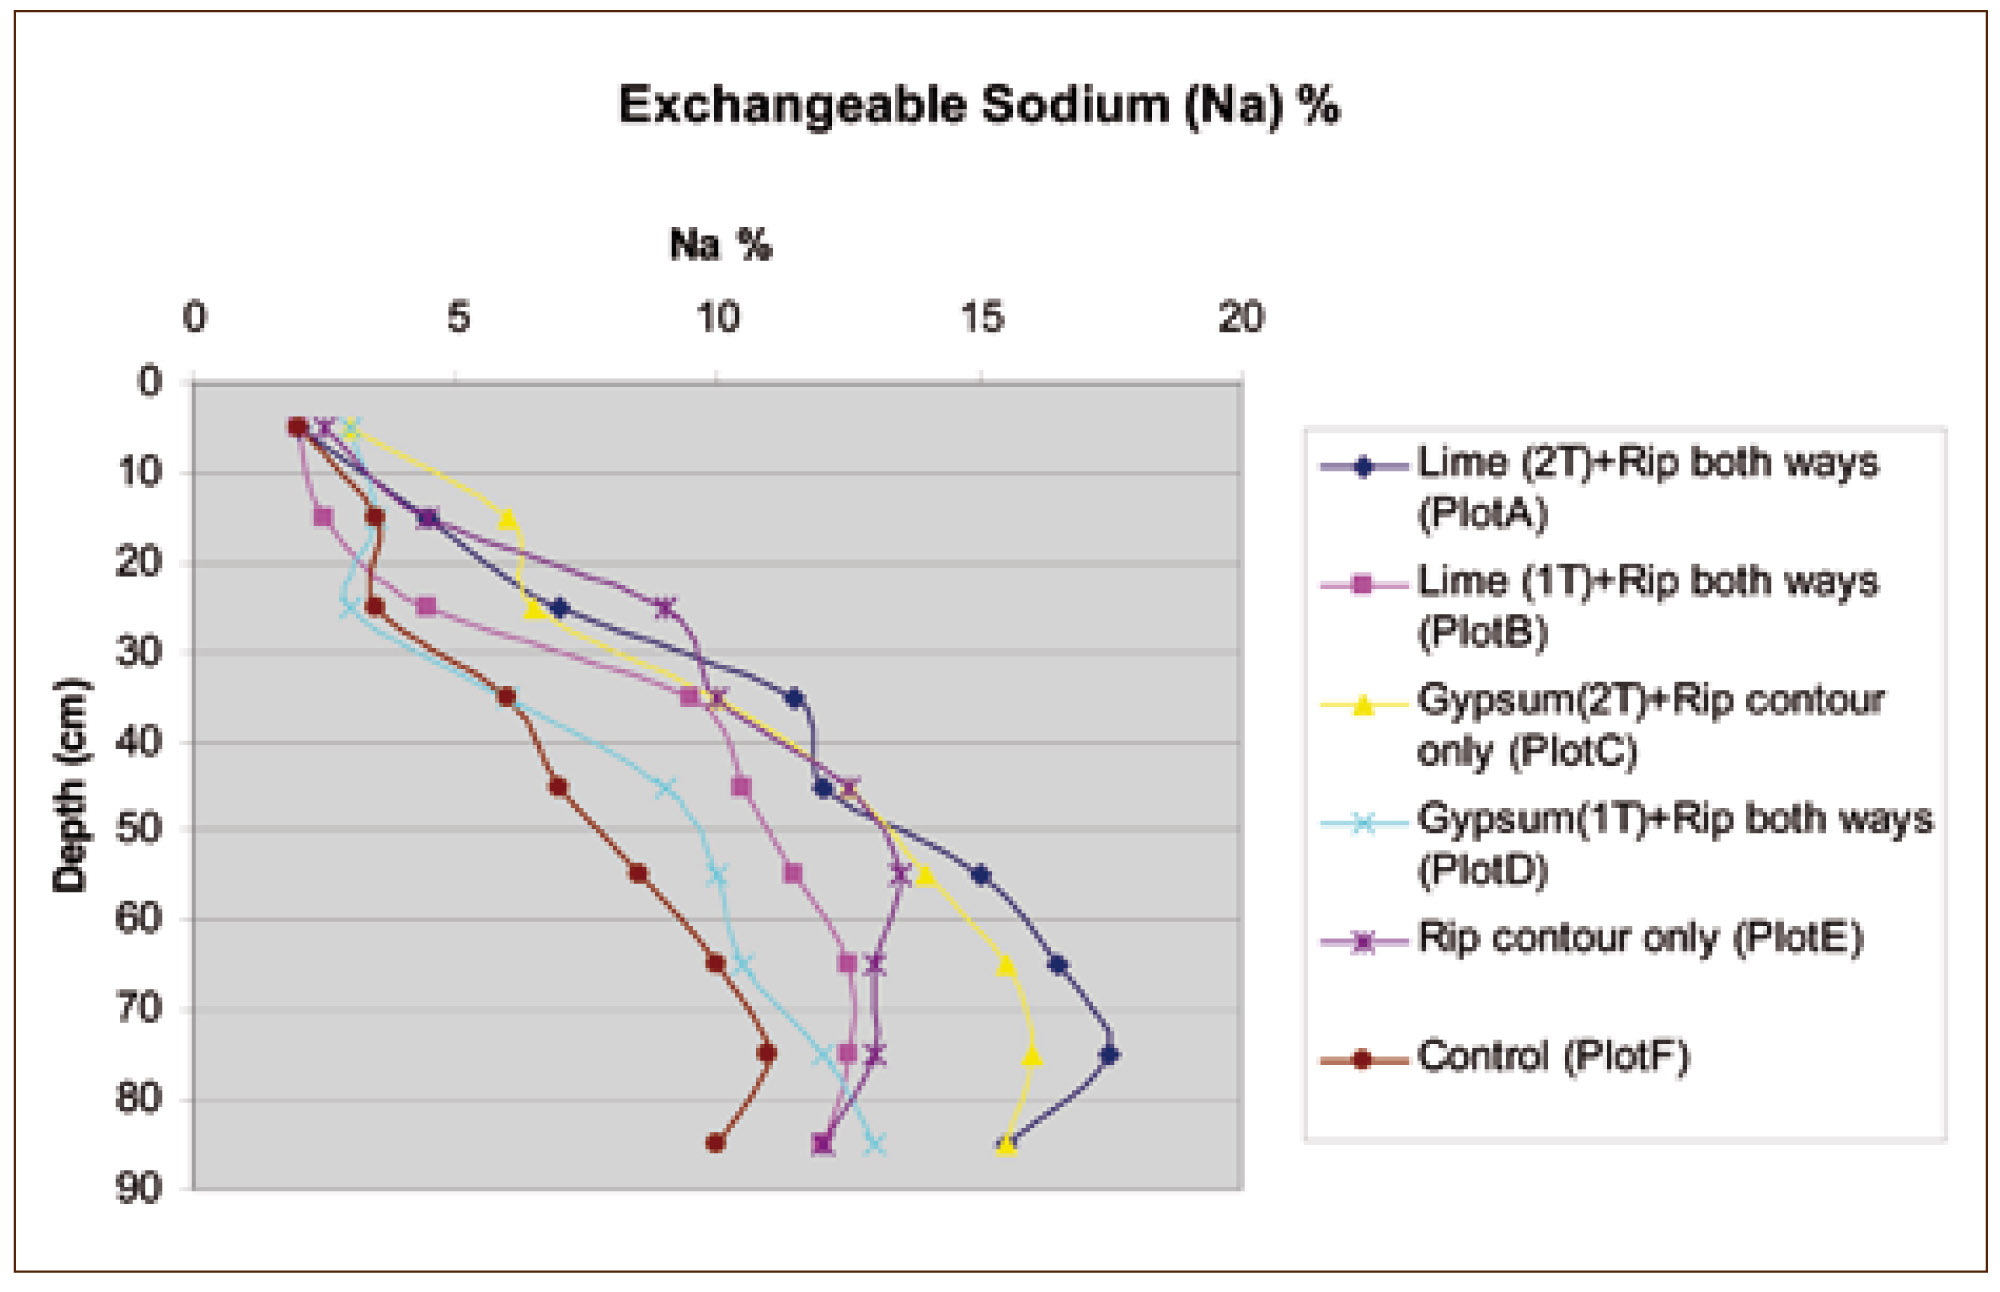 Figure 11: Demonstration site mean exchangeable sodium percentage across treatment plots |
Generally, Exchangeable Calcium (Exch Ca) (Figure 12) in samples from the treatment plots was less compared to the control, except for the 10-20 cm depth in Plot B. Since all treatments, except the treatment applied to Plot E, involved application of calcium containing minerals, it is difficult to conclude that plot differences in Exch Ca are due to ameliorants rather than chance, since it would have been expected that at least in the surface soil samples, i.e. those from the 0-10 cm depth, that the control, Plot F, would have less Exch Ca then the plots treated with lime or gypsum, Plots A, B, C and D, not more.
Exchangeable Magnesium (Exch Mg) (Figure 13) was generally less in all the treatment plots compared with the control, in the 0-30 cm depth.
A possible explanation for these results is that sodium is being displaced by the calcium from the gypsum or lime, resulting in the leaching of sodium from the shallower depths to depths deeper in the soil profile. This typically leads to an increase in Exch Na and a decrease in the Exch Ca in the lower depths of the soil profile (Lines-Kelly, 2000). Exch Mg was also less in the soil samples from top of the soil of the control plot compared to those from the treated plots.
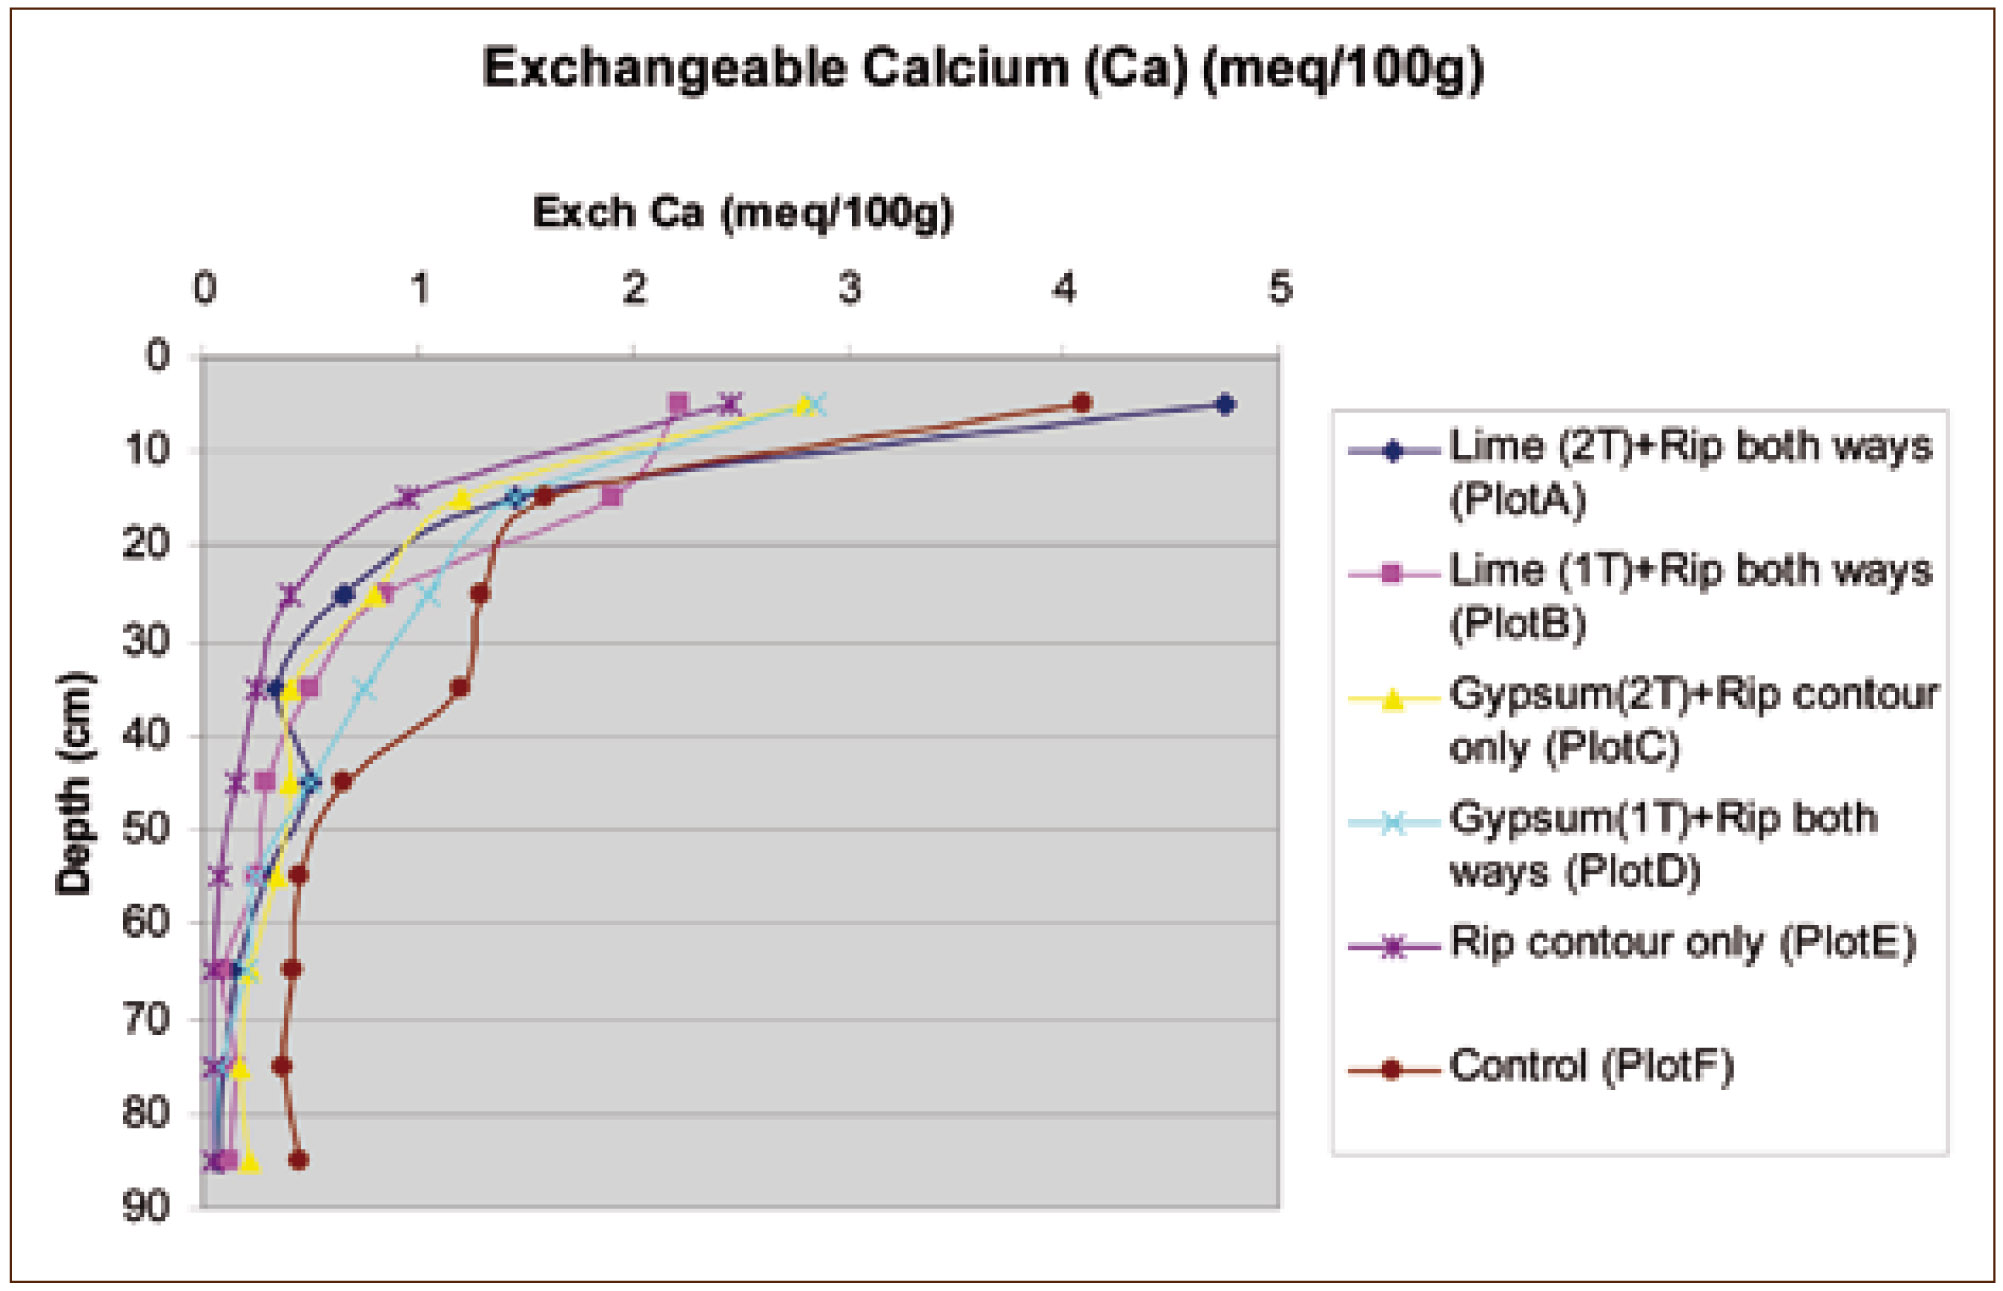 Figure 12: Demonstration site mean calcium content across treatment plots | 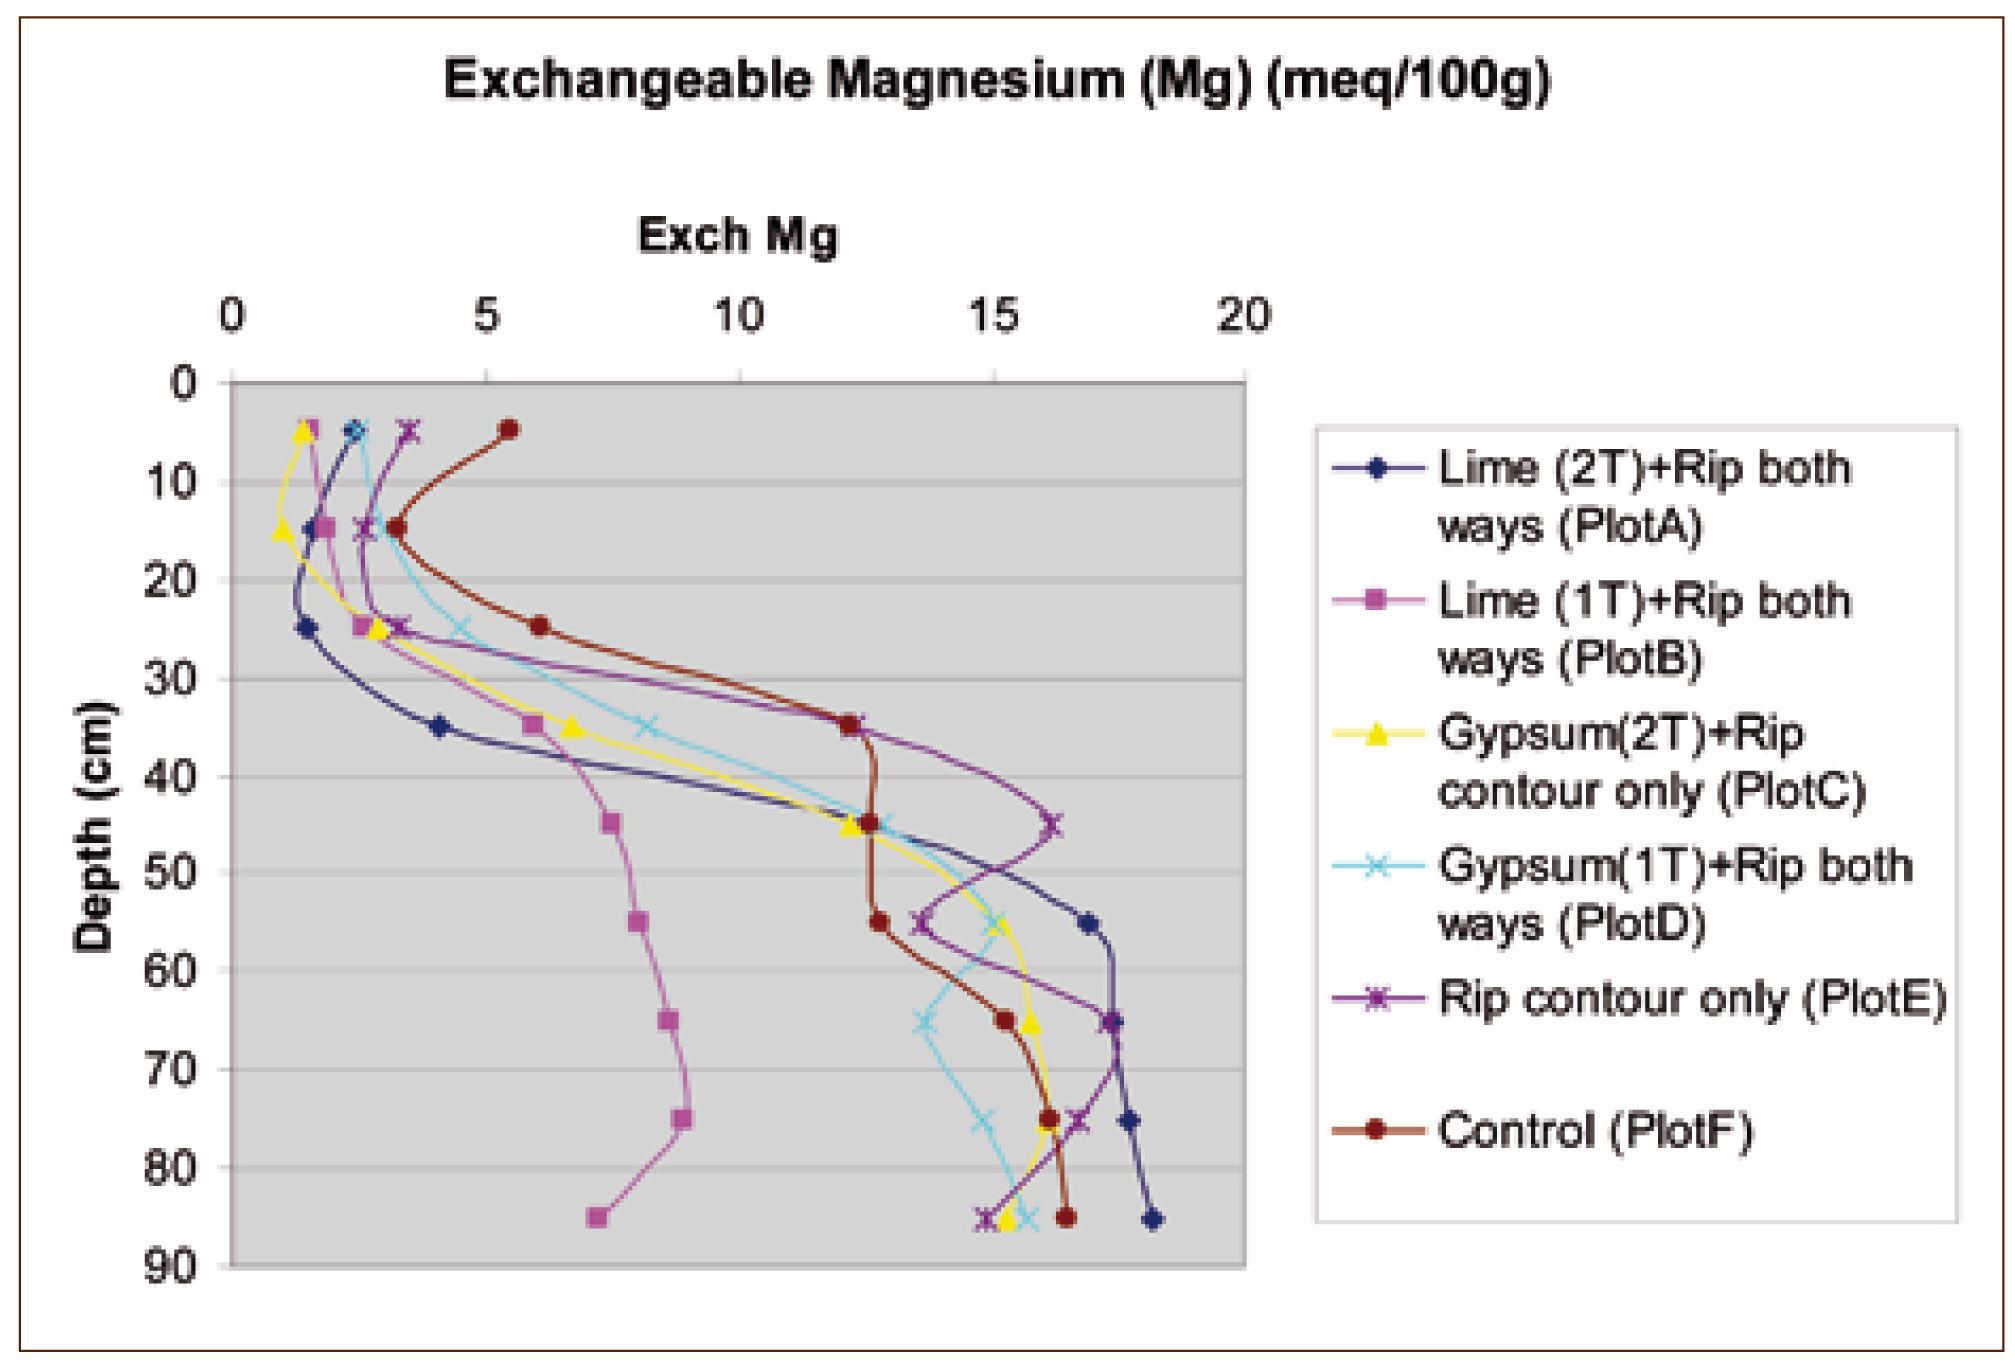 Figure 13: Demonstration site mean Exchangeable Magnesium (Mg) content across treatment plots |
|
|
The reduction of Mg in the profile as a result of this process may negatively affect the productive capacity of the areas treated in the future as it is important for plant nutrition, especially if high concentrations of aluminium in the soil solution of acidic sub-soil prevent plant roots reaching cation nutrients in the sub-soil. Other elements such as potassium may also be impacted and on-going soil testing should be undertaken by farmers in the future to monitor these nutrients (Peverill et al., 2001).
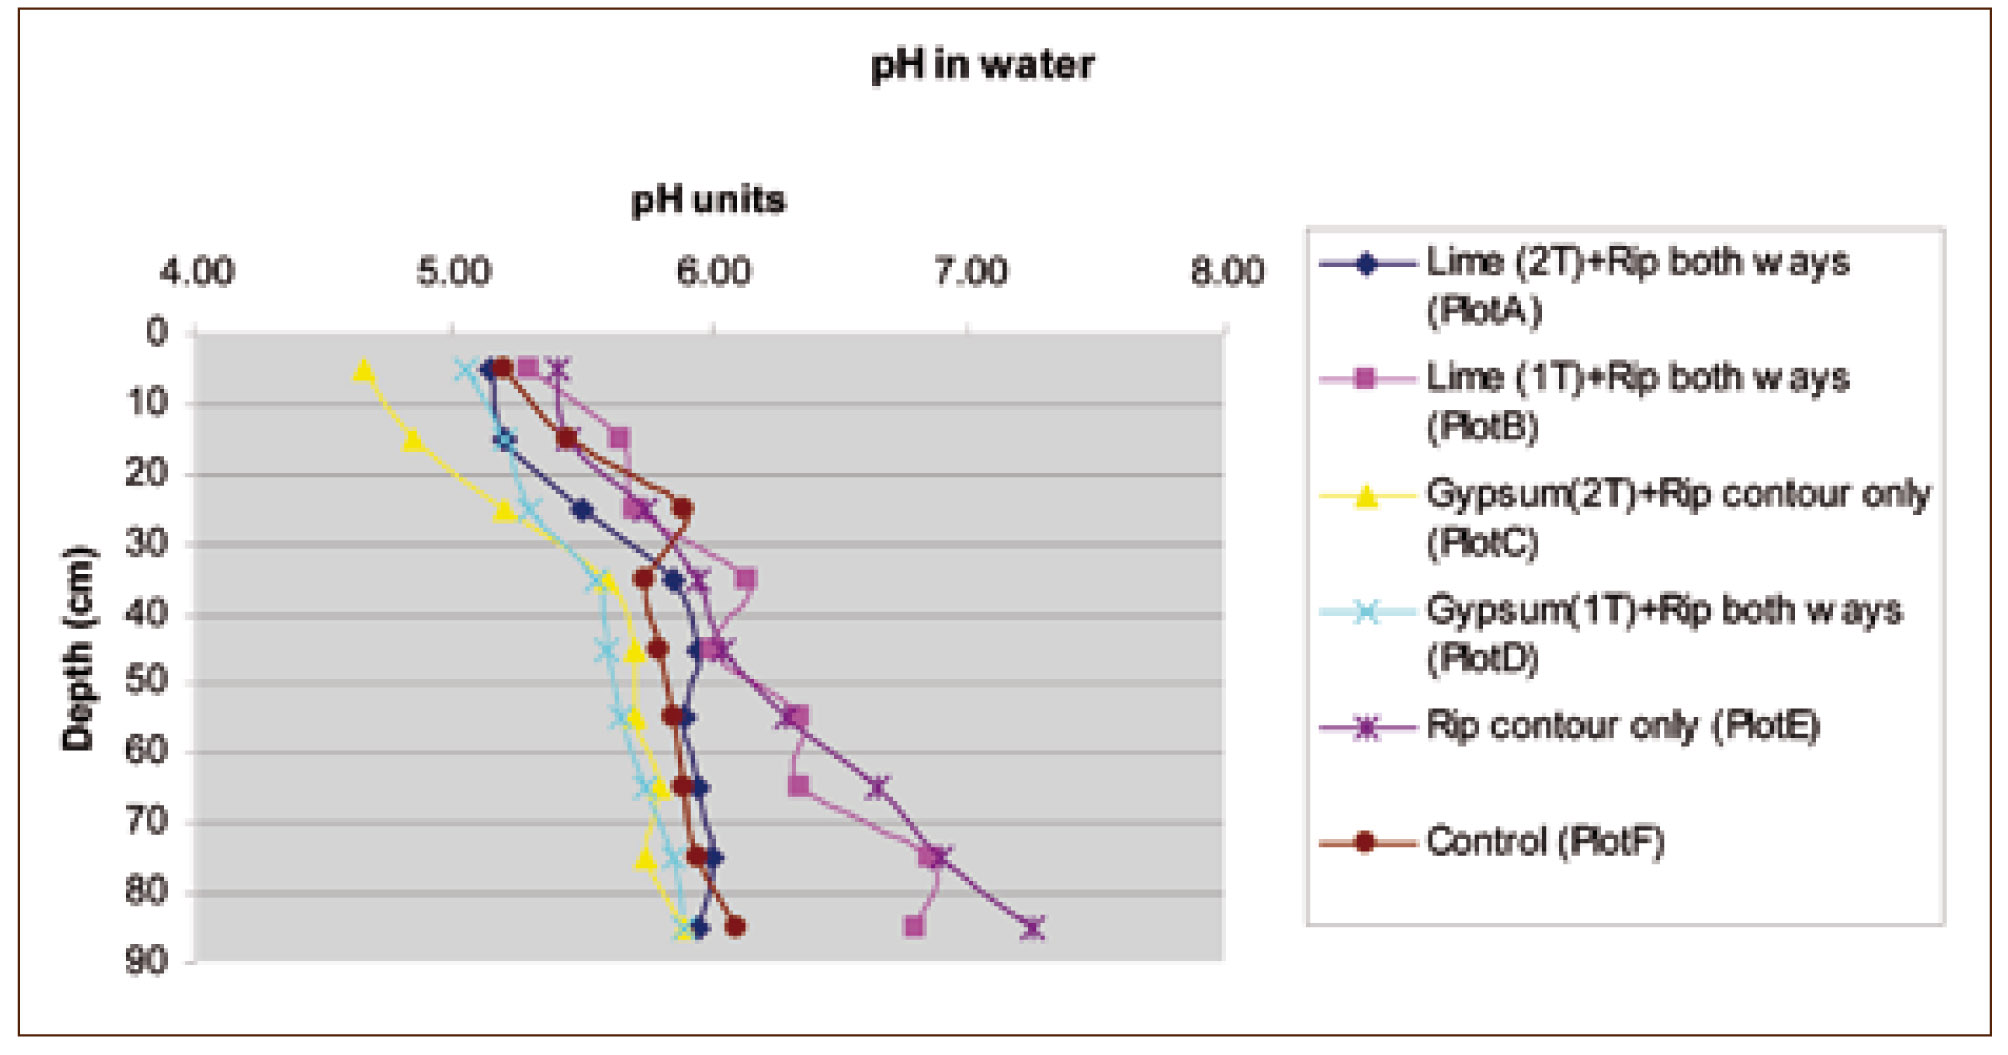
The pH (water) results from the samples representing the different plots (Figure 14) were unhelpful in demonstrating treatment impacts on soil as there are no clear differences in pH (water) in relation to the presence or absence of applied lime. As gypsum is a salt, and slight increases in soil salinity can slightly decrease test results based pH (water), differences between plots treated with gypsum and the control may in part be confounded by this salt affect.
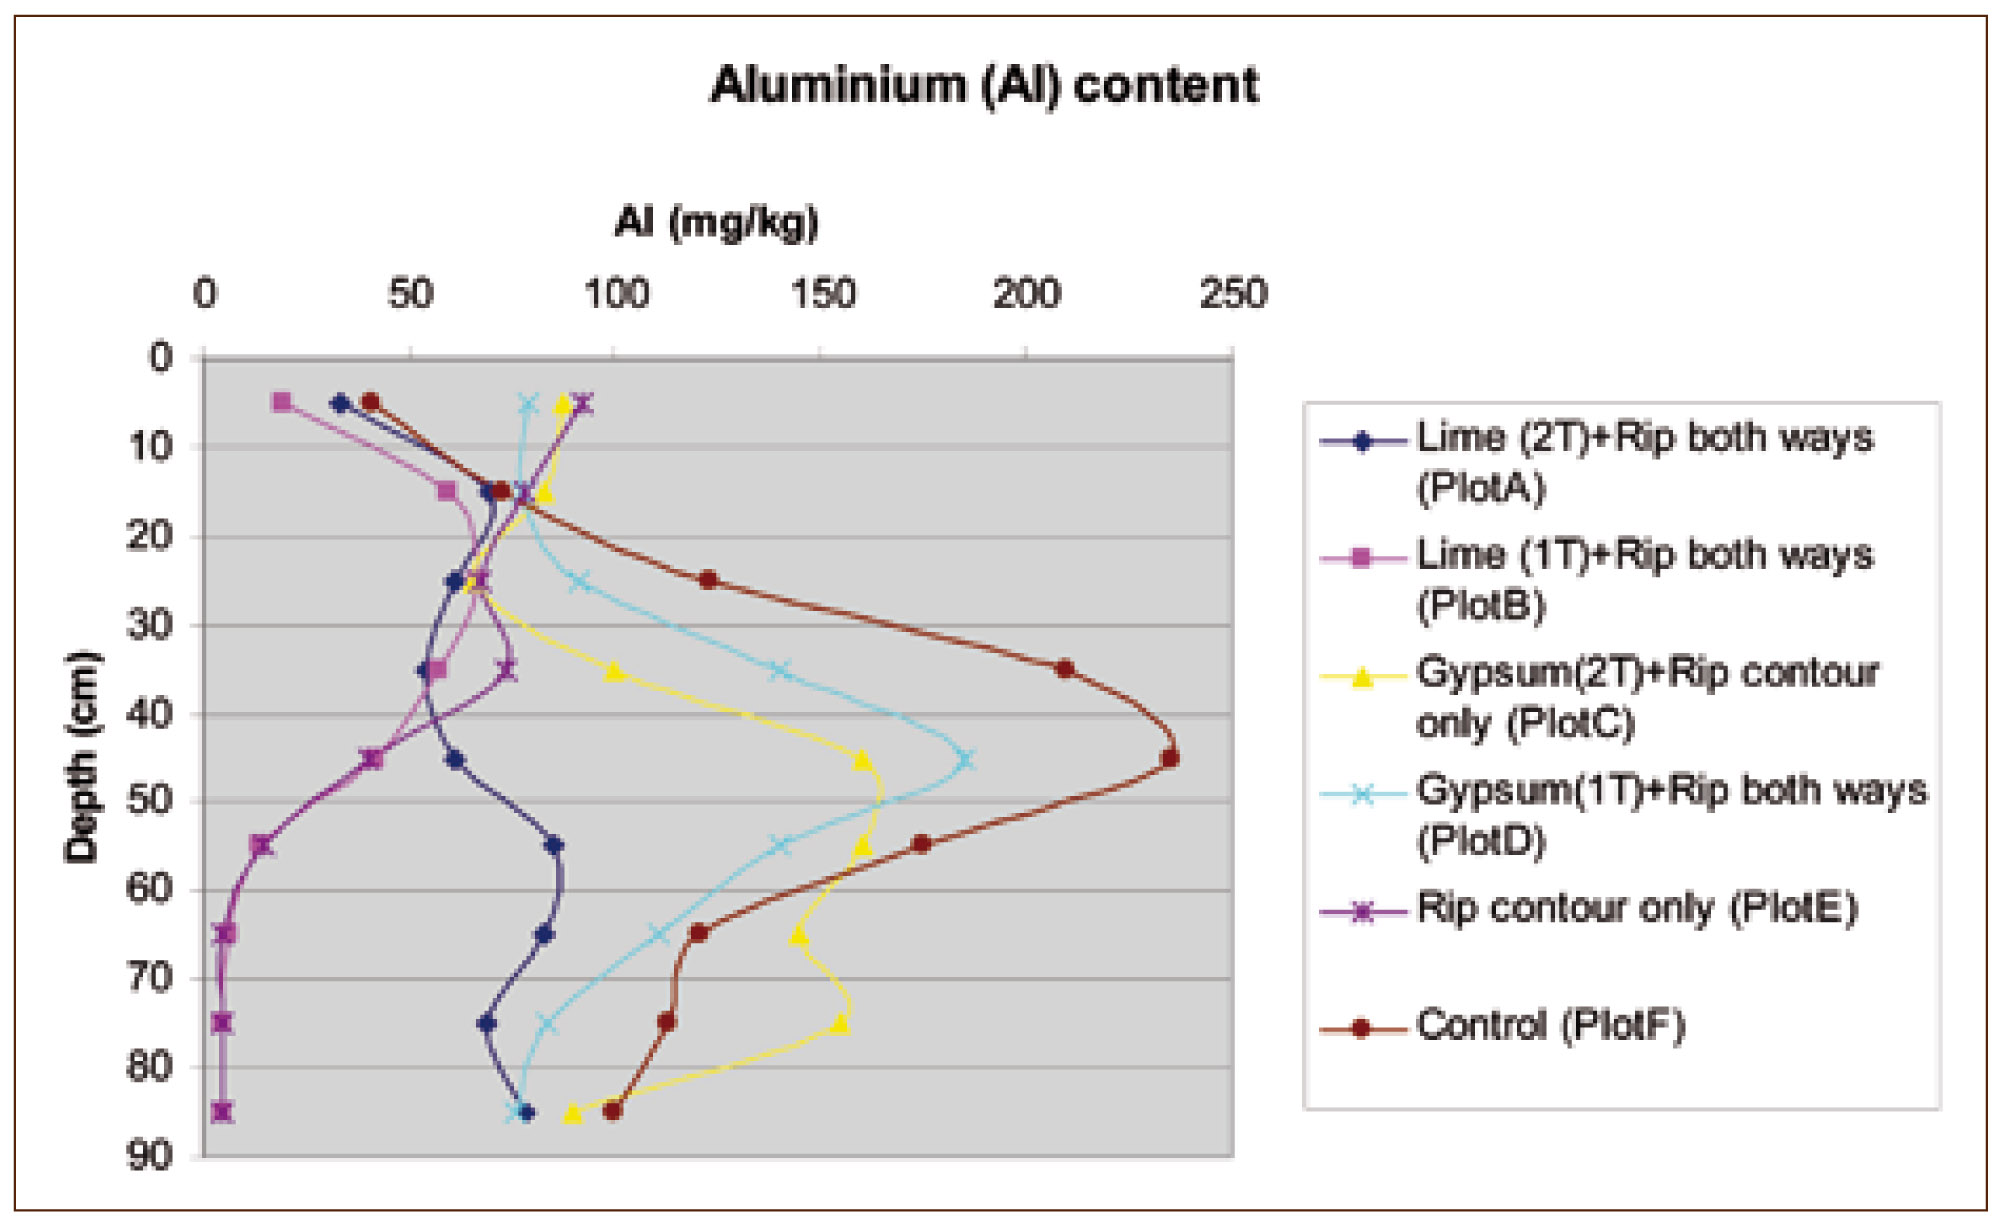
The extractable aluminium (Figure 15) in the surface soil samples (0-20 cm depth) of the lime treated plots was lower compared to the other plots. This result is important as soluble aluminium is toxic to some plants and aluminium becomes increasingly available as acidity increases below pH (water) 6.0, and particularly below pH (water) 5.5.
As the rehabilitation method uses perennial pasture establishment as part of the rehabilitation process, toxic concentrations of aluminium in the soil solutions of sub-soils, as indicated by extractable aluminium values > 50 mg/kg, impacts on the choice of pasture species that are able to be planted after earthworks are completed. However, this did not appear to reduce the establishment of pasture on the demonstration site (Figure 16).
Figure 16: Monitoring photographic pints of demonstrate site
 April 2003 after ripping treatments completed and pasture sown |  May 2003 one month after rehabilitation completed | |
|
|
|
|
|
Dispersion and slaking information
The response of soil to water was examined using soil tests for slaking and dispersion. Slaking is the breakdown of soil aggregates into smaller sized micro-aggregates when immersed in water. Soil is ranked as stable or showing partial or considerable slaking. Dispersion is tested by using two methods. The first involves placing a small dry soil aggregate in distilled or rain water. In the second test, the effect of cultivation on a moist soil is simulated by remoulding soil and placing it in water. In both tests if the soil is dispersive a cloud of clay sized particles will usually form around the aggregate. A visual assessment of the amount of dispersion is made at two hours and twenty four hours (Leeper and Uren 1993).
Overall the dispersion tests (Table 3) indicated that the treatments applied to the areas when compared to the untreated (control) areas in the top 20 cm was marginally changed in Plots D and E to more dispersiveness. This is to be expected as a result of the ripping bringing highly dispersive sub soil to the surface. Below 20 cm there maybe some indication in the gypsum treatments that there was a reduction of dispersiveness (i.e. went from strong to moderate and slight or strong to moderate in description).
Table 3: Dispersion information for demonstrate site plots
| Depth (cm) | Plot A lime (2T)+ contour and up and down ripping | Plot B lime(1T)+ contour and up and down ripping | Plot C gypsum (2T) contour and up and down ripping | Plot D gypsum(1T)+ contour and up and down ripping | Plot E contour rip only | Plot F control |
| 0-10 | Nil (2 hours), Nil (20 hours) | Nil (2 hours), Slight (20 hours) | Nil (2 hours), Nil (20 hours) | Minimal aggregation | Minimal aggregation | Nil (2 hours), Slight (20 hours) |
| 10-20 | Nil (2 hours), Slight (20 hours) | Slight (2 hours), Moderate (20 hours) | Nil (2 hours), Slight (20 hours) | Nil (2 hours), Slight (20 hours) | Slight (2 hours), Moderate (20 hours) | Strong (2 hours), Strong (20 hours) |
| 20-30 | Strong (2 hours), Strong (20 hours) | Strong (2 hours), Strong (20 hours) | Slight (2 hours), Slight (20 hours) | Moderate (2 hours), Moderate (20 hours) | Strong (2 hours), Strong (20 hours) | Strong (2 hours), Complete (20 hours) |
| 30-40 | Complete (2 hours), Complete (20 hours) | Strong (2 hours), Complete (20 hours) | Strong (2 hours), Complete (20 hours) | Strong (2 hours), Complete (20 hours) | Complete (2 hours), Complete (20 hours) | Strong (2 hours), Complete (20 hours) |
| 40-50 | Strong (2 hours), Complete (20 hours) | Complete (2 hours), Complete (20 hours) | Strong (2 hours), Complete (20 hours) | Strong (2 hours), Complete (20 hours) | Strong (2 hours), Complete (20 hours) | Strong (2 hours), Complete (20 hours) |
| 50-60 | Strong (2 hours), Complete (20 hours) | Strong (2 hours), Complete (20 hours) | Complete (2 hours), Complete (20 hours) | Strong (2 hours), Complete (20 hours) | Strong (2 hours), Complete (20 hours) | Strong (2 hours), Complete (20 hours) |
| 60-70 | Strong (2 hours), Complete (20 hours) | Strong (2 hours), Complete (20 hours) | Complete (2 hours), Complete (20 hours) | Moderate (2 hours), Strong (20 hours) | Strong (2 hours), Complete (20 hours) | Strong (2 hours), Complete (20 hours) |
| 70-80 | Strong (2 hours), Complete (20 hours) | Strong (2 hours), Complete (20 hours) | Strong (2 hours), Complete (20 hours) | Strong (2 hours), Complete (20 hours) | Strong (2 hours), Complete (20 hours) | Strong (2 hours), Complete (20 hours) |
| 80+ | Strong (2 hours), Complete (20 hours) | Strong (2 hours), Complete (20 hours) | Nil (2 hours), Slight (20 hours) | Strong (2 hours), Complete (20 hours) | Strong (2 hours), Complete (20 hours) | Strong (2 hours), Complete (20 hours) |
Dispersion tests (Table 3) using dry and remoulded soil aggregates provide useful information. From a practical perspective they give landholders information about how their soil will react when wet. For example, marked dispersion using remoulded aggregates indicates soils should not be cultivated when wet. However, in this project any results should be treated with extreme caution as these dispersion tests involve a visual assessment and are, therefore, subjective and cannot be quantified exactly.
The slaking tests (Table 4) indicated that ripping brought highly slakable soils to the surface, increasing the slaking in the top 10 cm of the soil. Below 10 cm there was large variability across the different treatments and trends are difficult to determine. Slaking differences may be more discernible over longer periods of time.
Table 4: Slaking information for demonstration plots
| Depth (cm) | Plot A lime (2T) + contour and up and down ripping | Plot B lime (1T)+ contour and up and down ripping | Plot C gypsum (2T) and contour ripping | Plot D gypsum (1T) + contour and up and down ripping | Plot E contour rip only | Plot F control |
| 0-10 | Water stable | Partial | Water stable | Water stable | Minimal aggregation | Water stable |
| 10-20 | Water stable | Partial | Water stable | Water stable | Water stable | Partial |
| 20-30 | Water stable | Partial | Considerable | Partial | Partial | Partial |
| 30-40 | Partial | Partial | Considerable | Partial | Considerable | Partial |
| 40-50 | Considerable | Partial | Considerable | Partial | Considerable | Considerable |
| 50-60 | Considerable | Partial | Considerable | Partial | Considerable | Partial |
| 60-70 | Partial | Partial | Considerable | Considerable | Considerable | Partial |
| 70-80 | Considerable | Considerable | Considerable | Considerable | Partial | Considerable |
| 80+ | Partial | Considerable | Partial | Considerable | Partial | Considerable |
| 6. Regional soil pit information 6.1 Investigation of soil types throughout the Bairnsdale region Fifteen soil pits across the Bairnsdale region (Figure 17) in 10 different areas were sampled and the same chemical analyses was performed as for the demonstration site. These pits were excavated to investigate if there were any differences chemically in the soils susceptible to erosion in the area. The parameters compared in this section related to those important in the tunnel erosion process and were the same as those detailed for the demonstration site. The results have been presented in two ways: firstly as graphs summarising the major chemical analyses in the 10 geographic areas sampled; secondly the individual pit chemical results and a corresponding photo (Tables 5 to 17) to illustrate differences in soil chemistry at different depths of the soil profiles across the sampling area. A detailed set of results from these soil pits is included in Appendix one. Statistical analysis was not able to be performed on these results as only one pit was excavated at each location. | 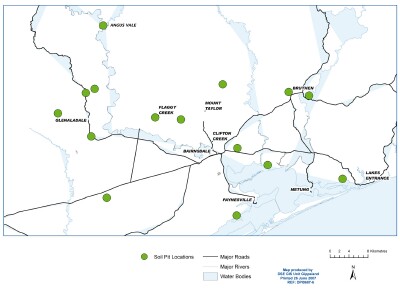 Figure 17: Map of the location of the 15 soil pits across the region |
| Exchangeable sodium percentage (ESP) As discussed earlier high ESP soils are sodic and are generally sodium dominated clays that have a tendency to swell on wetting. They are also are likely to be dispersive which means the soils are structurally unstable and disperse in water into their basic particles i.e. sand, silt and clay. The fine clay particles that dispersed clog up the small pores in the soil, degrading soil structure and restricting root growth and water movement (Sargeant I and Sargant J 2005). As the majority of soils in the region (9 out of 10 geographic areas) sampled were sodic this had implications for potential impact of erosion for the whole region. All but one soil pit had an ESP % of above eight. This means that nine areas in the region have sodic soils present. Sodic soils are likely to be dispersive and are also structurally unstable and therefore when coming in contact with water break down into their basic soil particles (Sargeant I and Sargant J 2005). Angus Vale was the only location that did not have sodic soils present based on this definition (Figure 18). | 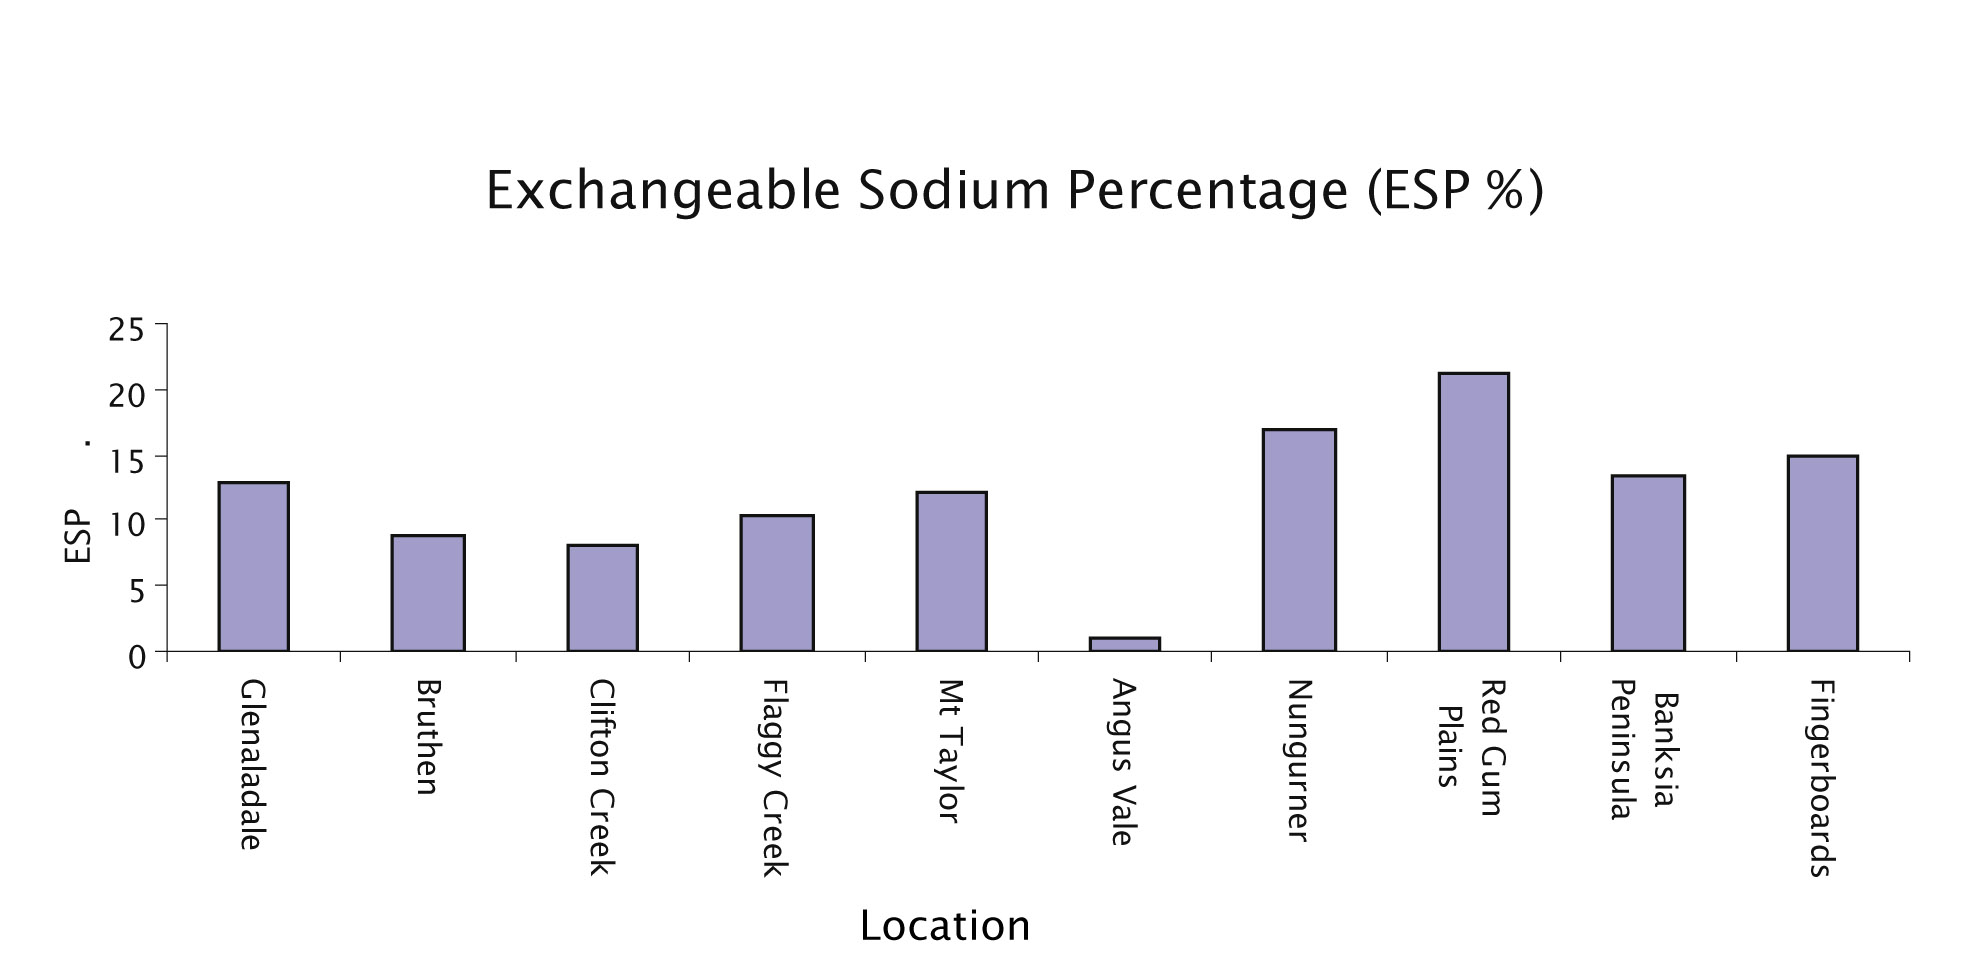 |
Calcium:Magnesium ratio | 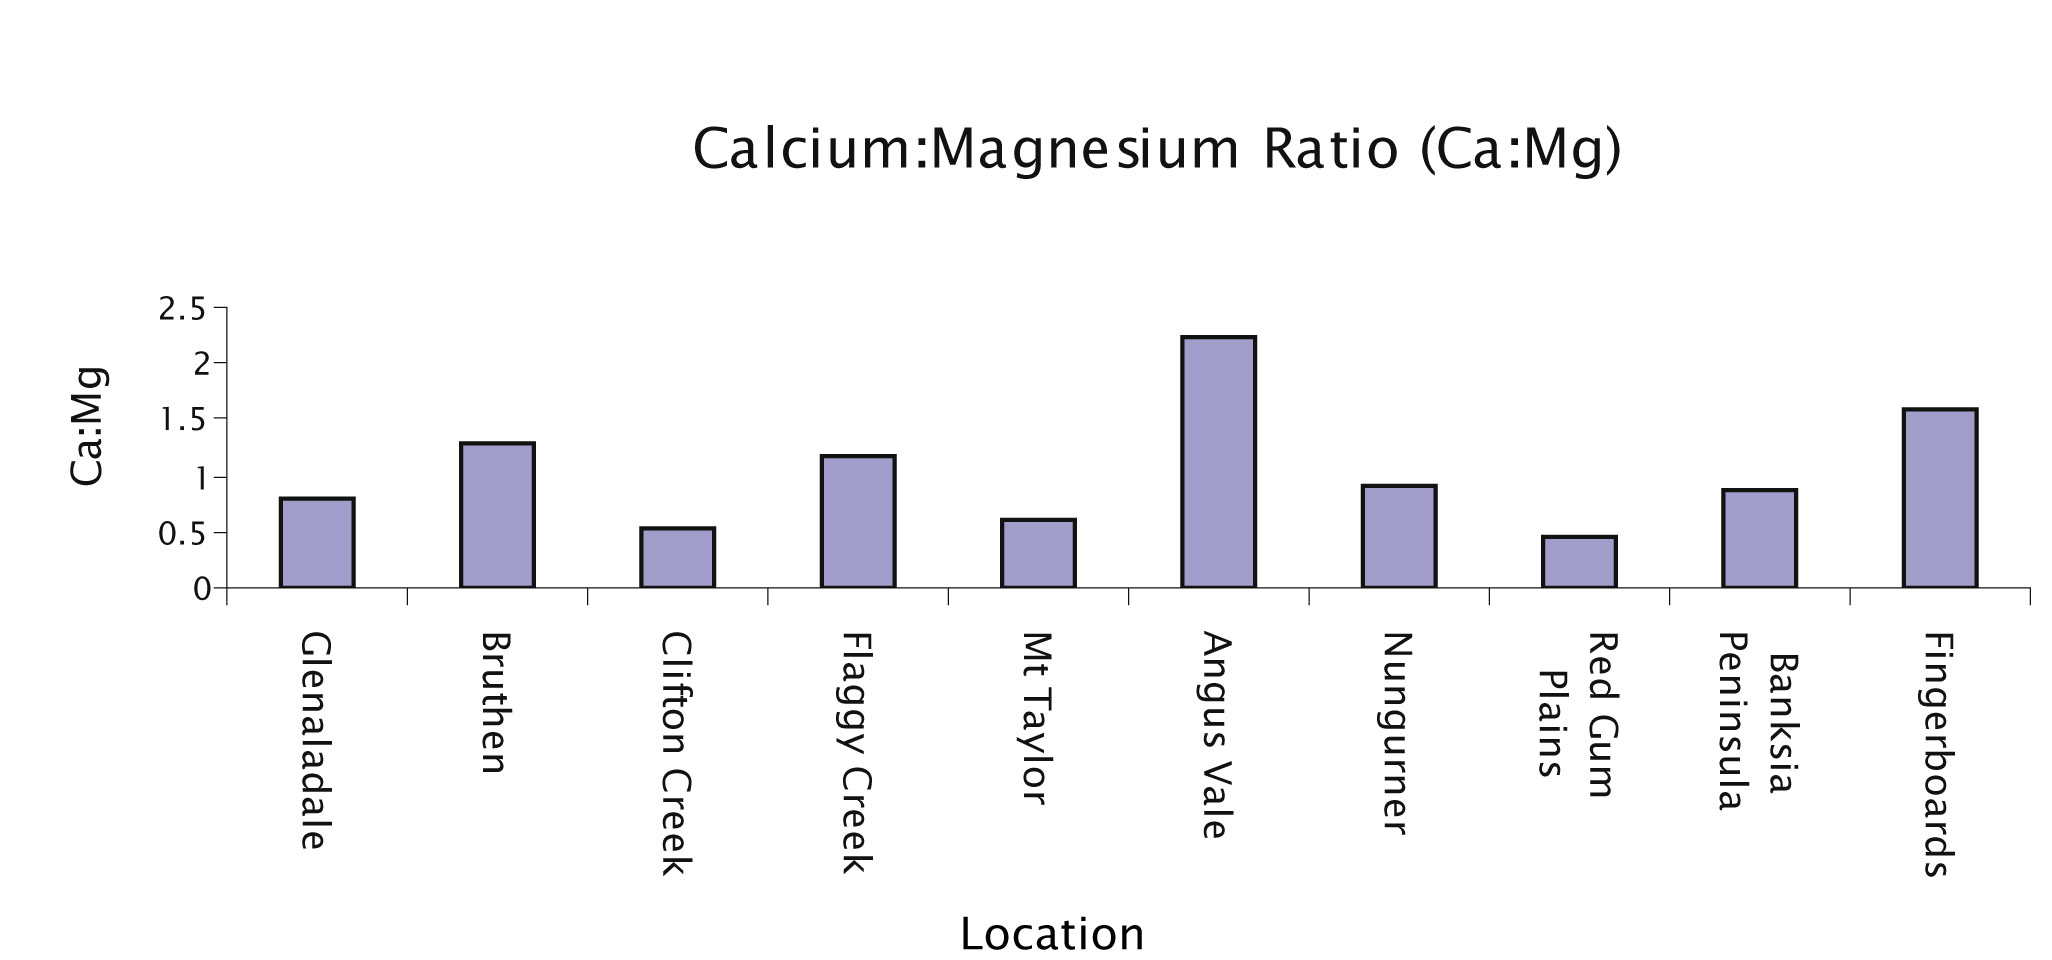 Figure 19: Mean Clacium:Magnesium ratio results for the whole soil profile across the 15 soil pit sites sampled in the Bairnsdale region |
pH water | 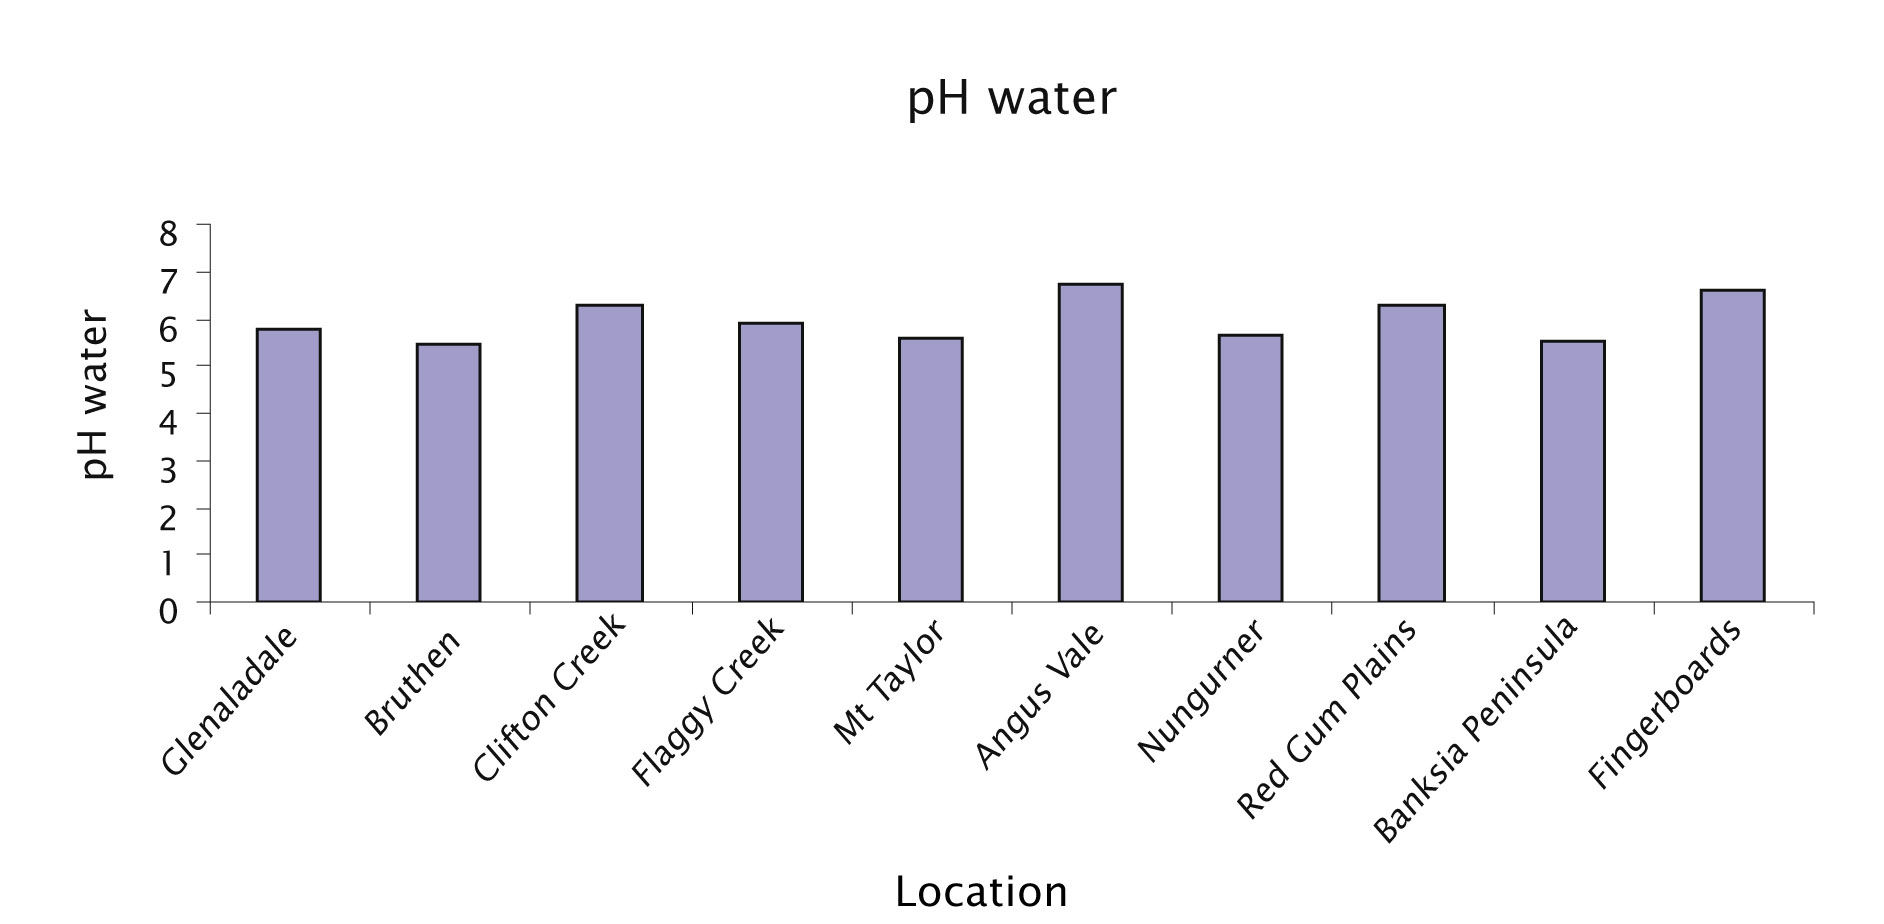 Figure 20: Mean pH in water results for the whole soil profile across the 15 soil pit sites sampled in the Bairnsdale region |
| Overall the pH of these soils is within the ranges that are conducive to plant growth (between 5.5 and 8.0). The samples (Figure 20) range between 5.5 and 7.0 while on the acidic side are within acceptable ranges for pasture production (Sargeant I and Sargant J 2005). | |
Exchangeable aluminium | 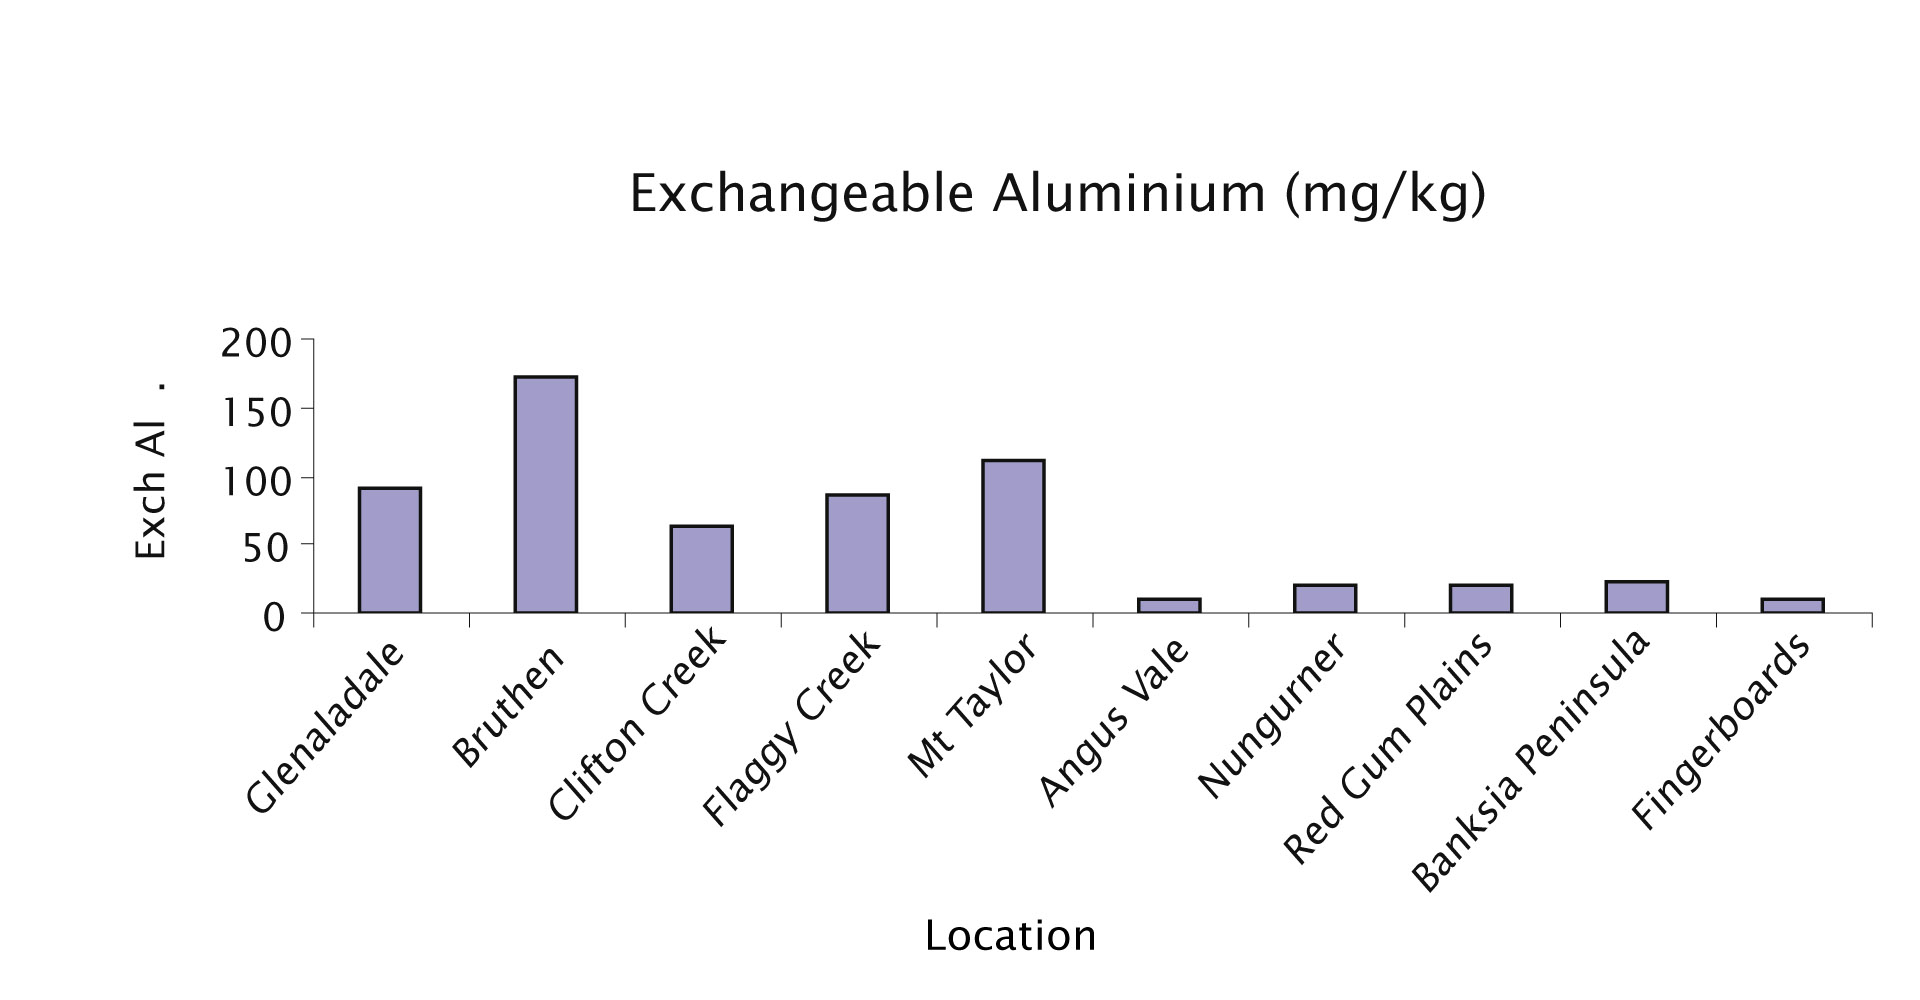 Figure 21: Mean Exchangeable Aluminium results for the whole soil profile across the 15 soil pit sites sampled in the Bairnsdale region |
| Whilst aluminium does not necessarily affect the erosive nature of the soils on its own in conjunction with the remediation works and other factors it needs to be considered in the design of the rehabilitation techniques for tunnel erosion in this region. During this project soils disturbed mechanically via deep ripping brought soil, and therefore aluminium, to the surface. This has implications for the pasture management at these locations into the future after the rehabilitation works are completed. High levels of sub soil aluminium also has implications for general agricultural practises and pasture management in the region when considering using deep rooted perennial species. For example lucerne does not tolerate even low levels of aluminium. | |
Cation exchange capacity (CEC) | 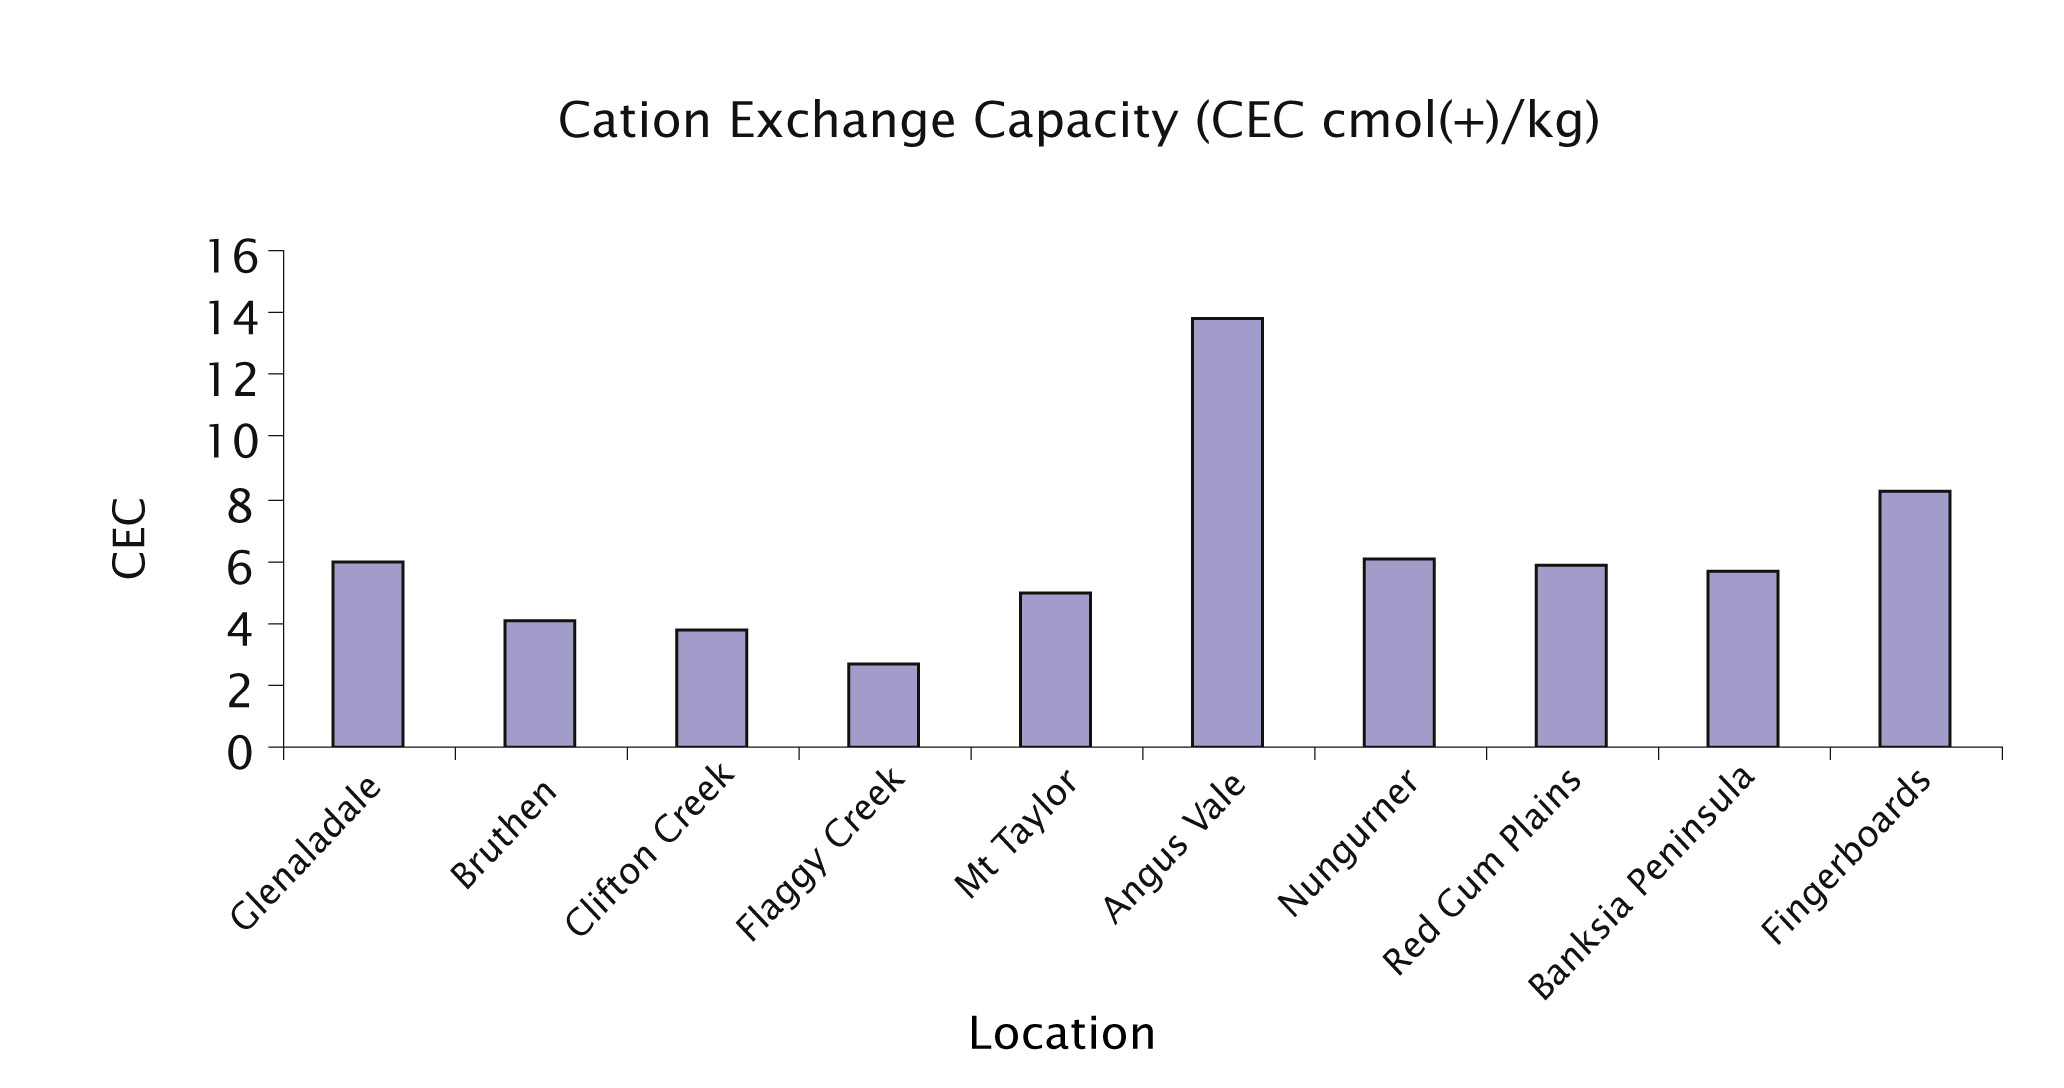 Figure 22: Mean Cation Exchange Capacity results for the whole soil profile across the 15 soil pit sites sampled in the Bairnsdale region |
Clay content | 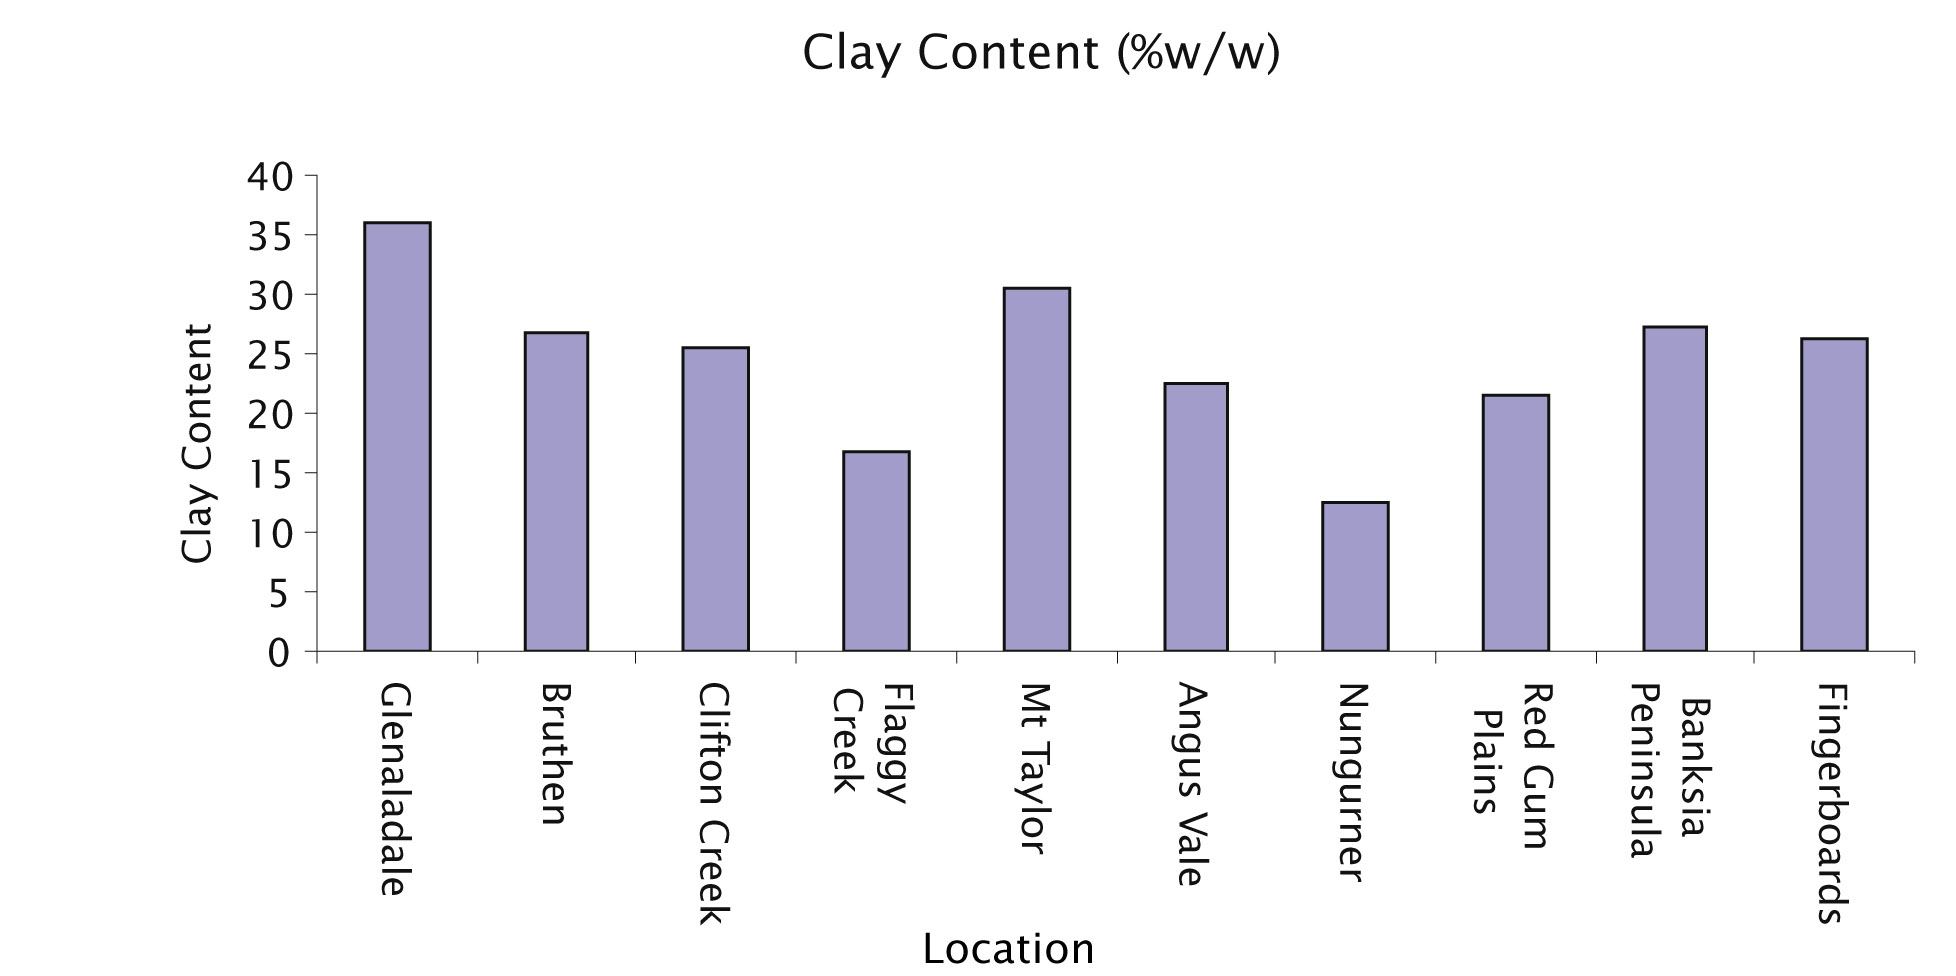 Figure 23: Mean Clay Content (%w/w) results for the whole soil profile across the 15 soil pit sites sampled in the Bairnsdale region |
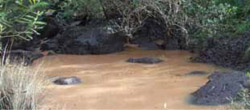
A flume that was sampled at Nungurger had a clay content of 1.5% (w/w) (Table 18). An average clay content for this soil type was 13% (w/w). Thus it can be estimated that 87% of the clay particles are transported away from the outlet of the tunnel and potentially into the waterways, which confirms the impact that erosion from the catchments of the Gippsland Lakes can have on the water quality in the region.
6.2 Individual soil pit sites sampled across the Bairnsdale region
Table 5: Glenaladale soil pit near Den of Nargan
Easting 550529590 Northing 5827027
Depth cm | ESP % | Ca:Mg ratio | pH-H2O | Exch Al mg/kg | CEC cmol(+)/kg |  |
0-12 | 2 | 2.3 | 5.8 | 18 | 6 | |
12-26 | 4 | 1.2 | 6 | 20 | 3 | |
26-60 | 16 | 0.1 | 6.2 | 26 | 10 | |
60-80 | 18 | 0.1 | 6.3 | 10 | 9.4 | |
80-100 | 21 | 0.1 | 6.2 | 14 | 7.4 |
Table 6: Glenaladale soil pit Bairnsdale-Dargo Road
Easting 550527696 Northing 5826027.
Depth cm | ESP % | Ca:Mg ratio | pH-H2O | Exch Al mg/kg | CEC cmol(+)/kg |  |
0-10 | 3 | 2.5 | 5 | 130 | 4.4 | |
10-30 | 5 | 1.2 | 5.2 | 120 | 2.1 | |
30-50 | 4 | 0.2 | 5.3 | 270 | 3.2 | |
50-100 | 12 | 0.1 | 5.6 | 140 | 5.2 |
Table 7: Bruthen soil pit
Easting 550573478 Northing 5824969.
Depth cm | ESP % | Ca:Mg ratio | pH-H2O | Exch Al mg/kg | CEC cmol(+)/kg |  |
0-12 | 1 | 4 | 5.4 | 71 | 9.4 | |
12-26 | 4 | 1.1 | 5.2 | 200 | 3.1 | |
26-60 | 4 | 0.5 | 5.3 | 190 | 3 |
Table 8: Wiseleigh soil pit
Easting 550570572 Northing 5826277.
Depth cm | ESP % | Ca:Mg ratio | pH-H2O | Exch Al mg/kg | CEC cmol(+)/kg | 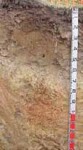 |
0-8 | 2 | 1.1 | 4.9 | 360 | 7.6 | |
8-35 | 9 | 0.3 | 5 | 460 | 1.2 | |
35-50 | 9 | 0.2 | 5.8 | 14 | 1.1 | |
50-70 | 10 | 0.2 | 5.8 | 82 | 1 | |
70-100 | 12 | 0.1 | 6 | 55 | 1.8 |
Table 9: Nungurner soil pit
Easting 550581940 Northing 5808051.
Depth cm | ESP % | Ca:Mg ratio | pH-H2O | Exch Al mg/kg | CEC cmol(+)/kg |
|
0-8 | 2 | 3.8 | 5.5 | 6 | 8.9 | |
8-16 | 3 | 3 | 5.8 | 14 | 4.2 | |
16-25 | 5 | 1.6 | 6.2 | <5 | 2 | |
25-60 | 12 | 0.2 | 5.9 | 32 | 8.5 | |
60-115 | 12 | 0.2 | 5.9 | 32 | 8.5 | |
115-170 | 27 | 0.1 | 5.5 | 19 | 8.4 | |
170-230 | 33 | 0.1 | 5.3 | 23 | 8.4 | |
230-270 | 34 | 0.1 | 5.5 | 28 | 5.3 | |
270-320 | 34 | 0.1 | 5.6 | 17 | 4.5 | |
320-390 | 34 | 0.1 | 5.6 | 15 | 3.6 | |
390-440 | 35 | 0.1 | 5.3 | 32 | 6.4 |
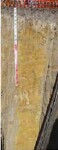
Table 10: Banksia Peninsula soil pit
Easting 550559578 Northing 580319.
Depth cm | ESP % | Ca:Mg ratio | pH-H2O | Exch Al mg/kg | CEC cmol(+)/kg | 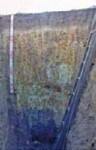 |
0-10 | 2 | 4.4 | 5.2 | 45 | 6.4 | |
10-35 | 3 | 1.1 | 5.6 | 56 | 3.3 | |
35-52 | 8 | 0.3 | 6 | 16 | 2.6 | |
52-110 | 19 | 0.1 | 5.6 | 8 | 4.2 | |
110-180 | 24 | 0.1 | 5.4 | 13 | 4.2 | |
180-240 | 29 | 0.1 | 5.5 | 14 | 10 | |
240-330 | 31 | 0.1 | 5.4 | 8 | 9.2 |
Table 11: Mount Taylor soil pit
Easting 550547821 Northing 5820575.
Depth cm | ESP % | Ca:Mg ratio | pH-H2O | Exch Al mg/kg | CEC cmol(+)/kg | 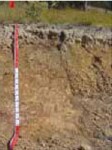 |
0-10 | 3 | 1.9 | 5.6 | 56 | 3.8 | |
10-45 | 9 | 0.8 | 5.7 | 45 | 1.1 | |
45-90 | 10 | 0.1 | 5.5 | 220 | 5.1 | |
90-120 | 14 | 0.1 | 5.3 | 160 | 7.2 | |
120-170 | 17 | 0.1 | 5.7 | 76 | 7.8 |
Table 12: Red Gum Plains at Fernbank soil pit
Easting 550531877 Northing 5804143.
Depth cm | ESP % | Ca:Mg ratio | pH-H2O | Exch Al mg/kg | CEC cmol(+)/kg | 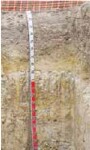 |
0-30 | 10 | 1.7 | 5.1 | 14 | 1 | |
30-60 | 13 | 0.5 | 5.2 | 36 | 0.8 | |
60-90 | 25 | 1 | 5.4 | 7 | 0.4 | |
90-100 | 9 | 0.2 | 5.9 | 6 | 1.1 | |
100-110 | 18 | 0.1 | 5.7 | 110 | 6.3 | |
110-180 | 22 | 0.1 | 5.8 | 15 | 3.7 | |
180-270 | 22 | 0.1 | 5.9 | <5 | 3.3 |
Table 13: Red Gum Plains at Nicholson soil pit
Easting 550566088 Northing 5810863.
Depth cm | ESP % | Ca:Mg ratio | pH-H2O | Exch Al mg/kg | CEC cmol(+)/kg | 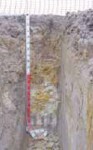 |
0-15 | 4 | 1.6 | 5.4 | 25 | 3 | |
15-40 | 11 | 0.3 | 5.9 | 42 | 11 | |
40-90 | 22 | 0.1 | 7.8 | <5 | 11 | |
90-120 | 32 | 0.1 | 7.9 | <5 | 14 | |
120-170 | 27 | 0.1 | 7.7 | <5 | 9.3 | |
170+ | 28 | 0.2 | 7.6 | <5 | 8.2 |
Table 14: Clifton Creek soil pit
Easting 550556591 Northing 5828027.
Depth cm | ESP % | Ca:Mg ratio | pH-H2O | Exch Al mg/kg | CEC cmol(+)/kg | 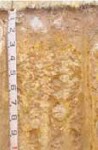 |
0-5 | 4 | 1.6 | 5.1 | 140 | 5.8 | |
5-20 | 20 | 0.3 | 5.7 | 100 | 2 | |
20-30 | 18 | 0.1 | 6.7 | 13 | 3.4 | |
30-70 | 8 | 0.1 | 7.6 | <5 | 3.9 |
Table 15: Flaggy Creek soil pit
Easting 550542400 Northing 582100.
Depth cm | ESP % | Ca:Mg ratio | pH-H2O | Exch Al mg/kg | CEC cmol(+)/kg | 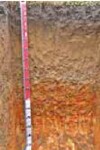 |
0-25 | 7 | 2.3 | 5.5 | 43 | 2.1 | |
25-65 | 8 | 2.4 | 6 | 27 | 1.2 | |
65-85 | 11 | 0.9 | 6.5 | NS | 1.4 | |
85-120 | 12 | 0.1 | 6 | 120 | 5.9 | |
120-150+ | 22 | 0.1 | 5.6 | 150 | 2.6 |
Table 16: Fingerboards soil pit
Easting 550528900 Northing 5817000.
Depth cm | ESP % | Ca:Mg ratio | pH-H2O | Exch Al mg/kg | CEC cmol(+)/kg | 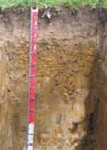 |
0-15 | 7 | 3.6 | 5.7 | <10 | 7.2 | |
15-27 | 7 | 2.4 | 6.0 | <10 | 1.6 | |
27-90 | 15 | 0.2 | 6.6 | NS | 12 | |
90-120+ | 23 | 0.1 | 8.0 | <10 | 12 |
Table 17: Angus Vale soil pit
Easting 550531400 Northing 5840400.
Depth cm | ESP % | Ca:Mg ratio | pH-H2O | Exch Al mg/kg | CEC cmol(+)/kg | 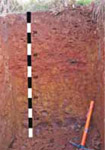 |
0-15 | 3 | 2.8 | 5.9 | <10 | 6.8 | |
15-30 | 2 | 2.5 | 6.5 | NS | 7.4 | |
30-55 | 1 | 1.5 | 7.3 | NS | 21 | |
55-90 | 1 | 1.8 | 7.1 | NS | 20 |
Table 18: Tunnel outlet sediment deposit soil analyses
Additional data collected from tunnel erosion sediments deposited in the paddock from the Nungurner tunnel outlet (flume).
Depth cm | ESP % | Ca:Mg ratio | pH-H2O | Exch Al mg/kg | CEC cmol(+)/kg | Clay Content %w/w |
Flume | 34 | 0.1 | 5.4 | 34 | 4.4 | 1.5 |
| 7. Conclusion 7.1 Type and extent of tunnel erosion in the region The spatial distribution of the tunnel erosion was determined in the Bairnsdale region with two different types, paddock and escarpment, identified. In the Foothill region (Glenaladale, Bruthen, Flaggy Creek, Clifton Creek and Mount Taylor) it was relatively shallow (within 1 to 1.5 metres of the soil surface) and generally found in multiple occurrences. This “Paddock tunnelling” (a typical example of which is depicted in Figure 2) was the subject of the demonstration site at Glenaladale, investigating cost effective rehabilitation methods. Overall when soil pits were excavated large cracks were observed when the soil was dry in the tunnel erosion areas. These would allow water to penetrate into the sodic B horizon increasing the contact of this dispersive layer of soil with water and promoting the tunnel erosion process illustrated in Figure 24. The other type of tunnelling - “escarpment tunnelling” (See Figure 3) - has been identified on the escarpments of the Gippsland Lakes and major river frontages and is characterised by deep erosion (up to 8 metres) and occurs less frequently than paddock tunnelling. The soil pit sampling across different areas found there were a range of issues that were important in the process of tunnel erosion. This became significant in the designing of the current recommendations for the rehabilitation of tunnel erosion in this region. This has lead to a proposal put to the East Gippsland Shire Council to include tunnel erosion as part of the Erosion Management Overlay, particularly in coastal areas of the region where increased erosion has accompanied a rise in residential development in these foreshore areas. The work has also provided data and information for the “Sustainable Soils Management Guide” a publication in partnership with the East Gippsland Landcare Network. |
Works at the Glenaladale demonstration site indicated that deep ripping alone can produce effective results for up to seven years (Figures 25 and 26).
To supplement ripping in the rehabilitation of tunnel erosion, calcium in the form of lime and gypsum was applied with the intention of reducing clay dispersion. Our results did not show that this had occurred. This could partly have been due to the amounts used (1 and 2 t/ha) being considerably less than laboratory testing suggested for full dispersion control (15 t/ha) and partly due to the fact that the demonstration site was not replicated to enable statistical differences to be detected. However, despite this the available literature indicates applications of both these forms of calcium contribute to reducing the dispersiveness of soils (Hazelton et al 1992).
The demonstration site and the regional soil analyses provided sufficient data to develop a comparable costing method to that used on gully erosion, to rehabilitate tunnel erosion in the Foothills area of the East Gippsland region. In addition, important information was provided about the extent, severity and location of tunnel erosion in this region.
The recommended method for paddock tunnel erosion rehabilitation in East Gippsland is as follows:
- application of 4 t/ha of gypsum
- single pass deep ripping by a dozer no less than 38 tonnes and 300 horse power on contour with the rip lines 1 metre part at 1.5 metres deep over the whole local paddock catchment area from top to bottom
- establishment of perennial pasture (or revegetation with tree species that are indigenous) and in some cases, in combination with a crop in the first year depending on the degree of slope of the site.
In the four years from 2004/05 to 2007/2008 the total project cost has been $1.58 million with $800,000 of government funds and $780,000 of landholder contribution.
The outcome has been to prevent an estimated 2,850 tonnes of soil from entering the Bairnsdale region’s major rivers and the Gippsland Lakes through the rehabilitation of tunnel erosion affected land in the Bairnsdale area. This equates to 285 tip truck loads of soil that has not been lost from the treated paddocks
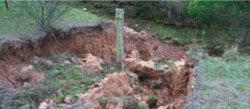
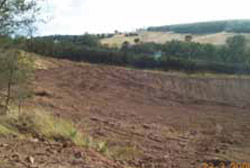
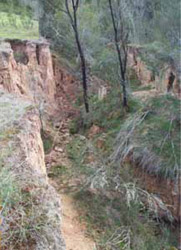 The photo above shows severe erosion that started as tunnel erosion and has collapsed to form an actively eroding gully line that other tunnels from the paddock feed into, increasing the hydraulic pressure that accelerates the erosive potential. The depth of this gully was six metres. | 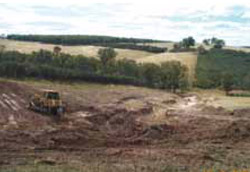 These two photos show the rehabilitation works in progress (above) and when completed with the area ready for seeding by the landholder (below). |
|
8. Future projects
The main areas needing further investigation include the following:
- The demonstration site and areas that have been rehabilitated require long term monitoring to ensure the current stability of the soil is maintained.
- Providing landholders with recommendations on how to manage these areas into the future (in terms of additional requirements for the addition of either gypsum or lime) to maintain the stability of the soil and the perennial pasture cover.
 26a Tunnel erosion in a paddock at Glenaladale before treatment |  26b Glenadaldale paddock during treatment with heavy machinery |
|
|
Figure 26: Cost effective rehabilitation processes of tunnel erosion in East Gippsland | |
- Abbott TS, McKenzie DC (1996). Improving soil structure with gypsum and lime. AgFact AC10 second edition NSW Agriculture.
- Boucher SC (1990). Field Tunnel Erosion: its Characteristics and Amelioration. PhD Thesis, University of Monash, (Clayton and Department of Conservation and Environment, East Melbourne) Australia.
- Boucher S (2006). Tunnel erosion. Online article available at www.vro.vic.gov.au. (Department of Primary Industries).
- East Gippsland Catchment ManagementAuthority (2005). East Gippsland Regional Catchment Strategy. (East Gippsland Catchment Management Authority).
- Floyd EJ (1974). Tunnel erosion--a field study in the Riverina. Journal Soil Conservation New South Wales 30,145-156.
- Gippsland Lakes Future Directions and Action Plan (2002). Department of Natural Resources and Environment. (Gippsland Coastal Board).
- Hazelton PA, Murphy BM (1992). What Do All the Numbers Mean? A Guide for the Interpretation of Soil Test Results, (Dept of Conservation & Land Management, Sydney).
- Hancock G, Wilkinson S, Read A (2007). Sources of sediment and nutrients to the Gippsland Lakes assessed using catchment modelling and sediment tracers. CSIRO Land and Water Science Report 70/07 July 2007.
- Leeper GW and Uren N (1993). Introduction to Soil Science. Melbourne University Press, Melbourne.
- Lines-Kelly R (Ed) (2000). Soil sense soil management for NSW North Coast farmers. NSW Agriculture.
- McKenzie DC, Abbott TS, Chan KY, Slavich PG, Hall DJM (1993). The nature, distribution and management of sodic soils in New South Wales. Australian Journal of Soil Research 31, 839-868.
- Nadiu R, Merry RH, Churchman GJ, Wright MJ, Murray RS, Fitzpatrick RW, Zarcinas BA (1993). Sodicity in South Australia – a review. Australian Journal of Soil Research 31, 911-29.
- NSW Agriculture and Fisheries (1989). Soil testing Methods And Interpretation. Biological and Chemical Research Institute, NSW Agriculture & Fisheries, Rydalmere.
- Peverill KI, Sparrow LA, Reuter DI (Eds) (2001). Soil analysis an interpretation manual. CSIRO Publishing Australia.
- Sargeant I, Sargant J (2005). Sustainable Soil Management. A reference manual to the major agricultural soils of the Bairnsdale and Dargo regions. East Gippsland Landcare Network Version 1.
- Waters C (2002). Tunnel erosion. Department of Primary Industries Information Notes Series Number AG0474.
- Webster IT, Parslow JS, Grayson RB, Molloy JA, Pavel S, Seong Tan K, Walker SJ, Wallace BB (2001). Gippsland Lakes Environmental Study Assessing Options for Improving Water Quality and Ecological Function. Final Report November. CSIRO Publishing.
- Ziebell D and Richards P (1993). Tunnel erosion. Department of Conservation and Natural Resources. Farm Care Note 3.1
Glenaladale near Den of Nargun (demonstrate site pit 1) | Glenaladale near Den of Nargun (demonstrate site pit 2) | Glenaladale near Den of Nargun (demonstrate site pit 3) | Glenaladale soil pit Bairnsdale-Dargo Road | Bruthen | Nungurna | Wiseleigh pit 1 | Wiseleigh pit 2 | Banksia Peninsula soil pit | Mount Taylor soil pit | Glenaladale West Beverley's Road soil pit | Red Gum Plains at Fernbank soil pit | Red Gum Plains at Nicholson soil pit | Clifton Creek soil pit | Flaggy Creek soil pit | Fingerboards soil pit | Angus Vale soil pit
Glenaladale near Den of Nargun (demonstration site pit 1) Easting 550529590 Northing 5827027
Horizon Depth cm | Colour | Texture | Gravel | Lime | Coarse Sand %w/w | Fine Sand %w/w | Silt %w/w | Clay % w/w | pH-H2O | pH CaCl2 | Exch. H cmol(+)/kg) | EC dS/m | TSS %w/w | Total C %w/w | Org. Mat %w/w | Total N %w/w |
O2 | Darkish grey brown | Fine sandy loam | Less than 5% | Negligible | 16 | 42.7 | 14.5 | 9 | 4.8 | 4.1 | 20 | 0.09 | 0.03 | 8.8 | NS | 0.62 |
A11 2-7 | Darkish grey brown | Very fine sandy clay loam | 5% | Negligible | 6.8 | 54.2 | 20 | 9 | 5 | 4.3 | 16 | 0.07 | 0.02 | 4.7 | NS | 0.3 |
A12 7-15 | Yellowish greyish brown | Very fine sandy clay loam | 10% | Negligible | 5.1 | 60.5 | 11.5 | 23 | 5.3 | 4.4 | 6.8 | <0.05 | 0.02 | 1.7 | NS | 0.08 |
A2 15-45 | Light yellowish brown | Silty clay loam | 30% | Negligible | 3.8 | 62.2 | 25 | 9.5 | 5.6 | 4.5 | 11 | <0.05 | 0.02 | 0.57 | NS | <0.05 |
B21 45-70 | Lightish yellowish brown | Medium heavy clay | Less than 5% | Negligible | 2.2 | 15.8 | 6 | 74.5 | 5.6 | 4.2 | 18 | 0.06 | 0.02 | NS | NS | NS |
B22 70-110 | Lightish yellowish brown | Light medium clay | 5% | Negligible | 4.3 | 31.1 | 10 | 52.5 | 5.8 | 4.4 | 11 | 0.07 | 0.02 | NS | NS | NS |
C 110-140 | Light yellowish greyish brown | Light clay | Less than 5% | Negligible | 4.8 | 39 | 14 | 41.5 | 6.5 | 5.1 | 5.1 | 0.08 | 0.03 | NS | NS | NS |
Horizon Depth cm | Total P mg/kg | Olsen P mg/kg | Exch. Ca cmol(+)/kg | Exch. Mg cmol(+)/kg | Exch. Na cmol(+)/kg | Exch. K cmol(+)/kg | Exch. Al mg/kg | CEC cmol(+)/kg | Ca:Mg | %Ca % | %Mg % | %Na % (ESP) | %K % | Slaking | Dispersion Test Dry | Dispersion Test Remoulded |
O2 | 530 | 21 | 4.1 | 1.9 | 0.1 | 0.4 | 100 | 6.5 | 2.2 | 63 | 30 | 2 | 7 | Minimal aggregation | Nil (2 hrs) Nil (20 hrs) | Minimal aggregation |
A11 2-7 | 250 | 5 | 1.9 | 1 | 0.1 | 0.1 | 160 | 3.1 | 1.9 | 62 | 33 | 4 | 4 | Water stable | Nil (2 hrs) Nil (20 hrs) | Nil (2 hrs) Nil (20 hrs) |
A12 7-15 | 43 | <1 | 0.8 | 0.6 | 0.1 | <0.1 | 120 | 1.6 | 1.4 | 50 | 38 | 7 | 7 | Water stable | Nil (2 hrs) Nil (20 hrs) | Slight (2 hrs) Slight (20 hrs) |
A2 15-45 | 77 | 1 | 0.4 | 0.6 | <0.1 | <0.1 | 71 | 1.2 | 0.7 | 34 | 50 | 9 | 9 | Considerable | Slight (2 hrs) Slight (20 hrs) | Slight (2 hrs) Slight (20 hrs) |
B21 45-70 | 78 | <1 | 0.2 | 8.7 | 1.1 | 0.2 | 430 | 10 | 0.1 | 2 | 86 | 11 | 2 | Considerable | Nil (2 hrs) Nil (20 hrs) | Moderate (2 hrs) Complete (20 hrs) |
B22 70-110 | 55 | <1 | <01 | 8.2 | 1.2 | 0.1 | 140 | 9.6 | 0.1 | 1 | 86 | 13 | 1 | Considerable | Nil (2 hrs) Nil (20 hrs) | Moderate (2 hrs) Strong (20 hrs) |
C 110-140 | 68 | <1 | <0.1 | 6.5 | 1.1 | <0.1 | 5 | 7.8 | 0.1 | 2 | 84 | 15 | 2 | Partial | Strong (2 hrs) Strong (20 hrs) | Strong (2 hrs) Complete (20 hrs) |
Glenaladale near Den of Nargun (demonstration site pit 2) Easting 550529590 Northing 5827027
Horizon Depth cm | Coarse Sand %w/w | Fine Sand %w/w | Silt %w/w | Clay %w/w | pH-H2O | pH-CaCl2 | Exch. H cmol(+)/kg | EC dS/m | TSS %w/w | Total C %w/w | Org Mat %w/w | Total N %w/w |
A11 0-5 | 7.9 | 46.2 | 26.5 | 10 | 5.2 | 4.4 | 16 | 009 | 0.03 | 4.3 | 10 | 0.34 |
A12 5-15 | 8.8 | 50.5 | 27.5 | 11.5 | 5.5 | 4.6 | 11 | <0.05 | 0.02 | 0.38 | 0.8 | <0.05 |
A2 15-23 | 3.8 | 49.6 | 28 | 14.5 | 5.7 | 4.8 | 8.5 | <0.05 | 0.02 | 1.9 | 3.6 | 0.08 |
B21 23-40 | 4 | 23.5 | 18 | 52.5 | 5.7 | 4.4 | 14 | 0.06 | 0.02 | NS | NS | NS |
B22 40-60 | 1.5 | 26.5 | 16.5 | 53 | 5.7 | 4.4 | 14 | 0.07 | 0.02 | NS | NS | NS |
C1 60-90 | 0.8 | 31.3 | 18 | 46 | 6.2 | 4.8 | 7.6 | 0.09 | 0.03 | NS | NS | NS |
C2 90-120 | 0.8 | 31.5 | 23.5 | 44 | 7.9 | 6.5 | 3.4 | 0.13 | 0.04 | NS | NS | NS |
Horizon Depth cm | Total P mg/kg | Olsen P mg/kg | Exch. Ca cmol(+)/kg | Exch. Mg cmol(+)/kg | Exch. Na cmol(+)/kg | Exch. K cmol(+)/kg | Exch. Al mg/kg | CEC cmol(+)/kg | Ca:Mg | %Ca % | %Mg % | %Na % (ESP) | %K % | Slaking | Dispersion Test Dry | Dispersion Test Remoulded |
A11 0-5 | 310 | 10 | 2.4 | 1.1 | <0.1 | 0.5 | 110 | 4.1 | 2.2 | 59 | 27 | 3 | 13 | Water stable | Nil (2 hrs) Nil (20 hrs) | Nil (2 hrs) Slight (20 hrs) |
A12 5-15 | 95 | <1 | 1.4 | 0.9 | <0.1 | 0.2 | 53 | 2.6 | 1.6 | 54 | 35 | 4 | 8 | Water stable | Nil (2 hrs) Nil (20 hrs) | Slight (2 hrs) Slight (20 hrs) |
A2 15-23 | 77 | <1 | 1 | 1.1 | <0.1 | 0.2 | 27 | 2.4 | 0.9 | 42 | 46 | 5 | 9 | Partial | Nil (2 hrs) Slight (20 hrs) | Strong (2 hrs) Strong (20 hrs) |
B21 23-40 | 70 | <1 | 1 | 4.6 | 0.5 | 0.3 | 150 | 6.4 | 0.3 | 16 | 72 | 8 | 5 | Partial | Nil (2 hrs) Nil (20 hrs) | Strong (2 hrs) Complete (20 hrs) |
B22 40-60 | 64 | <1 | 0.5 | 5.6 | 0.7 | 0.3 | 250 | 7.1 | 0.1 | 7 | 79 | 10 | 5 | Considerable | Nil (2 hrs) Nil (20 hrs) | Strong (2 hrs) Complete (20 hrs) |
C1 60-90 | 53 | <1 | 0.2 | 7.8 | 1.3 | 0.1 | 51 | 9.4 | 0.1 | 3 | 83 | 14 | 1 | Partial | Strong (2 hrs) Complete (20 hrs) | Strong (2 hrs) Complete (20 hrs) |
C2 90-120 | 54 | <1 | 0.3 | 9.8 | 1.9 | <0.1 | <5 | 12 | 0.1 | 3 | 81 | 16 | 1 | Partial | Strong (2 hrs) Strong (20 hrs) | Strong (2 hrs) Complete (20 hrs) |
Glenaladale near Den of Nargun (demonstration site pit 3) Easting 550529590 Northing 5827027
Horizon Depth cm | Coarse Sand %w/w | Fine Sand %w/w | Silt %w/w | Clay %w/w | pH-H2O | pH-CaCl2 | Exch. H cmol(+)/kg | EC dS/m | TSS %w/w | Total C %w/w | Org Mat %w/w | Total N %w/w |
A11 0-10 | 5.4 | 60.8 | 16.5 | 8 | 5.2 | 4.4 | 14 | 0.07 | 0.02 | 1.1 | 2.1 | 0.05 |
A2 10-25 | 6.1 | 60.3 | 17 | 11.5 | 5.4 | 4.4 | 9.1 | <0.05 | 0.02 | 3.9 | 7.4 | 0.25 |
B21 25-40 | 1.6 | 28 | 13 | 55.5 | 5.6 | 4.4 | 16 | 0.11 | 0.04 | NS | NS | NS |
B22 40-70 | 0.6 | 14.9 | 11 | 72 | 5.9 | 4.8 | 14 | 0.18 | 0.06 | NS | NS | NS |
C 70-120 | 1.1 | 21.8 | 22 | 54.5 | 7.8 | 6.8 | 4.4 | 0.17 | 0.05 | NS | NS | NS |
Horizon Depth cm | Total P mg/kg | Olsen P mg/kg | Exch. Ca cmol(+)/kg | Exch. Mg cmol(+)/kg | Exch. Na cmol(+)/kg | Exch. K cmol(+)/kg | Exch. Al mg/kg | CEC cmol(+)/kg | Ca:Mg | %Ca % | %Mg % | %Na % (ESP) | %K % | Slaking | Dispersion Test Dry | Dispersion Test Remoulded |
A11 0-10 | 230 | 7 | 1.5 | 0.8 | <0.1 | 0.1 | 96 | 2.5 | 1.9 | 60 | 32 | 4 | 4 | Minimal aggregation | Minimal aggregation | Minimal aggregation |
A2 10-25 | 65 | <1 | 0.5 | 0.9 | 0.2 | <0.1 | 73 | 1.7 | 0.6 | 30 | 53 | 12 | 6 | Water stable | Nil (2 hrs) Nil (20 hrs) | Nil (2 hrs) Strong (20 hrs) |
B21 25-40 | 71 | <1 | 0.5 | 6.5 | 1.2 | 0.1 | 200 | 8.3 | 0.1 | 6 | 79 | 15 | 2 | Partial | Nil (2 hrs) Nil (20 hrs) | Nil (2 hrs) Complete (20 hrs) |
B22 40-70 | 87 | <1 | 0.2 | 11 | 2 | 0.1 | 82 | 13 | 0.1 | 2 | 83 | 15 | 1 | Considerable | Strong (2 hrs) Strong (20 hrs) | Nil (2 hrs) Complete (20 hrs) |
C 70-120 | 94 | <1 | <0.1 | 10 | 1.8 | <0.1 | <5 | 12 | 0.1 | 1 | 84 | 15 | 1 | Considerable | Moderate (2 hrs) Moderate (20 hrs) | Moderate (2 hrs) Moderate (20 hrs) |
Glenaladale soil pit Bairnsdale-Dargo Road
Horizon Depth cm | Colour | Texture | Gravel | Lime | Coarse Sand %w/w | Fine Sand %w/w | Silt %w/w | Clay % w/w | pH-H2O | pH CaCl2 | Exch. H cmol(+)/kg) | EC dS/m | TSS %w/w | Total C %w/w | Org. Mat %w/w | Total N %w/w |
A1 0-12 | Grey brown | Very fine sandy clay loam | <5% | Negligible | 6.1 | 43.7 | 15.5 | 25 | 5.8 | 5.1 | 8.7 | 0.08 | 0.03 | 3.4 | NS | 0.24 |
A2 12-26 | Lightish brownish grey | Very fine sandy clay loam | 5% | Negligible | 8.1 | 46.2 | 29.5 | 11.5 | 6 | 5.2 | 6.4 | 0.06 | 0.02 | 1.2 | NS | 0.06 |
B21 26-60 | Lightish yellowish brown | Medium clay | 5% | Negligible | 4.7 | 23.4 | 17.5 | 50 | 6.2 | 5.2 | 6.7 | 0.17 | 0.05 | NS | NS | NS |
B22 UP 60-80 | Light yellowish brown | Medium heavy clay | <5% | Negligible | 0.4 | 9.4 | 21.5 | 63.5 | 6.3 | 5.4 | 6.3 | 0.24 | 0.08 | NS | NS | NS |
B22 80-100 | Light yellowish brown | Medium clay | <5% | Negligible | 0.3 | 5.8 | 21 | 70 | 6.2 | 5.5 | 8.3 | 0.26 | 0.08 | NS | NS | NS |
Horizon Depth cm | Total P mg/kg | Olsen P mg/kg | Exch. Ca cmol(+)/kg | Exch. Mg cmol(+)/kg | Exch. Na cmol(+)/kg | Exch. K cmol(+)/kg | Exch. Al mg/kg | CEC cmol(+)/kg | Ca:Mg | %Ca % | %Mg % | %Na % (ESP) | %K % | Slaking | Dispersion Test Dry | Dispersion Test Remoulded |
A1 0-12 | 210 | 5 | 3.8 | 1.7 | <0.1 | 0.4 | 18 | 6 | 2.3 | 64 | 29 | 2 | 7 | Water stable | Nil (2 hrs) Nil (20 hrs) | Nil (2 hrs) Nil (20 hrs) |
A2 12-26 | 83 | 1 | 1.5 | 1.3 | 0.1 | 0.1 | 20 | 3 | 1.2 | 50 | 44 | 4 | 4 | Partial | Slight (2 hrs) Slight (20 hrs) | Slight (2 hrs) Moderate (20 hrs) |
B21 26-60 | 68 | <1 | 0.6 | 7.8 | 1.6 | 0.1 | 26 | 10 | 0.1 | 6 | 78 | 16 | 1 | Partial | Strong (2 hrs) Complete (20 hrs) | Strong (2 hrs) Complete (20 hrs) |
B22 UP 60-80 | 59 | <1 | 0.4 | 7.2 | 1.7 | 0.1 | 10 | 9.4 | 0.1 | 5 | 77 | 18 | 1 | Partial | Moderate (2 hrs) Complete (20 hrs) | Strong (2 hrs) Complete (20 hrs) |
B22 80-100 | 63 | <1 | 0.2 | 5.6 | 1.5 | <0.1 | 14 | 7.4 | 0.1 | 3 | 76 | 21 | 2 | Considerable | Strong (2 hrs) Complete (20 hrs) | Strong (2 hrs) Complete (20 hrs) |
Bruthen Easting 550573478 Northing 5824969
Horizon Depth cm | Colour | Texture | Gravel | Lime | Coarse Sand %w/w | Fine Sand %w/w | Silt %w/w | Clay % w/w | pH-H2O | pH CaCl2 | Exch. H cmol(+)/kg) | EC dS/m | TSS %w/w | Total C %w/w | Org. Mat %w/w | Total N %w/w |
A1 0-12 | Darkish yellowish greyish brown | Fine sandy clay loam | 10% | Negligible | 15.8 | 30.1 | 25.5 | 17 | 5.4 | 4.7 | 17 | 0.07 | 0.02 | 5.7 | NS | 0.35 |
C1 12-35 | Yellowish brown | Fine sandy clay loam (heavy) | 5% | Negligible | 15.2 | 32.2 | 30.5 | 18 | 5.2 | 4.4 | 13 | <0.05 | 0.02 | NS | NS | NS |
C2 35-60 | Lightish brown | Fine sandy clay loam (heavy) | <5% | Negligible | 16.9 | 32.8 | 28 | 21 | 5.36 | 4.4 | 9.1 | <0.05 | 0.02 | NS | NS | NS |
Horizon Depth cm | Total P mg/kg | Olsen P mg/kg | Exch. Ca cmol(+)/kg | Exch. Mg cmol(+)/kg | Exch. Na cmol(+)/kg | Exch. K cmol(+)/kg | Exch. Al mg/kg | CEC cmol(+)/kg | Ca:Mg | %Ca % | %Mg % | %Na % (ESP) | %K % | Slaking | Dispersion Test Dry | Dispersion Test Remoulded |
A1 0-12 | 520 | 12 | 7.1 | 1.8 | <0.1 | 0.4 | 71 | 9.4 | 4 | 76 | 20 | 1 | 5 | Water stable | Nil (2 hrs) Nil (20 hrs) | Nil (2 hrs) Nil (20 hrs) |
C1 12-35 | 220 | 2 | 1.4 | 1.3 | <0.1 | 0.3 | 200 | 3.1 | 1.1 | 46 | 42 | 4 | 10 | Partial | Nil (2 hrs) Nil (20 hrs) | Slight (2 hrs) Moderate (20 hrs) |
C2 35-60 | 190 | 2 | 0.9 | 1.8 | <0.1 | 0.2 | 190 | 3 | 0.5 | 30 | 60 | 4 | 7 | Partial | Nil (2 hrs) Nil (20 hrs) | Moderate (2 hrs) Moderate (20 hrs) |
Nungurna soil pit Easting 550581940 Northing 5808051
Horizon Depth cm | Colour | Texture | Gravel | Lime | Coarse Sand %w/w | Fine Sand %w/w | Silt %w/w | Clay % w/w | pH-H2O | pH CaCl2 | Exch. H cmol(+)/kg) | EC dS/m | TSS %w/w | Total C %w/w | Org. Mat %w/w | Total N %w/w |
A11 0-8 | Darkish grey brown | Sandy loam | <5% | Negligible | 48.4 | 28 | 17 | 5.5 | 5.5 | 4.8 | 6.6 | 0.07 | 002 | 6 | NS | 0.37 |
A12 8-16 | Grey brown | Sandy loam (heavy) | 5% | Negligible | 51.6 | 32.4 | 5.5 | 7 | 5.8 | 4.9 | 4.1 | <0.05 | 0.02 | 1.5 | NS | 0.08 |
A2 16-25 | Lightish grey brown | Coarse sandy clay loam | 40% | Negligible | 54.4 | 28.8 | 8 | 5.5 | 6.2 | 5.5 | 2.5 | <0.05 | 0.02 | NS | NS | NS |
B21 25-60 | Lightish yellowish brown | Light medium clay (fine sandy) | 5% | Negligible | 16.8 | 44.8 | 7 | 29 | 5.9 | 4.7 | 6.6 | 0.11 | 0.04 | NS | NS | NS |
B22 60-115 | Lightish yellowish brown | Fine sandy clay | <5% | Negligible | 6.4 | 60 | 11 | 24.5 | 5.5 | 4.6 | 4.7 | 0.31 | 0.1 | NS | NS | NS |
B23 115-170 | Lightish yellowish brown | Sandy clay loam (heavy) | 5% | Negligible | 6.8 | 68.8 | 8 | 15.5 | 5.3 | 4.5 | 3.7 | 0.48 | 0.15 | NS | NS | NS |
C1 170-230 | Lightish yellowish brown | Sandy loam (heavy) | <5% | Negligible | 20.8 | 63.2 | 1 | 16 | 5.5 | 4.4 | 2.7 | 0.28 | 0.09 | NS | NS | NS |
C1 Gravel 230-270 | Lightish yellowish brown | Sandy loam | 40% | Negligible | 32.4 | 52.4 | 3 | 10 | 5.6 | 4.6 | 1.6 | 0.37 | 0.11 | NS | NS | NS |
C2 270-320 | Light yellowish brown | Sandy loam | <5% | Negligible | 11.2 | 78.8 | 3.5 | 4.5 | 5.6 | 4.6 | 2 | 0.24 | 0.08 | NS | NS | NS |
C3 320-390 | Light yellowish brown | Sandy clay loam | <5% | Negligible | 4.4 | 75.2 | 8.5 | 12.5 | 5.3 | 4.4 | 3.1 | 0.45 | 0.14 | NS | NS | NS |
C4 390-440 | Lightish yellowish brown | Sandy loam (heavy) | <5% | Negligible | 10 | 76 | 4 | 8.5 | 5.4 | 4.4 | 2.6 | 0.3 | NS | NS | NS | |
A Sand lense | Very light rown | Sandy loam | <5% | Negligible | 20.8 | 71.6 | 3.5 | 1.5 | 5.9 | 4.5 | 1.8 | 0.14 | 0.05 | NS | NS | NS |
Horizon Depth cm | Total P mg/kg | Olsen P mg/kg | Exch. Ca cmol(+)/kg | Exch. Mg cmol(+)/kg | Exch. Na cmol(+)/kg | Exch. K cmol(+)/kg | Exch. Al mg/kg | CEC cmol(+)/kg | Ca:Mg | %Ca % | %Mg % | %Na % (ESP) | %K % | Slaking | Dispersion Test Dry | Dispersion Test Remoulded |
A11 0-8 | 280 | 9 | 6.8 | 1.8 | <0.1 | 0.2 | 6 | 8.9 | 3.8 | 77 | 21 | 2 | 3 | Minimal aggregation | Minimal aggregation | Minimal aggregation |
A12 8-16 | 110 | 1 | 3 | 1 | <0.1 | 0.1 | 14 | 4.2 | 3 | 72 | 24 | 3 | 3 | Minimal aggregation | Minimal aggregation | Minimal aggregation |
A2 16-25 | 44 | <1 | 1.1 | 0.7 | <0.1 | 0.1 | <5 | 2 | 1.6 | 55 | 35 | 5 | 5 | Water stable | Nil (2 hrs) Nil (20 hrs) | Nil (2 hrs) Nil (20 hrs) |
B21 25-60 | 58 | <1 | 1 | 6.1 | 1 | 0.4 | 32 | 8.5 | 0.2 | 12 | 72 | 12 | 5 | Partial | Moderate (2 hrs) Strong (20 hrs) | Strong (2 hrs) Complete (20 hrs) |
B22 60-115 | 68 | <1 | 0.2 | 5.8 | 2.2 | 0.2 | 19 | 8.4 | 0.1 | 3 | 69 | 27 | 3 | Considerable | Strong (2 hrs) Strong (20 hrs) | Strong (2 hrs) Complete (20 hrs) |
B23 115-170 | 220 | <1 | <0.1 | 5.4 | 2.7 | 0.2 | 23 | 8.4 | 0.1 | 2 | 65 | 33 | 3 | Considerable | Nil (2 hrs) Moderate (20 hrs) | Moderate (2 hrs) Strong (20 hrs) |
C1 170-230 | 73 | <1 | <0.1 | 3.2 | 1.8 | 0.2 | 28 | 5.3 | 0.1 | 2 | 61 | 34 | 4 | Minimal aggregation | Minimal aggregation | Minimal aggregation |
C1 Gravel 230-270 | 90 | <1 | 0.1 | 2.8 | 1.5 | 0.1 | 17 | 4.5 | 0.1 | 3 | 63 | 34 | 3 | Minimal aggregation | Minimal aggregation | Minimal aggregation |
C2 270-320 | 120 | <1 | <0.1 | 2.2 | 1.2 | 0.1 | 15 | 3.6 | 0.1 | 3 | 62 | 34 | 3 | Minimal aggregation | Minimal aggregation | Minimal aggregation |
C3 320-390 | 51 | <1 | <0.1 | 3.9 | 2.2 | 0.2 | 32 | 6.4 | 0.1 | 2 | 61 | 35 | 4 | Considerable | Slight (2 hrs) Strong (20 hrs) | Moderate (2 hrs) Strong (20 hrs) |
C4 390-440 | 41 | <1 | <0.1 | 2.7 | 1.5 | 0.1 | 34 | 4.4 | 0.1 | 3 | 562 | 34 | 3 | Minimal aggregation | Minimal aggregation | Minimal aggregation |
A Sand lense | 110 | <1 | <0.1 | 1.5 | 1 | <0.1 | 35 | 2.7 | 0.1 | 4 | 56 | 37 | 4 | Minimal aggregation | Minimal aggregation | Minimal aggregation |
Wiseleigh Pit 1 Easting 550570572 Northing 5826277
Horizon Depth cm | Colour | Texture | Gravel | Lime | Coarse Sand %w/w | Fine Sand %w/w | Silt %w/w | Clay % w/w | pH-H2O | pH CaCl2 | Exch. H cmol(+)/kg) | EC dS/m | TSS %w/w | Total C %w/w | Org. Mat %w/w | Total N %w/w |
A11 0-10 | Dark brownish grey | Loamy sand | Less than 5% | Negligible | 53.6 | 24.4 | 7.5 | 5 | 5.2 | 4.5 | 12 | 0.19 | 0.06 | 4.8 | NS | 0.36 |
A12 10-35 | Darkish grey brown | Sandy clay loam | 60% | Negligible | 54 | 25.6 | 10.5 | 6 | 5.6 | 4.7 | 8.9 | 0.06 | 0.02 | 1.7 | NS | 0.09 |
A2 35-52 | Lightish yellowish brown | Coarse sandy clay loam (heavy) | Less than 5% | Negligible | 52.8 | 22 | 12 | 11.5 | 6 | 5 | 3.5 | 0.08 | 0.03 | NS | NS | NS |
B21 52-110 | Lightish yellowish brown | Light medium clay (sandy) | 5% | Negligible | 46 | 10.4 | 4.5 | 35.5 | 5.6 | 4.8 | 5.8 | 0.32 | 0.1 | NS | NS | NS |
B22 110-180 | Light yellowish brown | Sandy clay | 5% | Negligible | 53.6 | 12.8 | 3 | 31.5 | 5.4 | 4.7 | 4 | 0.4 | 0.12 | NS | NS | NS |
C1 180-240 | Very light yellowish greyish brown | Light medium clay | Less than 5% | Negligible | 0.4 | 8 | 50 | 37.5 | 5.5 | 4.8 | 4.8 | 0.78 | 0.24 | NS | NS | NS |
C2 240-330 | Light grey brown | Medium heavy clay | Less than 5% | Negligible | 2 | 10.8 | 20 | 64.5 | 5.4 | 4.9 | 5.3 | 1.3 | 0.39 | NS | NS | NS |
Horizon Depth cm | Total P mg/kg | Olsen P mg/kg | Exch. Ca cmol(+)/kg | Exch. Mg cmol(+)/kg | Exch. Na cmol(+)/kg | Exch. K cmol(+)/kg | Exch. Al mg/kg | CEC cmol(+)/kg | Ca:Mg | %Ca % | %Mg % | %Na % (ESP) | %K % | Slaking | Dispersion Test Dry | Dispersion Test Remoulded |
A11 0-10 | 420 | 23 | 4.4 | 1 | <0.1 | 0.9 | 45 | 6+.4 | 4.4 | 69 | 16 | 2 | 14 | Minimal aggregation | Minimal aggregation | Minimal aggregation |
A12 10-35 | 270 | 7 | 1.6 | 1.5 | <0.1 | <0.1 | 56 | 3.3 | 1.1 | 49 | 46 | 3 | 3 | Water stable | Nil (2 hrs) Nil (20 hrs) | Slight (2 hrs) Slight (20 hrs) |
A2 35-52 | 210 | 2 | 0.4 | 1.9 | 0.2 | <0.1 | 16 | 2.6 | 0.3 | 16 | 73 | 8 | 4 | Partial | Moderate (2 hrs) Moderate (20 hrs) | Moderate (2 hrs) Moderate (20 hrs) |
B21 52-110 | 50 | <1 | <0.1 | 3.2 | 0.7 | <0.1 | 8 | 4.2 | 0.1 | 3 | 77 | 19 | 3 | Considerable | Moderate (2 hrs) Strong (20 hrs) | Strong (2 hrs) Complete (20 hrs) |
B22 110-180 | 62 | <1 | <0.1 | 3 | 1 | 0.1 | 13 | 4.2 | 0.1 | 3 | 72 | 24 | 3 | Considerable | Moderate (2 hrs) Strong (20 hrs) | Moderate (2 hrs) Complete (20 hrs) |
C1 180-240 | 120 | <1 | <0.1 | 6.8 | 2.9 | 0.3 | 14 | 10 | 0.1 | 1 | 68 | 29 | 3 | Considerable | Slight (2 hrs) Moderate (20 hrs) | Nil (2 hrs) Complete (20 hrs) |
C2 240-330 | 150 | 2 | <0.1 | 6 | 2.8 | 0.3 | 8 | 9.2 | 0.1 | 1 | 66 | 31 | 4 | Considerable | Nil (2 hrs) Nil (20 hrs) | Nil (2 hrs) Strong (20 hrs) |
Wiseleigh Pit 2 Easting 550570572 Northing 5826277
Horizon Depth cm | Colour | Texture | Gravel | Lime | Coarse Sand %w/w | Fine Sand %w/w | Silt %w/w | Clay % w/w | pH-H2O | pH CaCl2 | Exch. H cmol(+)/kg) | EC dS/m | TSS %w/w | Total C %w/w | Org. Mat %w/w | Total N %w/w |
A11 0-5 | Dark grey brown | Loamy fine sand | 5% | Negligible | 26.8 | 27.2 | 7 | 22.5 | 4.8 | 4.2 | 21 | 0.13 | 0.04 | 14 | NS | 0.77 |
A12 5-30 | Darkish grey brown | Fine sandy clay loam | 30% | Negligible | 23.2 | 24.4 | 22.5 | 20.5 | 4.8 | 4.2 | 22 | 0.05 | 0.02 | 4.6 | NS | 0.18 |
A13 30-50 | Yellowish greyish brown | Fine sandy clay loam | 30% | Negligible | 29.2 | 22.8 | 1.5 | 43.5 | 5 | 4.4 | 15 | <0.05 | 0.02 | 2.2 | NS | 0.1 |
C1 50-70 | Light yellowish brown | Coarse sandy clay loam (heavy) | 40% | Negligible | 39.6 | 17.6 | 26 | 15.5 | 5.1 | 4.7 | 5.3 | <0.05 | 0.02 | NS | NS | NS |
Horizon Depth cm | Total P mg/kg | Olsen P mg/kg | Exch. Ca cmol(+)/kg | Exch. Mg cmol(+)/kg | Exch. Na cmol(+)/kg | Exch. K cmol(+)/kg | Exch. Al mg/kg | CEC cmol(+)/kg | Ca:Mg | %Ca % | %Mg % | %Na % (ESP) | %K % | Slaking | Dispersion Test Dry | Dispersion Test Remoulded |
A11 0-5 | 620 | 13 | 5.5 | 2.6 | <0.1 | 0.7 | 220 | 8.9 | 2.2 | 62 | 30 | 2 | 8 | Minimal aggregation | Minimal aggregation | Minimal aggregation |
A12 5-30 | 340 | 1 | 0.5 | 0.4 | <0.1 | 0.2 | 500 | 1.2 | 1.3 | 42 | 34 | 9 | 17 | Water stable | Nil (2 hrs) Nil (20 hrs) | Nil (2 hrs) Nil (20 hrs) |
A13 30-50 | 340 | 1 | <0.1 | 0.1 | <0.1 | 0.1 | 240 | 0.4 | 1 | 25 | 25 | 25 | 25 | Water stable | Nil (2 hrs) Nil (20 hrs) | Nil (2 hrs) Nil (20 hrs) |
C1 50-70 | 300 | <1 | <0.1 | <0.1 | <0.1 | <0.1 | 9.2 | 0.4 | 1 | 25 | 25 | 25 | 25 | Water stable | Nil (2 hrs) Nil (20 hrs) | Slight (2 hrs) Slight (20 hrs) |
Wiseleigh Pit 3 Easting 550570572 Northing 5826277
Horizon Depth cm | Colour | Texture | Gravel | Lime | Coarse Sand %w/w | Fine Sand %w/w | Silt %w/w | Clay % w/w | pH-H2O | pH CaCl2 | Exch. H cmol(+)/kg) | EC dS/m | TSS %w/w | Total C %w/w | Org. Mat %w/w | Total N %w/w |
A11 0-8 | Dark grey brown | Loamy sand | Less than 5% | Negligible | 24 | 22.8 | 19 | 18.5 | 4.9 | 4.2 | 18 | 0.12 | 0.04 | 11 | 0.59 | 0.59 |
A12 8-35 | Darkish grey brown | Fine sandy clay loam | Less than 5% | Negligible | 16.8 | 23.6 | 23 | 27.5 | 5 | 4.3 | 20 | <0.05 | 0.02 | 5.3 | 0.22 | 0.22 |
B21 35-50 | Lightish yellowish brown | Light clay (very fine sandy) | Less than 5% | Negligible | 18 | 22.4 | 12.5 | 43.5 | 5.8 | 4.7 | 13 | <0.05 | 0.02 | NS | NS | NS |
B22 50-70 | Light yellowish brown | Light clay | 30% | Negligible | 22 | 21.2 | 27 | 27.5 | 5.8 | 4.7 | 6.1 | <0.05 | 0.02 | NS | NS | NS |
C1 70-100 | Light yellowish brown | Light clay | Less than 5% | Negligible | 8.4 | 16.4 | 46 | 29 | 6 | 4.6 | 4.2 | <0.05 | 0.02 | NS | NS | NS |
Horizon Depth cm | Total P mg/kg | Olsen P mg/kg | Exch. Ca cmol(+)/kg | Exch. Mg cmol(+)/kg | Exch. Na cmol(+)/kg | Exch. K cmol(+)/kg | Exch. Al mg/kg | CEC cmol(+)/kg | Ca:Mg | %Ca % | %Mg % | %Na % (ESP) | %K % | Slaking | Dispersion Test Dry | Dispersion Test Remoulded |
A11 0-8 | 510 | 7 | 3.4 | 3.2 | 0.1 | 0.9 | 360 | 7.6 | 1.1 | 45 | 43 | 2 | 12 | Minimal aggregation | Minimal aggregation | Minimal aggregation |
A12 8-35 | 270 | <1 | 0.2 | 0.7 | 0.1 | 0.2 | 460 | 1.2 | 0.3 | 17 | 59 | 9 | 17 | Water stable | Nil (2 hrs) Nil (20 hrs) | Nil (2 hrs) Nil (20 hrs) |
B21 35-50 | 250 | <1 | <0.1 | 0.7 | 0.1 | 0.2 | 140 | 1.1 | 0.2 | 9 | 64 | 9 | 19 | Partial | Nil (2 hrs) Nil (20 hrs) | Nil (2 hrs) Nil (20 hrs) |
B22 50-70 | 210 | <1 | <0.1 | 0.7 | <0.1 | 0.1 | 82 | 1 | 0.2 | 10 | 70 | 10 | 10 | Partial | Slight (2 hrs) Slight (20 hrs) | Strong (2 hrs) Strong (20 hrs) |
C1 70-100 | 340 | <1 | <0.1 | 1.3 | 0.2 | 0.2 | 55 | 1.8 | 0.1 | 6 | 73 | 12 | 12 | Partial | Slight (2 hrs) Moderate (20 hrs) | Strong (2 hrs) Complete (20 hrs) |
Banksia Peninsula soil pit Easting 550559578 Northing 580319
Horizon Depth cm | Colour | Texture | Gravel | Lime | Coarse Sand %w/w | Fine Sand %w/w | Silt %w/w | Clay % w/w | pH-H2O | pH CaCl2 | Exch. H cmol(+)/kg) | EC dS/m | TSS %w/w | Total C %w/w | Org. Mat %w/w | Total N %w/w |
A11 0-10 | Darkish grey brown | Loamy sand | <5% | Negligible | 23.2 | 24 | 20.5 | 18 | 5.1 | 4.4 | 21 | 0.08 | 0.03 | 9.2 | NS | 0.54 |
A12 10-55 | Darkish yellowish greyish brown | Light clay (fine sandy) | <5% | Negligible | 18.4 | 28.4 | 6.5 | 39 | 5.4 | 4.5 | 21 | <0.05 | 0.02 | 3.5 | NS | 0.16 |
A2 55-65 | Lightish yellowish brown | Fine sandy clay loam (heavy) | 5% | Negligible | 24.8 | 34 | 21 | 18 | 6 | 4.8 | 6 | <0.05 | 0.02 | NS | NS | NS |
B2 65-85 | Light yellowish brown | Light clay (fine sandy) | 5% | Negligible | 24 | 30.4 | 21 | 23 | 6.2 | 4.9 | 4.6 | <0.05 | 0.02 | NS | NS | NS |
C1 85-120 | Lightish brown | Light medium clay (very fine sandy) | 5% | Negligible | 20.8 | 26.8 | 18.5 | 33 | 6.6 | 5.1 | 3.5 | 0.05 | 0.02 | NS | NS | NS |
C2 120-190 | Lightish yellowish brown | Light clay | <5% | Negligible | 22.8 | 28.8 | 17.5 | 29.5 | 7.7 | 6.1 | 2.1 | 0.06 | 0.02 | NS | NS | NS |
C3 190-240 | Yellowish brown | Light medium clay | <5% | Negligible | 18.4 | 21.2 | 14 | 44.5 | 8 | 6.8 | 3.4 | 0.2 | 0.06 | NS | NS | NS |
Horizon Depth cm | Total P mg/kg | Olsen P mg/kg | Exch. Ca cmol(+)/kg | Exch. Mg cmol(+)/kg | Exch. Na cmol(+)/kg | Exch. K cmol(+)/kg | Exch. Al mg/kg | CEC cmol(+)/kg | Ca:Mg | %Ca % | %Mg % | %Na % (ESP) | %K % | Slaking | Dispersion Test Dry | Dispersion Test Remoulded |
A11 0-10 | 490 | 5 | <0.1 | 3.2 | 0.5 | 0.1 | 26 | 3.9 | 0.1 | 3 | 82 | 13 | 3 | Minimal aggregation | Minimal aggregation | Minimal aggregation |
A12 10-55 | 260 | <1 | 0.6 | 0.9 | 0.1 | 0.3 | 230 | 1.9 | 0.7 | 32 | 48 | 6 | 16 | Water stable | Nil (2 hrs) Nil (20 hrs) | Slight (2 hrs) Slight (20 hrs) |
A2 55-65 | 150 | <1 | <0.1 | 0.9 | 0.1 | <0.1 | 63 | 1.2 | 0.2 | 9 | 75 | 9 | 9 | Considerable | Slight (2 hrs) Moderate (20 hrs) | Strong (2 hrs) Strong (20 hrs) |
B2 65-85 | 180 | <1 | <0.1 | 1.9 | 0.3 | <0.1 | 36 | 2.4 | 0.1 | 5 | 80 | 13 | 5 | Considerable | Moderate (2 hrs) Moderate (20 hrs) | Strong (2 hrs) Strong (20 hrs) |
C1 85-120 | 190 | <1 | 3.6 | 2.3 | 0.2 | 0.4 | 210 | 6.5 | 1.6 | 56 | 36 | 3 | 7 | Considerable | Slight (2 hrs) Moderate (20 hrs) | Strong (2 hrs) Strong (20 hrs) |
C2 120-190 | 160 | <1 | <0.1 | 2.9 | 0.7 | <0.1 | <5 | 3.8 | 0.1 | 3 | 77 | 19 | 3 | Considerable | Strong (2 hrs) Strong (20 hrs) | Strong (2 hrs) Strong (20 hrs) |
C3 190-240 | 170 | <1 | 0.3 | 4.9 | 1.9 | 0.2 | <5 | 7.3 | 0.1 | 5 | 68 | 26 | 3 | Considerable | Strong (2 hrs) Strong (20 hrs) | Strong (2 hrs) Strong (20 hrs) |
Mount Taylor soil pit Easting 550547821 Northing 5820575
Horizon Depth cm | Colour | Texture | Gravel | Lime | Coarse Sand %w/w | Fine Sand %w/w | Silt %w/w | Clay % w/w | pH-H2O | pH CaCl2 | Exch. H cmol(+)/kg) | EC dS/m | TSS %w/w | Total C %w/w | Org. Mat %w/w | Total N %w/w |
A1 0-10 | Grey brown | Sandy clay loam | 5% | Negligible | 30 | 35.6 | 17 | 9.5 | 5.6 | 4.7 | 9 | <0.05 | 0.02 | 2.9 | NS | 0.17 |
A2 10-45 | Light grey brown | Sandy clay loam (heavy) | <5% | Negligible | 34 | 34.8 | 24.5 | 7 | 5.7 | 4.7 | 4.5 | <0.05 | 0.02 | NS | NS | NS |
B21 45-90 | Lightish yellowish brown | Medium clay | <5% | Negligible | 18.8 | 22 | 13.5 | 43.5 | 5.5 | 4.2 | 12 | 0.06 | 0.02 | NS | NS | NS |
B22 90-120 | Lightish yellowish brown | Medium clay | <5% | Negligible | 18.8 | 20.8 | 15.5 | 45 | 5.3 | 4.3 | 9.2 | 0.15 | 0.05 | NS | NS | NS |
B23 120-170 | Light greyish brown | Medium clay | <5% | Negligible | 7.6 | 16.4 | 27 | 48 | 5.7 | 4.6 | 5.2 | 0.19 | 0.06 | NS | NS | NS |
Horizon Depth cm | Total P mg/kg | Olsen P mg/kg | Exch. Ca cmol(+)/kg | Exch. Mg cmol(+)/kg | Exch. Na cmol(+)/kg | Exch. K cmol(+)/kg | Exch. Al mg/kg | CEC cmol(+)/kg | Ca:Mg | %Ca % | %Mg % | %Na % (ESP) | %K % | Slaking | Dispersion Test Dry | Dispersion Test Remoulded |
A1 0-10 | 200 | 6 | 2.2 | 1.2 | <0.1 | 0.3 | 56 | 3.8 | 1.9 | 58 | 32 | 3 | 8 | Water stable | Nil (2 hrs) Nil (20 hrs) | Nil (2 hrs) Nil (20 hrs) |
A2 10-45 | 53 | <1 | 0.4 | 0.5 | <0.1 | <0.1 | 45 | 1.1 | 0.8 | 37 | 46 | 9 | 9 | Partial | Nil (2 hrs) Nil (20 hrs) | Moderate (2 hrs) Moderate (20 hrs) |
B21 45-90 | 61 | <1 | 0.4 | 4 | 0.5 | 0.2 | 220 | 5.1 | 0.1 | 8 | 79 | 10 | 4 | Considerable | Nil (2 hrs) Slight (20 hrs) | Strong (2 hrs) Complete (20 hrs) |
B22 90-120 | 43 | <1 | 0.1 | 5.9 | 1 | 0.2 | 160 | 7.2 | 0.1 | 2 | 82 | 14 | 3 | Considerable | Nil (2 hrs) Moderate (20 hrs) | Slight (2 hrs) Strong (20 hrs) |
B23 120-170 | 67 | <1 | 0.1 | 6.2 | 1.3 | 0.2 | 76 | 7.8 | 0.1 | 2 | 80 | 17 | 3 | Considerable | Dispersive and non-dispersive aggregates | Strong (2 hrs) Complete (20 hrs |
Glenaladale West Beverly’s Road soil pit Easting 550521865 Northing 5821870
Horizon Depth cm | Colour | Texture | Gravel | Lime | Coarse Sand %w/w | Fine Sand %w/w | Silt %w/w | Clay % w/w | pH-H2O | pH CaCl2 | Exch. H cmol(+)/kg) | EC dS/m | TSS %w/w | Total C %w/w | Org. Mat %w/w | Total N %w/w |
A1 0-10 | NS | NS | NS | NS | 21.7 | 29.1 | 25 | 12.5 | 5 | 4.4 | 16 | 0.08 | 0.03 | 5.5 | 10 | 0.33 |
B1 10-30 | NS | NS | NS | NS | 15.1 | 30.5 | 31 | 19 | 5.2 | 4.3 | 9.1 | <0.05 | 0.02 | 1.1 | 2.1 | 0.06 |
B2 30-50 | NS | NS | NS | NS | 3.9 | 14.3 | 31.5 | 47.5 | 5.3 | 4.2 | 11 | <0.05 | 0.02 | NS | NS | NS |
C 50-100 | NS | NS | NS | NS | 1.9 | 11.8 | 32 | 55 | 5.6 | 4.4 | 8.4 | 0.08 | 0.03 | NS | NS | NS |
Horizon Depth cm | Total P mg/kg | Olsen P mg/kg | Exch. Ca cmol(+)/kg | Exch. Mg cmol(+)/kg | Exch. Na cmol(+)/kg | Exch. K cmol(+)/kg | Exch. Al mg/kg | CEC cmol(+)/kg | Ca:Mg | %Ca % | %Mg % | %Na % (ESP) | %K % | Slaking | Dispersion Test Dry | Dispersion Test Remoulded |
A1 0-10 | 220 | 8 | 2.9 | 1.2 | <0.1 | 0.2 | 130 | 4.4 | 2.5 | 66 | 28 | 3 | 5 | Partial | Nil (2 hrs) Nil (20 hrs) | Nil (2 hrs) Nil (20 hrs) |
B1 10-30 | 110 | <1 | 1 | 0.9 | <0.1 | <0.1 | 120 | 2.1 | 1.2 | 48 | 13 | 5 | 5 | Partial | Nil (2 hrs) Slight (20 hrs) | Moderate (2 hrs) Moderate (20 hrs) |
B2 30-50 | 100 | <1 | 0.5 | 2.5 | 0.1 | 0.1 | 270 | 3.2 | 0.2 | 16 | 79 | 4 | 4 | Partial | Slight (2 hrs) Slight (20 hrs) | Strong (2 hrs) Complete (20 hrs) |
C 50-100 | 91 | <1 | <0.1 | 4.4 | 0.6 | 0.1 | 140 | 5.2 | 0.1 | 2 | 85 | 12 | 2 | Partial | Strong (2 hrs) Complete (20 hrs) | Strong (2 hrs) Complete (20 hrs) |
Red Gum Plains at Fernbank soil pit Easting 550531877 Northing 5804143
Horizon Depth cm | Colour | Texture | Gravel | Lime | Coarse Sand %w/w | Fine Sand %w/w | Silt %w/w | Clay % w/w | pH-H2O | pH CaCl2 | Exch. H cmol(+)/kg) | EC dS/m | TSS %w/w | Total C %w/w | Org. Mat %w/w | Total N %w/w |
2A1 30-60 | NS | NS | NS | NS | 30.5 | 61.8 | 3 | 2.5 | 5.1 | 4.4 | 2.1 | <0.05 | 0.02 | 0.36 | 0.7 | <0.05 |
3A1 60-90 | NS | NS | NS | NS | 62.4 | 27.2 | 3 | 4 | 5.2 | 4.4 | 3 | <0.05 | 0.02 | 0.39 | 0.8 | <0.05 |
3B21 90-100 | NS | NS | NS | NS | 54.6 | 38.5 | 3 | 1.5 | 5.4 | 4.7 | 1.1 | <0.05 | 0.02 | 0.12 | 0.3 | <0.05 |
3B22 100-110 | NS | NS | NS | NS | 43.8 | 35.7 | 10 | 9.5 | 5.9 | 4.6 | 1.5 | <0.05 | 002 | NS | NS | NS |
3C 110-180 | NS | NS | NS | NS | 26.2 | 22 | 3.5 | 45.5 | 5.7 | 4.3 | 9 | 0.08 | 0.03 | NS | NS | NS |
3D 180-270 | NS | NS | NS | NS | 55.1 | 22.5 | 3.8 | 16.5 | 5.8 | 4.5 | 3.3 | 0.08 | 0.03 | NS | NS | NS |
Horizon Depth cm | Total P mg/kg | Olsen P mg/kg | Exch. Ca cmol(+)/kg | Exch. Mg cmol(+)/kg | Exch. Na cmol(+)/kg | Exch. K cmol(+)/kg | Exch. Al mg/kg | CEC cmol(+)/kg | Ca:Mg | %Ca % | %Mg % | %Na % (ESP) | %K % | Slaking | Dispersion Test Dry | Dispersion Test Remoulded |
2A1 30-60 | 43 | <1 | 0.5 | 0.3 | <0.1 | <0.1 | 14 | 1 | 1.7 | 50 | 30 | 10 | 10 | Minimal aggregation | Minimal aggregation | Minimal aggregation |
3A1 60-90 | 71 | <1 | 0.2 | 0.4 | <0.1 | <0.1 | 36 | 0.8 | 0.5 | 25 | 50 | 13 | 13 | NS | NS | NS |
3B21 90-100 | 29 | <1 | <0.1 | 0.1 | <0.1 | <0.1 | 7 | 0.4 | 1 | 25 | 25 | 25 | 25 | Minimal aggregation | Minimal aggregation | Minimal aggregation |
3B22 100-110 | 42 | <1 | <0.1 | 0.8 | <0.1 | <0.1 | 6 | 1.1 | 0.2 | 9 | 73 | 9 | 9 | Minimal aggregation | Minimal aggregation | Minimal aggregation |
3C 110-180 | 44 | <1 | <0.1 | 5 | 1.1 | 0.1 | 110 | 6.3 | 0.1 | 2 | 80 | 18 | 2 | Considerable | Strong (2 hrs) Strong (20 hrs) | Strong (2 hrs) Complete (20 hrs) |
3D 180-270 | 33 | <1 | <0.1 | 2.7 | 0.8 | 0.1 | 15 | 3.7 | 0.1 | 3 | 73 | 22 | 3 | Minimal aggregation | Minimal aggregation | Minimal aggregation |
Red Gum Plains at Nicholson soil pit Easting 550566088 Northing 5810863
Horizon Depth cm | Colour | Texture | Gravel | Lime | Coarse Sand %w/w | Fine Sand %w/w | Silt %w/w | Clay % w/w | pH-H2O | pH CaCl2 | Exch. H cmol(+)/kg) | EC dS/m | TSS %w/w | Total C %w/w | Org. Mat %w/w | Total N %w/w |
A1 0-15 | NS | NS | NS | NS | 17.1 | 54.5 | 16.5 | 7 | 5.4 | 4.6 | 6 | 0.07 | 0.02 | 1.9 | 3.6 | 0.15 |
B21 15-40 | NS | NS | NS | NS | 8.7 | 31.2 | 12 | 45.5 | 5.9 | 4.8 | 9.5 | 0.13 | 0.04 | NS | NS | NS |
B22 40-90 | NS | NS | NS | NS | 7 | 35.8 | 15 | 38 | 7.8 | 6.6 | 3.4 | 0.26 | 0.08 | NS | NS | NS |
B/C 90-120 | NS | NS | NS | NS | 2.1 | 27 | 25 | 41 | 7.9 | 7.3 | 2.9 | 0.96 | 0.29 | NS | NS | NS |
C1 120-170 | NS | NS | NS | NS | 1.3 | 42.3 | 29 | 24 | 7.7 | 7.2 | 1.8 | 0.89 | 0.27 | NS | NS | NS |
C2 170+ | NS | NS | NS | NS | 0.4 | 40.6 | 24.5 | 29 | 7.6 | 6.9 | 1.9 | 0.86 | 0.26 | NS | NS | NS |
Horizon Depth cm | Total P mg/kg | Olsen P mg/kg | Exch. Ca cmol(+)/kg | Exch. Mg cmol(+)/kg | Exch. Na cmol(+)/kg | Exch. K cmol(+)/kg | Exch. Al mg/kg | CEC cmol(+)/kg | Ca:Mg | %Ca % | %Mg % | %Na % (ESP) | %K % | Slaking | Dispersion Test Dry | Dispersion Test Remoulded |
A1 0-15 | 170 | 10 | 1.7 | 1.1 | <0.1 | 0.1 | 25 | 3 | 1.6 | 57 | 37 | 4 | 4 | Water stable | Nil (2 hrs) Nil (20 hrs) | Slight (2 hrs) Slight (20 hrs) |
B21 15-40 | 79 | <1 | 1.7 | 7.7 | 1.2 | 0.3 | 42 | 11 | 0.3 | 16 | 71 | 11 | 3 | Water stable | Nil (2 hrs) Slight (20 hrs) | Strong (2 hrs) Strong (20 hrs) |
B22 40-90 | 50 | <1 | 0.8 | 7.6 | 2.4 | 0.2 | <5 | 11 | 0.1 | 8 | 69 | 22 | 2 | Partial | Strong (2 hrs) Complete (20 hrs) | Strong (2 hrs) Complete (20 hrs) |
B/C 90-120 | 61 | <1 | 0.7 | 8.4 | 4.3 | 0.2 | <5 | 14 | 0.1 | 6 | 62 | 32 | 2 | Considerable | Slight (2 hrs) Slight (20 hrs) | Slight (2 hrs) Strong (20 hrs) |
C1 120-170 | 59 | <1 | 0.6 | 6.1 | 2.5 | 0.1 | <5 | 9.3 | 0.1 | 7 | 66 | 27 | 1 | Considerable | Moderate (2 hrs) Moderate (20 hrs) | Strong (2 hrs) Strong (20 hrs) |
C2 170+ | 55 | <1 | 0.6 | 5.2 | 2.3 | 0.1 | <5 | 8.2 | 0.2 | 8 | 64 | 28 | 2 | Considerable | Slight (2 hrs) Strong (20 hrs) | Strong (2 hrs) Complete (20 hrs) |
Clifton Creek soil pit Easting 550556591 Northing 5828027
Horizon Depth cm | Colour | Texture | Gravel | Lime | Coarse Sand %w/w | Fine Sand %w/w | Silt %w/w | Clay % w/w | pH-H2O | pH CaCl2 | Exch. H cmol(+)/kg) | EC dS/m | TSS %w/w | Total C %w/w | Org. Mat %w/w | Total N %w/w |
A1 0-5 | NS | NS | NS | NS | 21.3 | 28.7 | 19.5 | 14 | 5.1 | 4.4 | 21 | 0.1 | 0.03 | 8.3 | 16 | 0.6 |
A2 5-20 | NS | NS | NS | NS | 18 | 27.8 | 7 | 41 | 5.7 | 4.7 | 12 | 0.06 | 0.02 | 2.3 | 4.4 | 0.11 |
B2 20-30 | NS | NS | NS | NS | 16.6 | 26.1 | 28 | 25 | 6.7 | 5.3 | 6.1 | 0.06 | 0.02 | NS | NS | NS |
C 30-70 | NS | NS | NS | NS | 19 | 17.8 | 38 | 22.5 | 7.6 | 6.4 | 1.7 | 0.05 | 0.02 | NS | NS | NS |
Horizon Depth cm | Total P mg/kg | Olsen P mg/kg | Exch. Ca cmol(+)/kg | Exch. Mg cmol(+)/kg | Exch. Na cmol(+)/kg | Exch. K cmol(+)/kg | Exch. Al mg/kg | CEC cmol(+)/kg | Ca:Mg | %Ca % | %Mg % | %Na % (ESP) | %K % | Slaking | Dispersion Test Dry | Dispersion Test Remoulded |
A1 0-5 | 550 | 9 | 3.2 | 2.1 | 0.2 | 0.3 | 140 | 5.8 | 1.6 | 56 | 36 | 4 | 6 | Water stable | Nil (2 hrs) Nil (20 hrs) | Slight (2 hrs) Slight (20 hrs) |
A2 5-20 | 350 | 1 | 0.3 | 1.2 | 0.4 | <0.1 | 100 | 2 | 0.3 | 15 | 60 | 20 | 5 | Water stable | Nil (2 hrs) Slight (20 hrs) | Moderate (2 hrs) Moderate (20 hrs) |
B2 20-30 | 540 | <1 | 0.1 | 2.6 | 0.6 | 0.1 | 13 | 3.4 | 0.1 | 3 | 77 | 18 | 3 | Partial | Moderate (2 hrs) Moderate (20 hrs) | Strong (2 hrs) Strong (20 hrs) |
C 30-70 | 750 | <1 | <0.1 | 3.4 | 0.3 | <0.1 | <5 | 3.9 | 0.1 | 3 | 88 | 8 | 3 | Partial | Moderate (2 hrs) Moderate (20 hrs) | Strong (2 hrs) Strong (20 hrs) |
Flaggy Creek soil pit Easting 550542400 Northing 582100
Horizon Depth cm | Colour | Texture | Gravel | Lime | Coarse Sand %w/w | Fine Sand %w/w | Silt %w/w | Clay % w/w | pH-H2O | pH CaCl2 | Exch. H cmol(+)/kg) | EC dS/m | TSS %w/w | Total C %w/w | Org. Mat %w/w | Total N %w/w |
A1 0-25 | Very dark grey | Loamy sand | NS | NS | 31.5 | 26.2 | 3.8 | 5.3 | 5.5 | 4.2 | 8.5 | 0.06 | 0.02 | NS | 3.6 | 0.1 |
A21 25-65 | Yellowish brown | Sand | NS | NS | 30.1 | 57.8 | 4.5 | 5.5 | 6.0 | 5.0 | 4.1 | <0.05 | 0.02 | NS | 1.1 | <0.05 |
A22 65-85 | Light yellowish brown | Loamy sand | NS | NS | 29.3 | 57.8 | 4.8 | 7.8 | 6.5 | 5.4 | 3.2 | <0.05 | 0.02 | NS | NS | NS |
B2 85-120 | Strong Brown, yellowish brown mottles | Medium clay with sand | NS | NS | 14.4 | 31.9 | 3 | 48 | 6 | 4.6 | 8.7 | 0.06 | 0.02 | NS | NS | NS |
C 120-150+ | Yellow, light olive brown mottles | Clayey sand | NS | NS | 20.1 | 50.9 | 9 | 17.5 | 5.6 | 4.4 | 4.1 | 0.06 | 0.02 | NS | NS | NS |
Horizon Depth cm | Total P mg/kg | Olsen P mg/kg | Exch. Ca cmol(+)/kg | Exch. Mg cmol(+)/kg | Exch. Na cmol(+)/kg | Exch. K cmol(+)/kg | Exch. Al mg/kg | CEC cmol(+)/kg | Ca:Mg | %Ca % | %Mg % | %Na % (ESP) | %K % | Slaking | Dispersion Test Dry | Dispersion Test Remoulded |
A1 0-25 | NS | NS | 1.2 | 0.53 | 0.13 | 0.17 | 43 | 2.1 | 2.3 | 60 | 27 | 7 | 9 | Water stable | Nil (2 hrs) Nil (20 hrs) | Nil (2 hrs) Nil (20 hrs) |
A21 25-65 | NS | NS | 0.67 | 0.29 | 0.08 | 0.08 | 27 | 1.2 | 2.4 | 60 | 29 | 8 | 8 | Considerable | Nil (2 hrs) Nil (20 hrs) | Nil (2 hrs) Nil (20 hrs) |
A22 65-85 | NS | NS | 0.49 | 0.59 | 0.14 | 0.11 | 1.4 | 0.9 | 37 | 45 | 11 | 9 | Considerable | Nil (2 hrs) Nil (20 hrs) | Nil (2 hrs) Nil (20 hrs) | |
B2 85-120 | NS | NS | 0.18 | 4.9 | 0.68 | 0.09 | 120 | 5.9 | 0.1 | 3 | 84 | 12 | 2 | Considerable | Nil (2 hrs) Nil (20 hrs) | Nil (2 hrs) Nil (20 hrs) |
C 120-150+ | NS | NS | <0.05 | 1.9 | 0.55 | <0.05 | 150 | 2.6 | 0.1 | 2 | 75 | 22 | 2 | Considerable | Nil (2 hrs) Nil (20 hrs) | Nil (2 hrs) Nil (20 hrs) |
Fingerboards soil pit Easting 550528900 Northing 5817000
Horizon Depth cm | Colour | Texture | Gravel | Lime | Coarse Sand %w/w | Fine Sand %w/w | Silt %w/w | Clay % w/w | pH-H2O | pH CaCl2 | Exch. H cmol(+)/kg) | EC dS/m | TSS %w/w | Total C %w/w | Org. Mat %w/w | Total N %w/w |
A1 0-15 | Very dark greyish brown | Loamy sand | NS | NS | 36.9 | 38.6 | 7 | 10 | 5.7 | 4.5 | 12 | 0.19 | 0.06 | NS | 6.8 | 0.26 |
A2 15-27 | Pale brown, light grey | Sand | NS | NS | 38.7 | 43.0 | 6.5 | 10.5 | 6.0 | 4.5 | 4.3 | <0.05 | 0.02 | NS | NS | NS |
B21 27-90 | Yellowish brown, distinct strong brown mottles | Heavy clay | NS | NS | 19.8 | 26.8 | 9 | 42 | 6.6 | 6.4 | 4.9 | 0.19 | 0.06 | NS | NS | NS |
B22 90-120+ | Yellowish brown, distinct grey and red mottles | Heavy clay | NS | NS | 18.0 | 25.9 | 11 | 43 | 8.0 | 7.2 | ns | 0.31 | 0.11 | NS | NS | NS |
Horizon Depth cm | Total P mg/kg | Olsen P mg/kg | Exch. Ca cmol(+)/kg | Exch. Mg cmol(+)/kg | Exch. Na cmol(+)/kg | Exch. K cmol(+)/kg | Exch. Al mg/kg | CEC cmol(+)/kg | Ca:Mg | %Ca % | %Mg % | %Na % (ESP) | %K % | Slaking | Dispersion Test Dry | Dispersion Test Remoulded |
A1 0-15 | NS | NS | 4.6 | 1.3 | 0.44 | 0.81 | <10 | 7.2 | 3.6 | 65 | 19 | 7 | 12 | Water stable | Nil (2 hours), Nil (20 hours) | Nil (2 hours), Nil (20 hours) |
A2 15-27 | NS | NS | 0.85 | 0.36 | 0.11 | 0.24 | <10 | 1.6 | 2.4 | 55 | 23 | 7 | 16 | Partial | Nil (2 hours), Nil (20 hours) | Slight (2 hours), Slight (20 hours) |
B21 27-90 | NS | NS | 1.7 | 8.2 | 1.8 | 0.62 | ns | 12 | 0.2 | 14 | 67 | 15 | 5 | Partial | Strong(2hours), Strong(20hours) | Strong (2 hours), Complete (20 hours) |
B22 90-120+ | NS | NS | 0.5 | 8.7 | 2.8 | 0.3 | <10 | 12 | 0.1 | 4 | 71 | 23 | 3 | Considerable | Moderate (2 hours), Strong (20 hours) | Moderate (2 hours), Complete (20 hours) |
Angus Vale soil pit Easting 550531400 Northing 5840400
Horizon Depth cm | Colour | Texture | Gravel | Lime | Coarse Sand %w/w | Fine Sand %w/w | Silt %w/w | Clay % w/w | pH-H2O | pH CaCl2 | Exch. H cmol(+)/kg) | EC dS/m | TSS %w/w | Total C %w/w | Org. Mat %w/w | Total N %w/w |
A11 0-15 | Dark reddish brown | Fine sandy clay loam | NS | NS | 23.6 | 39.0 | 12.5 | 14.5 | 5.9 | 4.9 | 12 | 0.06 | 0.02 | NS | 5.5 | 0.26 |
A12 15-30 | Reddish brown | Fine sandy clay loam | NS | NS | 35.0 | 37.6 | 10 | 15.5 | 6.5 | 5.4 | 6.4 | <0.05 | 0.02 | NS | 1.5 | 0.08 |
B2 30-55 | Reddish brown | Medium clay (sandy) | NS | NS | 28.8 | 40.0 | 10 | 19.5 | 7.3 | 6.6 | 5.2 | <0.05 | 0.02 | NS | NS | NS |
B3 55-90 | Reddish brown | Light clay (sandy) | NS | NS | 14.6 | 30.4 | 10 | 40.5 | 7.1 | 6.4 | 7.9 | <005 | 0.02 | NS | NS | NS |
Horizon Depth cm | Total P mg/kg | Olsen P mg/kg | Exch. Ca cmol(+)/kg | Exch. Mg cmol(+)/kg | Exch. Na cmol(+)/kg | Exch. K cmol(+)/kg | Exch. Al mg/kg | CEC cmol(+)/kg | Ca:Mg | %Ca % | %Mg % | %Na % (ESP) | %K % | Slaking | Dispersion Test Dry | Dispersion Test Remoulded |
A11 0-15 | NS | NS | 4.1 | 1.5 | 0.15 | 1 | <10 | 6.8 | 2.8 | 61 | 23 | 3 | 15 | Water stable | Nil (2 hrs) Nil (20 hrs) | Nil (2 hrs) Nil (20 hrs) |
A12 15-30 | NS | NS | 4.9 | 1.8 | 0.13 | 0.58 | NS | 7.4 | 2.8 | 67 | 25 | 2 | 8 | Partial | Nil (2 hrs) Nil (20 hrs) | Nil (2 hrs) Slight (20 hrs) |
B2 30-55 | NS | NS | 12 | 8.1 | 0.21 | 0.11 | NS | 21 | 1.5 | 59 | 40 | 1 | 1 | Considerable | Nil (2 hrs) Nil (20 hrs) | Nil (2 hrs) Slight (20 hrs) |
B3 55-90 | NS | NS | 12 | 6.9 | 0.17 | 0.61 | NS | 20 | 1.8 | 61 | 35 | 1 | 3 | Considerable | Nil (2 hrs) Nil (20 hrs) | Nil (2 hrs) Slight (20 hrs) |
Appendix two - Tunnel erosion brochure
Download the PDF version of this document: Tunnel erosion - An early identification guide for East Gippsland (PDF - 6.6MB)
To view the information PDF requires the use of a PDF reader. This can be installed for free from the Adobe website (external link).
Appendix three - Erosion Hazard Identification Sheets
Gully Rating
| Officer: | Date: |
| Landholder: | |
| Farm Location: | |
| Gully Location: (GPS point) | |
| Location: (Distance from major River or Stream) | Rating Factor: | Rating: | |
> 3000 m | 2 | ||
1000 - 3000 | 5 | Total (max 10) | |
<1000 m | 10 | ||
Description of existing Erosion: | |||
Depth of Gully | |||
1-2 m | 2 | ||
2-4 m | 5 | ||
>4 m | 10 | ||
Length of Gully | |||
<20 m | 2 | ||
20-100 m | 5 | ||
>100 m | 10 | ||
Average Width of Gully | |||
<10 m | 2 | ||
10-20 m | 5 | ||
>100 m | 10 | ||
Gully head development | |||
1-2 heads | 2 | ||
2-3 heads | 5 | ||
> heads | 10 | ||
Development of secondary heads | |||
No secondary heads forming | 2 | ||
1-2 forming | 5 | ||
>3 forming | 10 | ||
Sidewall undercutting and slumping | |||
isolated | 2 | ||
Frequent | 5 | Total (max 60) | |
Continuous | 10 | ||
Vegetation | |||
Native Pasture | 2 | ||
Improved Pasture | 5 | ||
Semi-cleared (10-20 trees per ha) | 10 | Total (max 20) | |
Forest | 20 | ||
Total Rating for Gully (Max 90) | |||
Tunnel Erosion
| Officer: | Date: |
| Landholder: | |
| Farm Location: | |
| Gully Location: (GPS point) | |
| Location: (Distance from major River or Stream) | Rating Factor: | Rating: | |
> 3000 m | 2 | ||
1000 - 3000 | 5 | Total (max 10) | |
<1000 m | 10 | ||
Tunnel Characteristics | |||
Number of known tunnels | |||
active | 5 | ||
inactive | 2 | ||
Visual condition | |||
fully (all tunnels collapsed) | 10 | ||
partial (some tunnel) | 5 | ||
outlets visible (only) | 2 | ||
Approximate average depth | |||
<1 m | 2 | ||
1 - 2 m | 2 | ||
>2 m | 2 | ||
Approximate tunnel inlet/outlet size | |||
<15 cm | 2 | ||
15 - 30 cm | 2 | ||
30 - 60 cm | 5 | ||
> 30 cm | 10 | ||
Catchment type | |||
Open | 10 | ||
Closed | 5 | ||
Catchment Slope: | |||
Gentle <4 % | |||
Moderate 4-20% | |||
Steep >20% | |||
Vegetation | |||
Native Pasture | 10 | ||
Improved Pasture | 10 | ||
Semi-cleared (10-20 trees per ha) | 5 | Total (max 57) | |
Forest | 2 | ||
Total Rating for Gully (Max 67) | |||
Appendix four - Feedback results for past 4 years
Table 1 Collated information of survey respondents for past four years of the tunnel erosion rehabilitation project 2004 to 2008.
| Question | Poor % | Satisfied % | Good % | Excellent % | Not Answered % | |
A | Level of technical knowledge of DPI Staff | 0 | 3 | 31.5 | 65.5 | 0 |
B | Was the written information provided easy to understand? | 0 | 10.5 | 45 | 34 | 4 |
C | Were the on ground works were managed to your satisfaction | 3 | 5 | 42 | 47 | 3 |
D | Your roles and responsibilities in the project were well defined before commencement of works | 3 | 5 | 29 | 60 | 3 |
E | Were the private contractors obliging and easy to communicate with | 0 | 4 | 43 | 39 | 13 |
F | How approachable were the staff involved | 0 | 9 | 30 | 44 | 17 |
G | Overall how well do you think the project was managed by DPI staff? | 3 | 20 | 37 | 37 | 3 |
J | If you attended a field day was the information presented relevant? | 0 | 0 | 35 | 13 | 52 |
I | Overall how well do you think the project was managed by DPI staff? | 0 | 5 | 24 | 68 | 3 |
Overall 97% of respondents said they would participate in another project if funding was available; 3% provided no answer.
Appendix five - Tunnel erosion case studies
Howden | Kennedy
Rehabilitation of tunnel erosion in East Gippsland: the Howden’s story
Rain is usually a blessing, but for Trevor and Peggy Howden, who run a beef and sheep operation in the foothills at Glenaladale near Bairnsdale, it was often a nightmare. Worsening tunnel erosion was ripping tonnes of valuable soil from their paddocks, and – in Trevor’s words – “literally sending it down the plughole”. Their paddocks were becoming more and more unstable, and in some places, unusable. The situation further down the Mitchell River wasn’t great either. The sedimentation from the heavy clay was wreaking havoc at the pumping station, and there was a risk that nutrients were flowing further downstream into the Gippsland Lakes.
| It seemed there was nothing they could do to but sit back and watch as the tunnel erosion continued to degrade the farm, and their livelihood. “Tunnel erosion’s a slow death,” says Trevor. “We tried various ways of filling it in, but nothing seemed to halt it. We were struggling to work out how to get on top of it.” Fortunately, a project run by the Department of Primary Industries gave them the opportunity to determine the extent of the tunnel erosion problem affecting both their property and many others in the district, and to trial a new strategy for rehabilitating problem areas. The five-year trial wasn’t for the fainthearted, however. The strategy - which involves ripping the soil to a depth of about one metre, adding large amounts of gypsum ,and then renovating the pasture with perennial species and/or an annual crop – is time consuming, messy, and requires a significant time and labour commitment from landholders. Ultimately, though, both Trevor and Peggy believe it’s been worth it, and plan to continue rehabilitating problem areas on their property. “It can be daunting to deal with, but we’ve had a 99% success rate,” says Trevor. “Productivity has increased by at least 100%, and we’ve now got magnificent feed where before, we couldn’t even get the grass to grow.” Identifying priority areas The project began with a GPS survey and soil profiles to determine what was actually going on ‘beneath their feet’. “It gave us a whole picture of what was going on,” recalls Trevor. "You often don’t realize that you have these enormous hollow areas until you get stuck in the ute, or you have wet weather and all of a sudden you’ve got all these tunnels and water spurting up out of the ground.” | 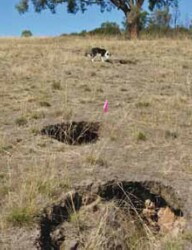 |
In the past, strategies for dealing with tunnel erosion have involved fencing off and revegetating the affected areas. With a large proportion of the Howdens’ farm affected by tunnel erosion, this approach was neither practical nor feasible. Instead, it was decided to apply gypsum at the rate of 4 tonne per ha to reduce the ability of the clay to disperse (or dissolve) in water, and to collapse the tunnels using single pass deep ripping on the contour. For the best results, the riplines needed to be one metre deep and one metre apart, and carried out over the whole local paddock catchment area. The pasture was then re-established using an annual ryegrass, with the intention of planting perennial species when the topsoil has settled.
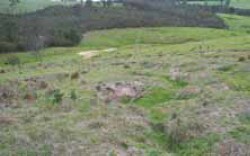 |
|
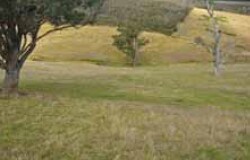 |
The Howdens sowed their rehabilitated paddocks with either an annual ryegrass, or a perennial pasture based on cocksfoot, shortly after the groundwork was completed and before it rained. This cost them around $150/ha for both seed and fertiliser. (Some steep areas which were impractical to graze were replanted with indigenous tree species.) In most cases, the results were excellent, but they faced difficulties in the north facing areas with little topsoil. Trevor says that in hindsight, waiting twelve months and putting in an annual cover crop such as rape would increase the chances of success.
Benefits
Trevor says that productivity has more than doubled in the rehabilitated paddocks, thanks to the significant increase in pasture production and quality. He gives the example of a 6 ha paddock that prior to rehabilitation produced a maximum of 4 tonnes DM/ha/ year – made up of a mixture of annual weeds and grasses. Since rehabilitation, Trevor has both strip grazed and cut hay from the same paddock, and estimates production to be 8.8 tonnes DM/ha/year of high quality feed.
While some may argue that the increase in productivity is due to the pasture renovation, Trevor says that they would never have renovated their pastures if they had not first carried out the rehabilitation works with the DPI. “There’s no point in renovating pasture when you’ve got tunnel erosion because all your topsoil just disappears down the holes.”
They also have the additional benefits that the paddocks are now safe for both livestock and people, and accessible by vehicle.
Rehabilitation of tunnel erosion in East Gippsland: the Kennedy’s story
| When Bairnsdale dairy farmer, Charlie Kennedy, first came to the area in 1957, tunnel erosion was already a problem, but nothing like it is now. Charlie believes that around half of his 400 acres has been affected by tunnel erosion, with severe impacts. “The clay just oozes out of the good country and into the rivers and streams,” he says. “In some places, where it’s really bad, you can’t do anything with it, because you can’t even get your tractor across it.” Charlie and his wife Heather tried many strategies to halt or even slow the erosion, but to no avail. “The tunnels were a haven for rabbits and other vermin, and they were making the problem worse,” he recalls. “We just didn’t have the resources to get to the bottom of it.” Today, Charlie can’t believe the difference. The erosion has stopped, and land that was once inaccessible is now producing good quality crops (oats, cape barley and rye corn) and silage. In fact, the improvement in productivity has been so great that Charlie is contemplating increasing the size of his herd from 100 to 140 (ten cows higher than before the drought). Charlie’s also feeling more confident about his son Danny taking over the farm sometime in the future. “All this hard work will be behind him,” he says. | 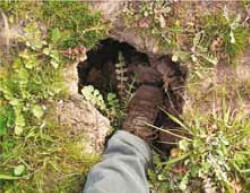 |
The process
The aims of the rehabilitation process adopted by the DPI are twofold. The first is to alter the structure of the subsoil to prevent it dispersing – and thus leaving the property – in water. The second is to provide deep-rooted vegetative cover as soon as possible to stabilize and protect the soil.
Importantly, it is the entire local paddock catchment area, and not just the eroded area, that needs to be rehabilitated for the treatment to be successful. In the Kennedys’ case, this involved a 30 ha area on a north facing hillside.
The aims are achieved via a series of steps, all of which require landowner involvement. The first step involves taking off the topsoil and placing it to one side so that the rip lines will extend past the depth of the tunnels, and the addition of gypsum at a rate of four tonnes per ha to the subsoil.
The land is then deep-ripped to the depth of the erosion (in the Kennedys’ case, to one metre), with the rip lines one metre apart, over the entire local paddock catchment area ie from top to bottom, excluding gullies. “There were two rippers on the back of the dozer,” recalls Charlie, “and they straddled the bottom rip mark as they worked over the entire hillside.”
The purpose of the deep ripping is to collapse the tunnels, and encourage water to spread evenly through the affected area.
Charlie immediately set about cleaning up the paddock (“they brought up a lot of rocks”) and working it in preparation for planting before rain came. “Deep ripping isn’t ploughing,” he says. “It’s the farmer’s responsibility to cultivate the surface as soon as possible.”
Charlie worked the soil with a chisel plough, following the same contour lines created by the dozer, then leveled it. “For a quick crop like rape or turnips, you could plant it straight after, but in my view, as soon as the dozer leaves, you get your tractor and start to harrow. The quicker you get that country back to a bit of coverage the better.”
Benefits
Charlie’s efforts at cultivation certainly paid off. “I reckon I’ve had at least 50% more silage – as a dairy farmer, that’s really important. There’s a direct link between silage and milk production.”
He’s also had success with crops planted on the rehabilitated area, which – before the DPI stepped in – was practically inaccessible. As well as deep-rooted grasses, Charlie planted a winter crop of oats, cape barley and rye corn, and this season, plans to plant red wheat and oats.
Charlie advises soil testing immediately after the addition of gypsum to ensure the best results for any planting. “We found that we needed lime to balance things out, as well as one-on-one potash.”
More importantly, however, is the commitment and follow-through of the landowner. “DPI have achieved more in two years than anything we tried to do, but it would’ve come to nothing if we didn’t get some deep rooted cover on the land as soon as possible,” said Charlie.
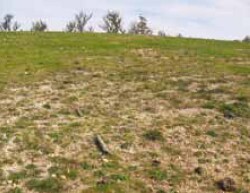 | 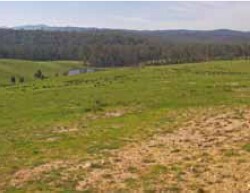 | 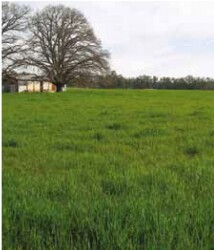 |
© State of Victoria (Agriculture Victoria) 1996 - 2025.

This work, Victorian Resources Online, is licensed under a Creative Commons Attribution 4.0 licence. You are free to re-use the work under that licence, on the condition that you credit the State of Victoria (Agriculture Victoria) as author, indicate if changes were made and comply with the other licence terms.
The licence does not apply to ‘branding’ or some ‘images or photographs’ that may be owned by third parties. We ask you to seek prior approval to use images using the VRO feedback form. Access to higher quality images can also be provided on request.
This page was last updated on 23/03/2020.