
East Gippsland Soil Erosion Management Plan Appendices
The EGCMA can be divided up on geomorphological (physiographic) grounds at a range of scales. The following divisions are based on the most recent scheme and descriptions developed by the Victorian Geomorphological Reference Group (VGRG) as shown on the Victoria’s Resources Online (VRO) website (Victoria’s Resources Online - http://www.dpi.vic.gov.au/vro
http://www.dpi.vic.gov.au/dpi/vro/vrosite.nsf/pages/landform_geomorphology
The broadest division of the scheme for the EGCMA comprises the Eastern Uplands, the Eastern Plains and the Coastal Features. The Uplands comprise 86% of the EGCMA, while the Eastern Plains comprise 13% and the Coastal Features 1%.
The Eastern Uplands (EU) have been subdivided into Low relief above 1200 metres, Low relief between 500 and 1200 metres, Low relief below 500 m and Dissected relief (Figure 29).
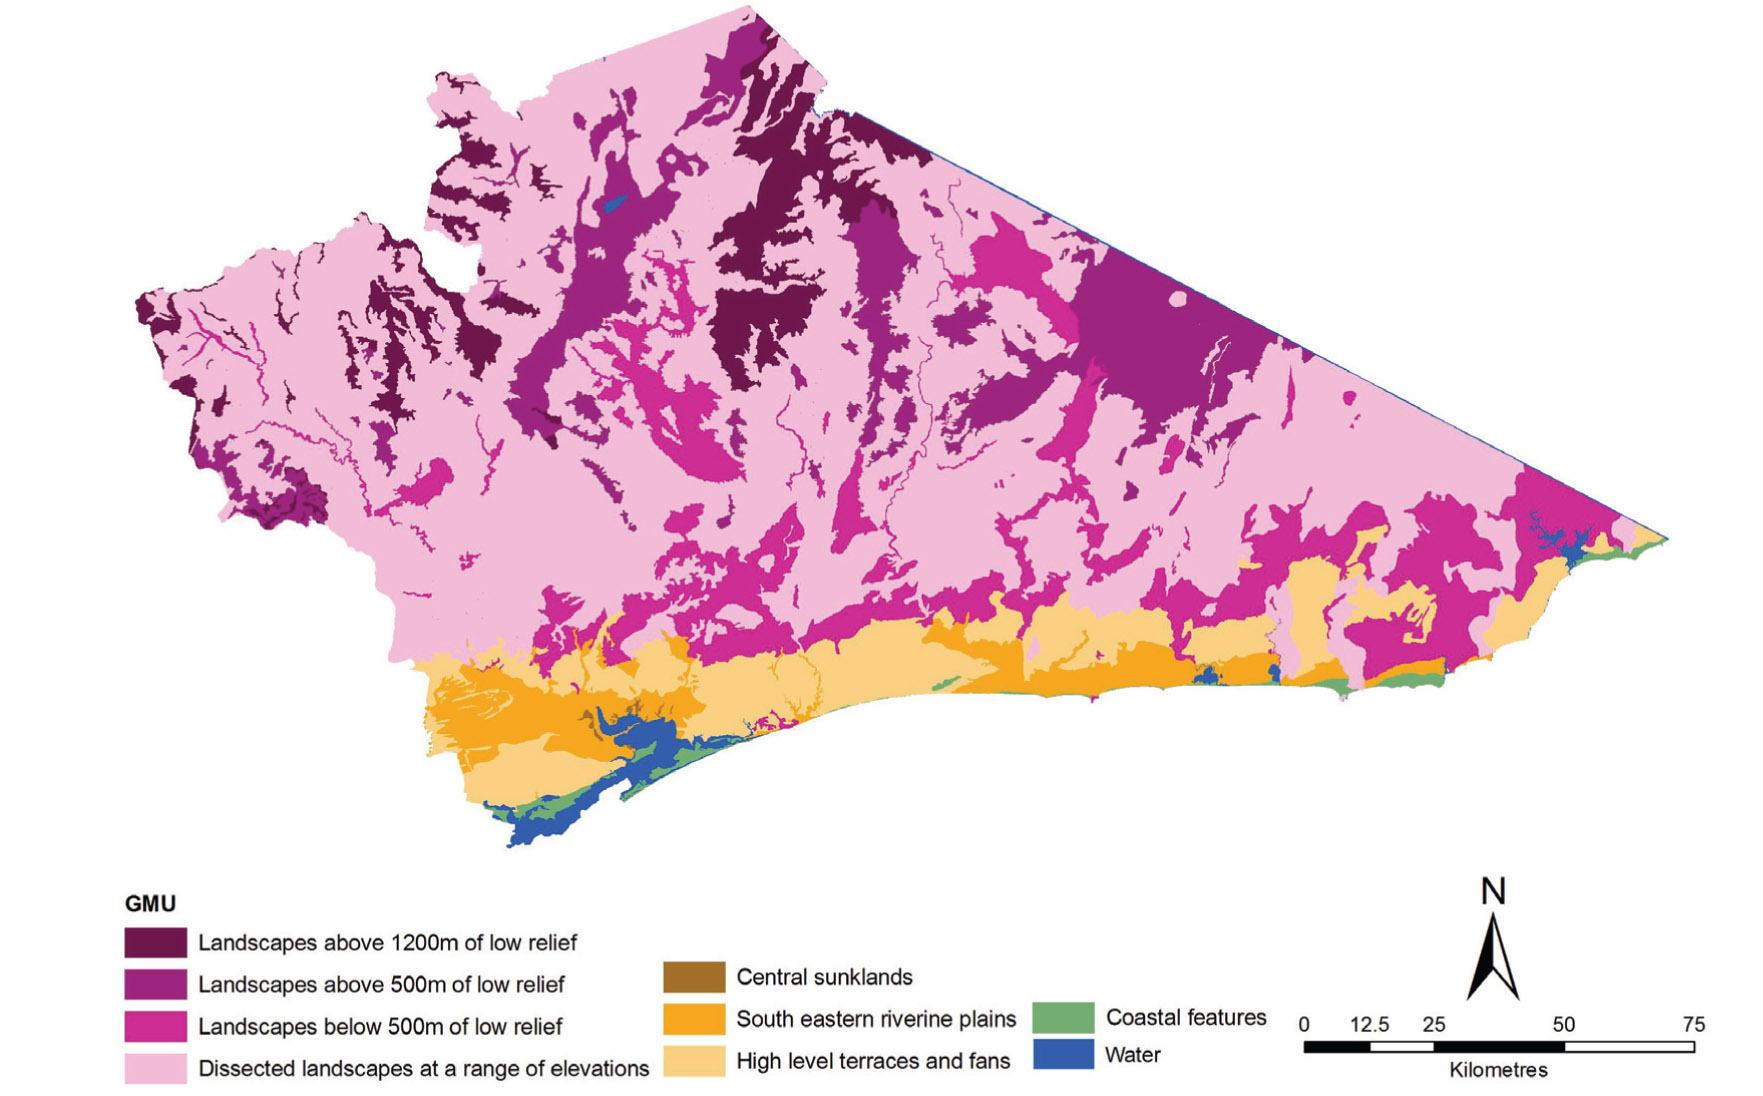 Figure 28: Geomorphological map of East Gippsland showing tier 2 of the GMU scheme (created from the Geomorphological Unit spatial dataset held by the Department of Primary Industries Victoria) | The Low relief above 1200 metres includes Summit plateau, Broad ridges and plateau, Enclosed landscapes and Capped plains. These features comprise the high plains country which includes sub-alpine climate and vegetation that makes the area distinctive and used for a range of purposes, now predominantly recreation (skiing, walking etc), water production and predominantly national park in terms of land tenure. The landscape has been developed on Palaeozoic sediments and granitics with basalt comprising the capping for some of the plains. Soil types include organic rich loams (Organosols), stony shallow soils (Rudosols, Tenosols) and variably drained gradational soils (Dermosols and Kandosols). The Low relief between 500 and 1200 m consists of Plateau and broad ridges and Enclosed landscapes, much of which has been cleared. Land use is often dependent on local climate as to grazing regime or other uses such as native or plantation forestry. Major examples include the Erinundra Plateau (an extension of the Monaro plateau from NSW) and the Benambra area. Differential weathering of lithologies often results in such forms. Soil types include friable red and brown Dermosols and Kandosols as well as texture contrast soils (brown Chromosols and Kurosols). |
Low relief below 500 m consists of Low landscapes, Enclosed landscapes, Terraces and floodplains as well as the distinctive Karst terrain. While most of the terrain is on consolidated material, the terraces and floodplains are the only geomorphological subdivisions partly on unconsolidated material such as the Deddick and Wonangatta River valleys. Low landscapes include areas south of Cann River in the Croajingolong National Park and the foothills of the uplands such as the Bruthen area where Neogene outwash material abuts the consolidated Palaeozoic sediments. Karst landscapes occur around Buchan and Bindi; an example of a particular lithology producing a distinctive landscape that has been utilized for agricultural production. Soil types include Brown and Grey Chromosols, Sodosols and Kurosols with sandy surfaces on most of this area but distinctive strongly structured shallow Calcarosols and Dermosols occurring on limestone.
Dissected landscapes occur at a range of elevations, characterised by steeper slopes. Sub-divisions comprise Summits, Escarpments and gorges, Deeply dissected and, Moderately dissected landscapes and Outlying ridges and hills. Summits may have grassland vegetation if above the tree-line, while a range of climatic conditions from base to summit is expressed as a range of tree species from Alpine Ash and Snow Gums at higher altitudes to Stringybarks at lower elevations. Drainage lines and sheltered aspects may well contain cool temperate and warm temperate rainforest. Much of the land is public land tenure consisting of State Forest and National Park, with conservation, forestry, water production and tourism being major uses. Soil types include acidic red and brown Dermosols in the moister areas with texture contrast soils (brown, grey Chromosols and Sodosols) in the drier areas.
The Eastern Plains (EP) have been subdivided (Tier 2) into Central sunklands, South eastern riverine plains and High level terraces. There are minimal occurrences of the Central sunklands in the EGCMA. The South eastern riverine plains occur in the south west of the EGCMA and are mostly freehold and cleared for agriculture. These comprise Floodplains and morasses, Prior stream plains, Older alluvial plains and Plains with dunes and are the lowest landforms in the EGCMA. Land use is determined by climate as well as soil. Moister areas and those with more favourable soils in conjunction with irrigation, favour more intensive uses such as dairying or cropping. Drier areas tend to support sheep grazing having lower nutrient levels and older soils which may exhibit salinity. Plains with dunes are variable in terms of moisture characteristics (drainage) and topography (dunes and plains/swales). Soil types are predominantly texture contrast (brown, grey and yellow Sodosols and Chromosols), dark clayey (black and grey Vertosols) and some gradational medium to heavy soils.
The Higher terraces and fans occur in the south, higher in elevation than the riverine plains, often abutting the Eastern Uplands. This grouping comprises Plains (with or without dunes) and Dissected plains (with or without dunes), Dunefields and Terraces on bedrock (occurring around Mallacoota). Soils tend to be older with greater differentiation (texture contrast) with variable topsoil or sand sheet depending on location. Soil types are texture contrast (brown, grey and yellow Sodosols, Chromosols and Kurosols) and uniform sandy soils (Podosols or Kandosols) where coarser material dominates.
The Coastal features (C) have been subdivided into Stranded cliffs, Coastal barriers, Transgressive dunes and Low coasts. Examples of Stranded cliffs occur in the Gippsland Lakes area, Coastal barriers as at Ninety Mile Beach, Transgressive dunes at Marlo and Low coasts at Tamboon Inlet and Wingan Inlet for example. There are many other interesting coastal locations that have inspired special management for their range of values, such as recreation including fishing, at Mallacoota Inlet.
Appendix B: Land Use Impact Model (LUIM)
The LUIM model is available for free download from the University of Queensland.
Applications of LUIM
LUIM has evolved through its application in a number of land assessment studies across Victoria. It was first employed in a Victorian Catchments Indicator project in 2001 to assess the mismatch between land use and land capability and has since been used to:
- assess risk to wetlands posed by irrigation development in the Loddon-Murray region
- assess risk to biodiversity from adjacent land management practices
- derive priority settings for a soil health strategy in the Corangamite CMA
- assess the impact of existing and proposed NRM plans for the dryland areas of the Mallee (as part of the Lower Murray Landscape Futures project)
- assess the risk of soil erosion in West Gippsland (CMA), and
- assess the likelihood of occurrence of wind erosion for the Mallee CMA region. In this project remote sensing data was used to provide high resolution land use information to support the LUIM likelihood assessment.
The matrices can be modified according to the weight of influence that is decided to be applied to each component. For example if a review of the model’s likelihood outputs suggest more influence be placed on management practices then the matrix can be skewed to favour the management component.
Table 14: Example of the Likelihood matrix combining susceptibility ratings with management ratings
| Management Practices | Susceptibility | ||||
Very low | Low | Moderate | High | Very High | |
| Strongly negative | Very low | Moderate | High | Very high | Very high |
| Moderately negative | Very low | Low | Moderate | High | Very high |
| Weakly negative | Very low | Low | Low | Moderate | High |
| Neutral | Very low | Very low | Very low | Low | Low |
| Beneficial | Very low | Very low | Very low | Low | Low |
A flow diagram (Figure 29) describes the modelling process.
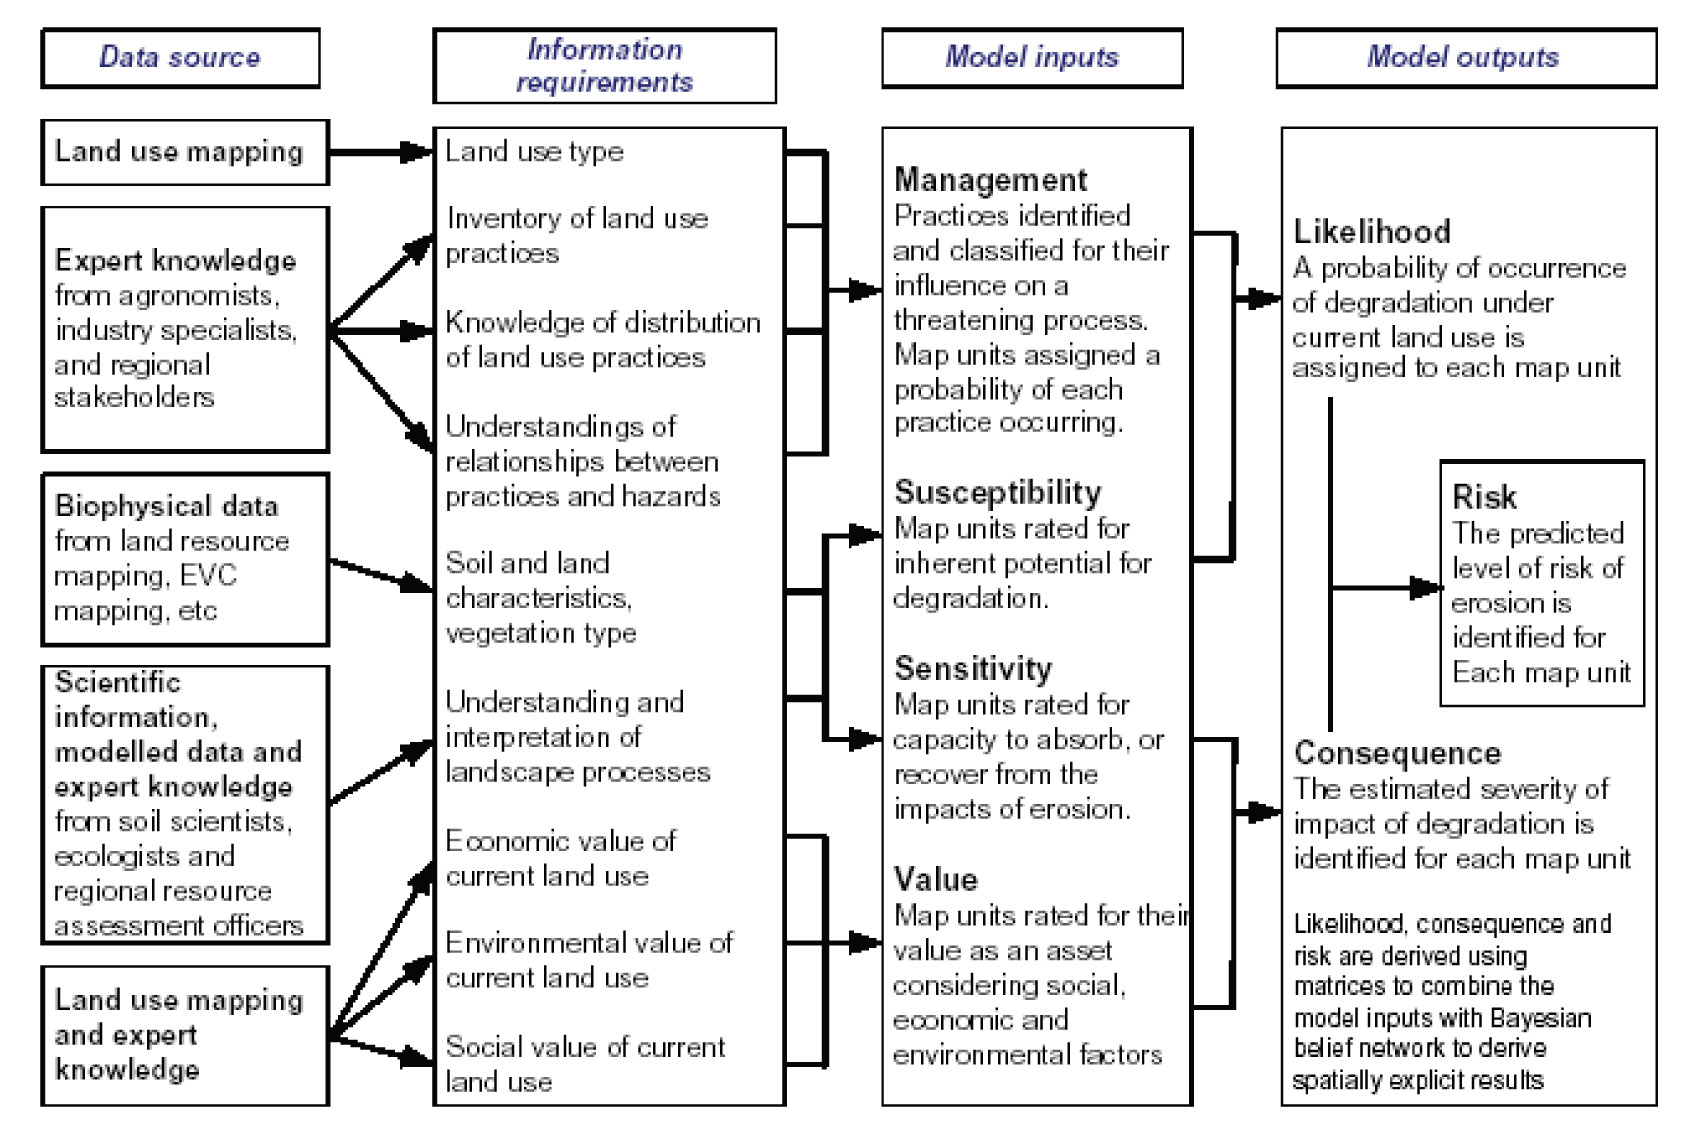
Figure 29: Diagram showing the interactions between the data inputs, model components and model outputs (taken from McNeil et al 2007
The LUIM framework operates on individual map units that have been created by combining the input spatial datasets.
Bayesian Belief Network
A Bayesian Belief Network (BBN) is a probabilistic graphical model that enables a direct representation of causal relations between input variables. Its structure is ideal for combining process knowledge with observed data. Each node within the graphical structure of the network represents an input variable whose value may have a level of uncertainty attached to it. The links between the nodes represent direct dependence among the variables. BBNs were originally developed to enable uncertainty in information used to form decisions to be explicitly accounted for (Cain 2001).
In the context of natural resource management spatial data has uncertainty in terms of the scale and type of information available and as such map units inevitably have some uncertainty associated with them. For example, map units are often assigned a dominant soil type where in reality they contain a mixture of different soil types. If knowledge of the mix of soil types is available then this information can be applied as probabilities within a BBN. In this way uncertainty in land attributes or within map units can be facilitated without the need to generalise the input data to an unacceptable extent.
The LUIM risk framework provides the structure for a BBN with each component being represented by a node in the network (Figure 30). The core framework components are fixed in the network whilst the attributes that contribute to the assessment of each component are added when the model is built (Figure 31). The example in Figure 31 is for soil erosion however the basic BBN can be modified for any application according to the land degradation issue being assessed to reflect the criteria and rules used to derive the core LUIM components. The created BBN is applied to all map units (polygons) within LUIM’s input dataset.
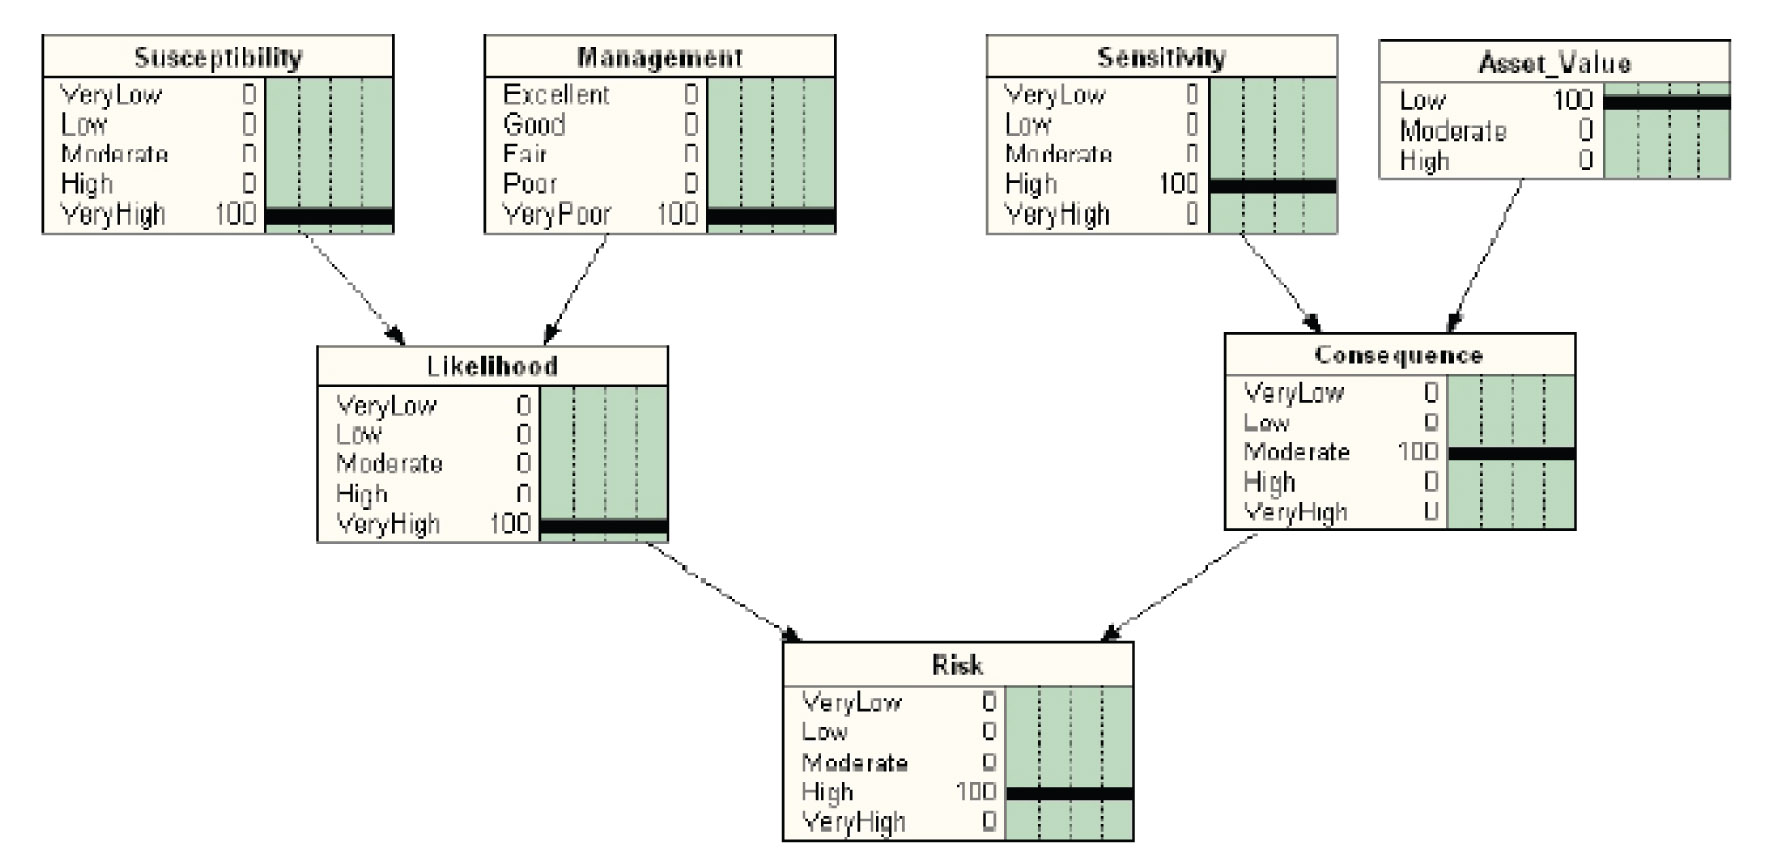
Figure 30: The basic structure of the BBN incorporated into LUIM.
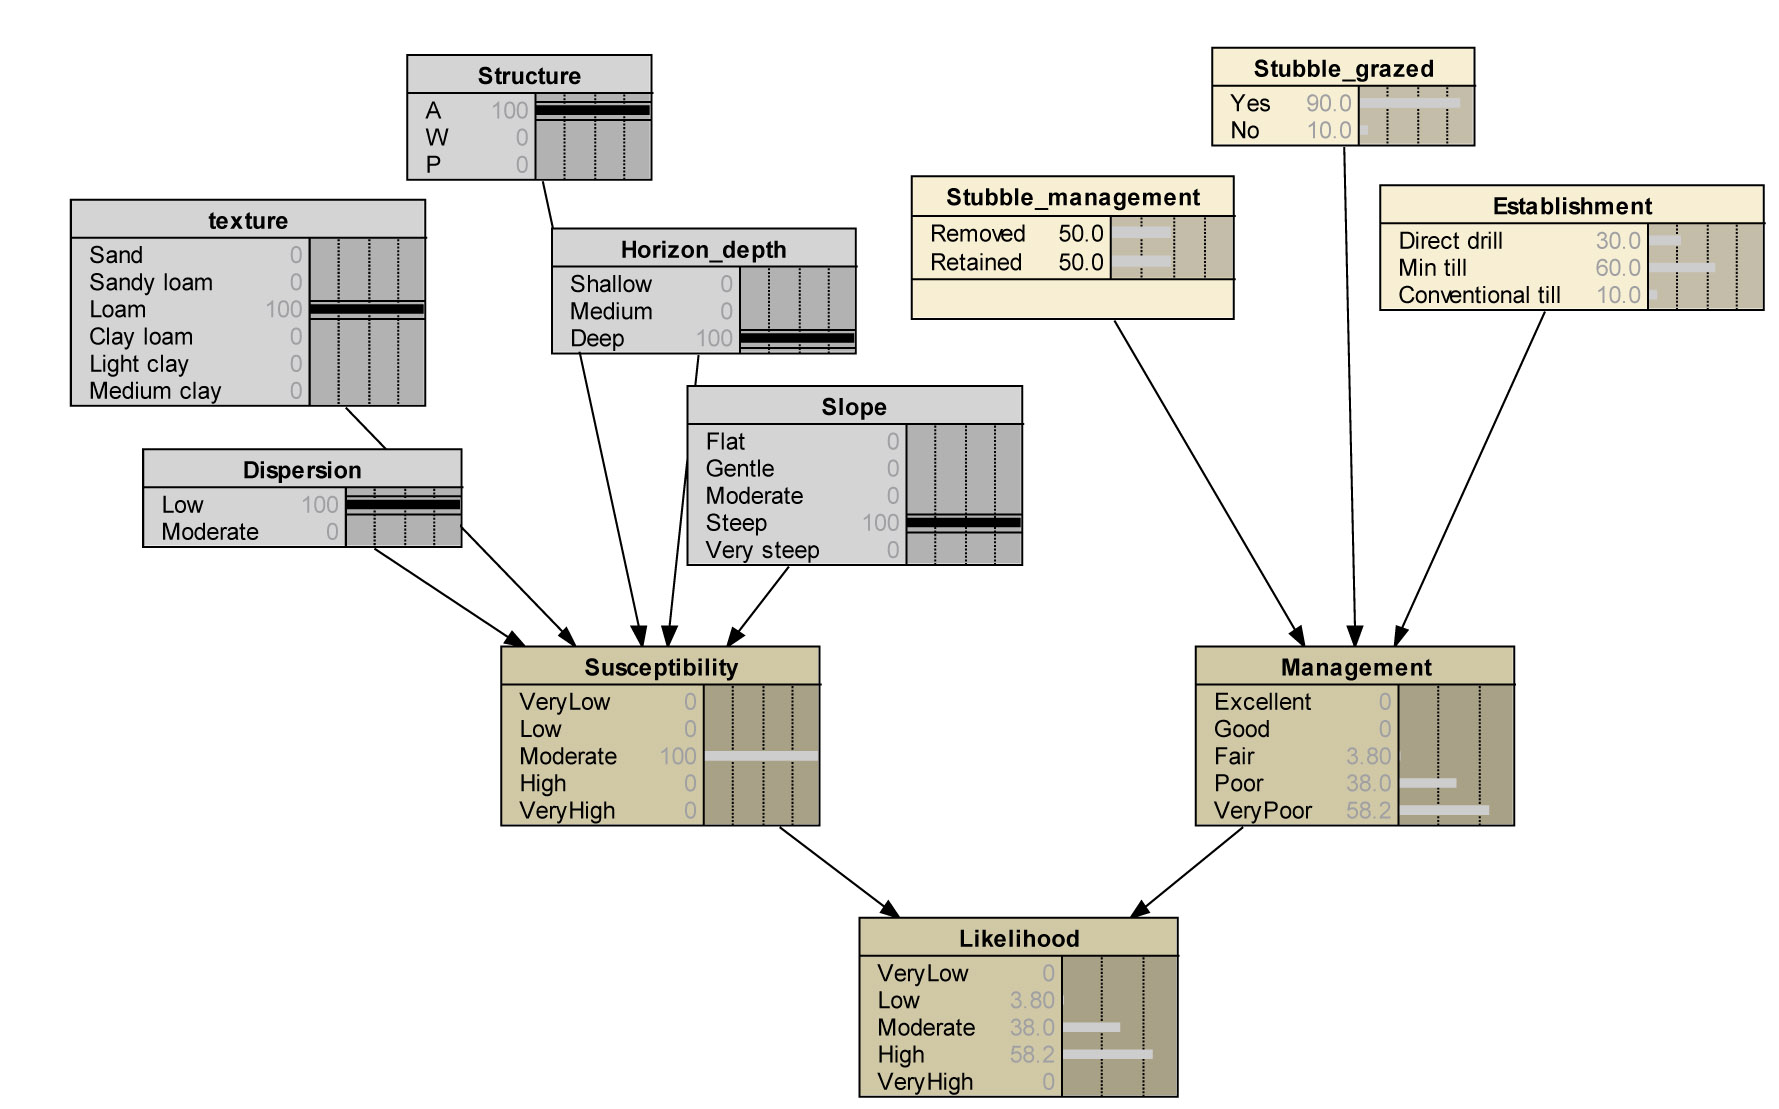
Figure 31: An example of the BBN created fro the likelihood half of the risk framework
This BBN in Figure 31 shows how soil and slope attributes comprise the assessment of susceptibility, how the probabilistic distribution of management practices contribute to management, and how management and susceptibility are combined to give a likelihood assessment. The Likelihood rating with the highest probability is allocated to the map unit being considered. The higher the rating probability, the greater the level of certainty attached to the allocation of that rating. This network and assessment application is applied to each map unit and is the same process for consequence and risk.
The values of any component contributing to the network can be homogenous or heterogeneous for a map unit (ie: certain or uncertain). This is established during the creation of the model through the development of deterministic (certain) or probabilistic (uncertain) classification tables. In this study uncertainty is only applied to the distribution of land management practices across the study area. This means that for susceptibility, sensitivity and asset value components of the framework an absolute value was applied to each map unit whilst for management a distribution of values was applied. These probability distributions for management practices are contained within the management node of the BBN. This is necessary as whilst we can readily compile an inventory of management practices it is often impossible to map these to their occurrence in the landscape.
| In the example in Figure 31, the nodes that connect to the Management node (establishment, stubble management, stubble grazed) represent the management options for a particular land use (in this case cropping) that impact a threatening process and the associated probabilities of them occurring within the map unit being assessed. The five nodes connecting to the susceptibility node represent the attributes considered to be important in a map unit’s susceptibility to a threatening process (in this case sheet and rill erosion). As no uncertainty is attached to these attributes each is given a probability score of 100%. Each contributing node in the BBN, and its associated probability, is informing the BBN and influencing the outcome which, in this case is represented by the probability scores in the Likelihood node. The likelihood rating with the highest score is allocated to that particular map unit and the level of uncertainty portrayed as the sum of the remaining scores. In this example, the likelihood rating of High would be applied with an uncertainty score of 38%. Specifications, requirements and data types LUIM was created as an extension within ESRI’s ArcGIS v9.1 and has recently been adapted to work with ArcGIS v9.2. The model uses the software Netica V1.05 to compile the BBNs, (Norsys, 1997). The LUIM GIS toolbar links to the BBN software and to the spatial data held in the GIS (Figure 32). LUIM is designed to work with polygonal vector data only. Any input raster datasets must first be converted to a polygonal data layer. The model works best when all spatial data that is to be used in the model framework is contained within a single layer. Data stored within multiple layers should be intersected to create a single input dataset. Furthermore this data layer must be in a geodatabase format before LUIM will recognise it. | 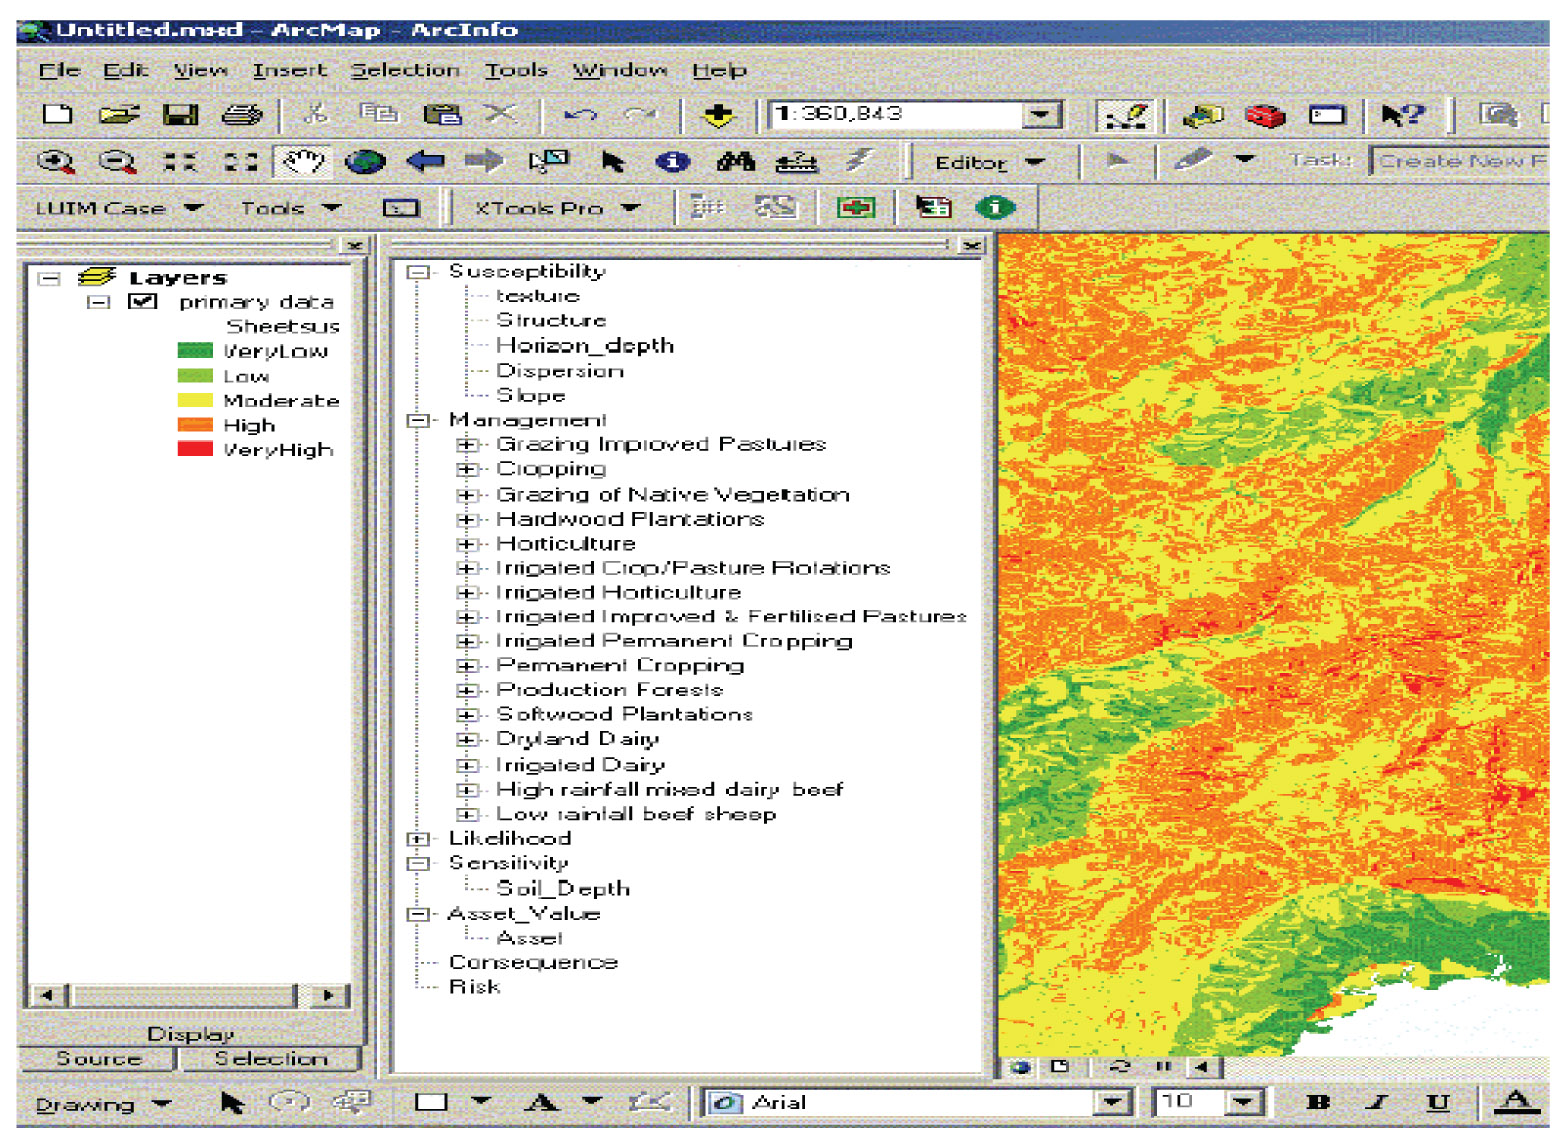 Figure 32: An example of the LUIM interface within ArcGIS. The input in the dataframe on the left is in the format of a geodatabase. The LUIM tree to the right shows the components of the risk framework which link to the BBN Netica software (taken from McNeill and MacEwan 2007). |
Data inputs and pre-processing
The LUIM requires all input spatial data to be contained within a single polygonal dataset held within a geodatabase. The polygons within this data layer are referred to as the primary map units. The primary map units used in this study were formed by intersecting three digital spatial datasets: soil and landform, land use and a Digital Elevation Model (DEM) (Table 15).
Each dataset underwent an amount of pre-processing before being combined to ensure the final dataset contained the necessary data and in the correct format for input into the model. Each resulting map unit thus contains a set of attributes describing soil type, slope and land use which are used to define the assets being evaluated for erosion risk and to directly assess the susceptibility, sensitivity and asset value components of the LUIM framework.
The soil data layer was sourced from survey work performed by soil scientist Ian Sargeant in the Bairnsdale and Dargo regions (Sargeant et al 2005) and survey work performed by David Rees of Department of Primary Industries Victoria Research (Rees 1996). The digital dataset derived from this work is at the 1:100 000 scale and contains soil information on freehold land.
The land use data layer was sourced from a previously mapped 1:25 000 scale land use map. The land use map was prepared under the NLWRA project of theme 5 (land use change, productivity and sustainability) for Gippsland. The original map data was collected in 1996-1997 and has recently been updated to reflect changes since that time. The data is based on four sources of information: resource data sets of Victoria held at the time by the Department of Natural Resources and Environment, satellite imagery, ABS agricultural statistics, and field information (Sposito et al 2000).
The land use classification scheme followed here is the Australia Land Use Mapping (ALUM) classification version 6 (Bureau of Rural Sciences 2006). The classification is hierarchical in nature, identifying primary, secondary, and tertiary levels. The five primary levels show a hierarchy in terms of human intervention in natural environment from (1) Conservation and the Natural Environment to (5) Intensive uses. The level to which a land use was described (primary, secondary or tertiary) depended on the quality of data available and the land use type itself. Therefore variability in the detail of land use classification across the study area existed. The land use data layer was supplemented with a production forestry shapefile of softwood and hardwood plantations in the region. This was obtained from Gippsland Private Forestry and incorporated recent blue gum plantations in the region.
The DEM was sourced from three catchment-wide raster datasets each at 1:100 000 scale: North East CMA, West Gippsland CMA and East Gippsland CMA DEMs. The three raster grids were merged using a map algebra expression in the raster calculator to produce a single raster grid. Using the spatial analyst extension a percent slope was derived which was then re-classified into seven integer slope classes based on Speight’s 1967 Definition of slope classes table contained in McDonald et al 1990.
| The seven class intervals were: 0-1% 1-3% 3-10% 10-20% 20-32% 32-56% >56% The raster layer was then generalised using the Majority Filter raster calculator function to remove isolated cell slope values (Figure 33). To facilitate the joining with the soil and the land use datasets the grid was converted to shapefile and then clipped to the study region (Figure 34). The land use and soil layers were processed separately before being intersected with the slope shape file. The combined shape file was then dissolved to reduce the number of records and the volume of data. The final pre-processing step was to convert the shape file into a geo-database with a single feature class. This feature class became the input layer used in the LUIM risk assessment. All the originally sourced input datasets were in the agd66 datum and were subsequently transformed to gda94 and then projected to mga zone 55 as part of the data pre-processing. |  |
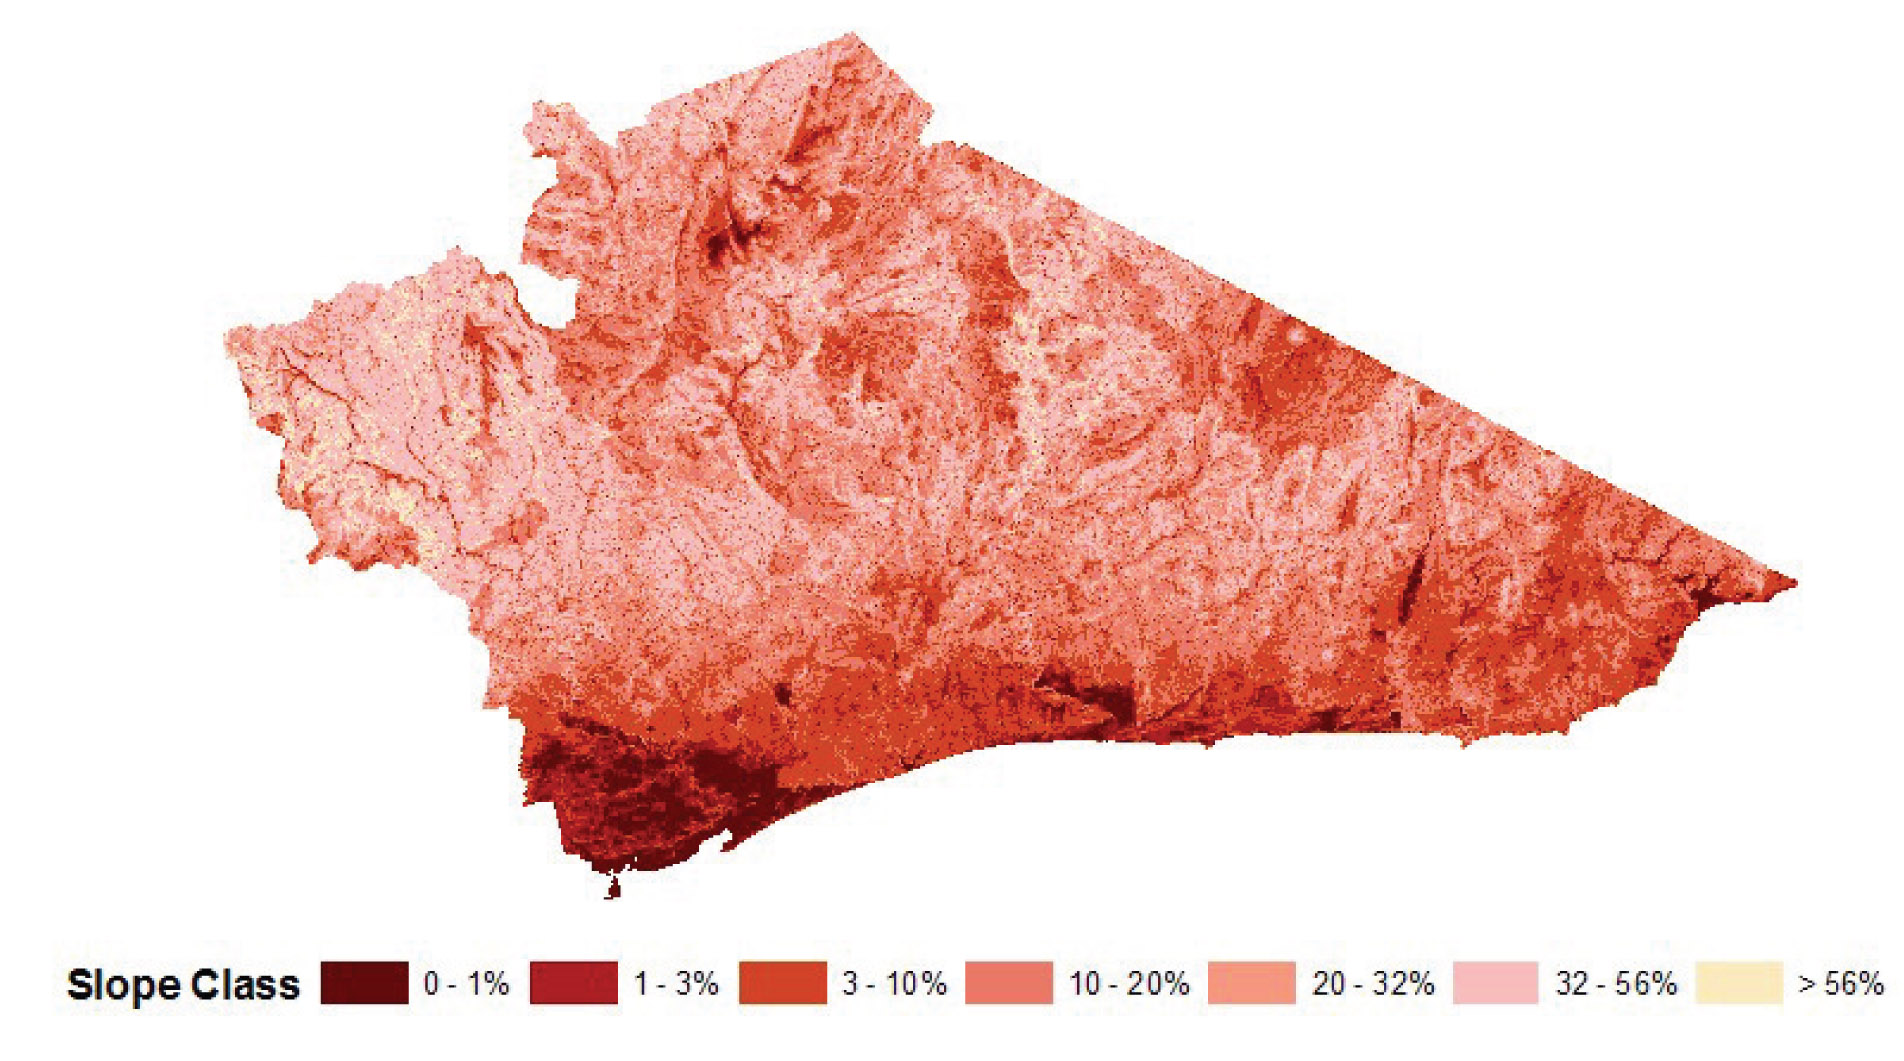
Figure 34: Shapefile of the generalised slope grid clipped to the study region boundaries.
Table 15: Base datasets used to derive the input geodatabase for LUIM.
Data Set | Description | Scale | Custodian | Comments / Limitations |
| gipsoil | Soil and landform mapping for East Gippsland | 1:100,000 | DPI | Incomplete coverage for the EGCMA region. Public land areas are not currently mapped. Several versions of this data layer are in the process of being incorporated into a single version by DPI. |
| DEM100 | Digital elevation model | 1:100,000 | DPI | Three datasets merged and clipped for the study region. |
| LU100 | Land use map for East Gippsland | 1:25,000 | DPI | Originally mapped in 2002 as part of the BRS land use mapping program, it was reviewed and updated by local regional DPI extension officers as part of this project. |
| Asset Management Units | East Gippsland has 10 AMUs. The addition of the Omeo-Benambra AMU for this study totals 11. Management units are based broadly on land tenure, land use, topography, catchment and landscape characteristics. | 1:25,000 | EG CMA |
Table 16: Evolution of land use classes
| Evolution of Bureau of Rural Sciences land use classes to LUIM land use classes | |||
| Original BRS Land Use classes in study region | BRS Re-classification | BRS classes to be used in LUIM | Revised Land Use classes used in LUIM |
| 1.0.0 Conservation and Natural Environments | Native Vegetation | Production from Relatively Natural Environments | Mixed Grazing 20% Sheep, 80% Cattle |
| 1.1.0 Nature conservation | Native Vegetation | Grazing natural vegetation | "Mixed Grazing 50% Sheep, 50% Cattle" |
| 1.1.1 Strict nature reserves | Native Vegetation | Production forestry | "Beef and Dairy (High Production)" |
| 1.1.3 National park | Native Vegetation | Hardwood Plantations | Mixed Grazing Cattle and Horses |
| 1.1.4 Natural feature protection | Native Vegetation | Softwood Plantations | "Grazing Cattle (Low Production)" |
| 1.1.5 Habitat/species management area | Native Vegetation | Grazing modified pastures | "Beef and Dairy (High Production)" |
| 1.1.7 Other conserved area | Native Vegetation | Cropping | Grazing Cattle (High Production) |
| 1.2.1 Biodiversity | Native Vegetation | Production from Irrigated Agriculture and Plantation | "Private Land Grazing Native Vegetation" |
| 1.2.2 Surface water supply | Water | Irrigated modified pastures | "Mixed Grazing and Cropping Enterprises" |
| 1.3.0 Other minimal use | Other | Irrigated Horticulture | "Softwood Production" |
| 2.0.0 Production from Relatively Natural Environments | Production from Relatively Natural Environments | "Irrigated Horticulture" | |
| 2.1.0 Grazing natural vegetation | Grazing natural vegetation | ||
| 2.2.0 Production forestry | Production forestry | ||
| 3.1.1 Hardwood production | Hardwood Plantations | Revised land use classes mapped but not used in LUIM | |
| 3.1.2 Softwood production | Softwood Plantations | "State Forest" | |
| 3.2.0 Grazing modified pastures | Grazing modified pastures | "National, State and Coastal Parks" | |
| 3.3.0 Cropping | Cropping | "Water" | |
| 4.0.0 Production from Irrigated Agriculture and Plantation | Production from Irrigated Agriculture and Plantation | "Mines and Quarries" | |
| 4.2.0 Irrigated modified pastures | Irrigated modified pastures | "Other" | |
| 4.4.0 Irrigated perennial horticulture | Irrigated Horticulture | ||
| 4.5.0 Irrigated seasonal horticulture | Irrigated Horticulture | ||
| 5.4.1 Urban residential | Other | ||
| 5.5.0 Services | Other | ||
| 5.5.2 Public services | Other | ||
| 5.5.3 Recreation and culture | Other | ||
| 5.7.1 Airports/aerodromes | Other | ||
| 5.7.2 Roads | Other | ||
| 5.7.3 Railways | Other | ||
| 5.7.4 Ports and water transport | Other | ||
| 5.8.1 Mines | Mining | ||
| 5.8.2 Quarries | Quarries | ||
| 5.9.0 Waste treatment and disposal | Other | ||
| 6.0.0 Water | Water | ||
| 6.1.0 Lake | Water | ||
| 6.5.0 Marsh/wetland | Native Vegetation | ||
| 6.6.0 Estuary/coastal waters | Water | ||
]Table 17: Land Use classes used to define the assets employed in LUIM and their original BRS classification.
| Land Use Assets | Original BRS Land Use Nomenclature |
| Mixed Grazing 20% Sheep, 80% Cattle – north and south facing | Grazing modified pastures |
| Mixed Grazing 50% Sheep, 50% Cattle– north and south facing | Grazing modified pastures |
| Mixed Grazing Cattle and Horses– north and south facing | Grazing modified pastures |
| Grazing Cattle (High Production) – north and south facing | Grazing modified pastures |
| Grazing Cattle (Low Production) – north and south facing | Grazing modified pastures |
| Beef and Dairy (High Production) – north and south facing | Irrigated modified pastures |
| Private Land Grazing Native Vegetation– north and south facing | Grazing natural vegetation and Production from relatively natural environments |
| Mixed Grazing Enterprises– north and south facing | Grazing modified pastures and Cropping and Production from Irrigated Agriculture and Plantations |
| Softwood Plantation | Softwood Production |
| Hardwood Plantation | Hardwood Production |
| Irrigated Horticulture | Irrigated horticulture |
It was decided the aspect of the land would have an influence on the likelihood of erosion for some land uses, namely grazing land uses. It was determined that north facing slopes where grazing occurred would be more likely to suffer from erosion than flat or south facing slopes. To incorporate this aspect factor into the modelling process a three class aspect layer was constructed from the merged Digital Elevation Model (DEM). The classes were 0-900 and 270-3600 = ‘North’, 90-2700 = ‘South’ and ‘Flat’. These three classes were subsequently aggregated to two: South and Flat = ‘South’ and North = ‘North’.
The result was a spatial data layer of sixteen land uses, eleven of which were to be employed in LUIM, eight of which were further divided into north facing and south facing classes.
Appendix D: Erosion susceptibility
Table 18: Soil erodibility parameters and rankings (L - Low, M – Moderate, H – High, V - Very high, E – Extreme)
Soil parameters | Soil dispersibility | |||||
Texture group (A1) | Texture Contrast (Topsoil – Subsoil) | Structure grade (A1) | Horizon depth (A1 + A2) | Very Low – Low E3(1), E3(2), E4,E5, E6, E7, E8 | Medium – High E3(3), E3(4), E2 | Very High E1 |
Sand | 1 | apedal | < 0.2 m | M | ||
2 | 0.2 - 0.4 m | L | ||||
3 | > 0.4 m | L | ||||
| 1 | apedal | < 0.2 m | M | H | |
2 | 0.2 - 0.4 m | L | M | |||
3 | > 0.4 m | L | ||||
weakly pedal | < 0.2 m | H | E | |||
0.2 - 0.4 m | M | V | ||||
> 0.4 m | M | |||||
| 1 | apedal | < 0.2 m | M | H | |
2 | 0.2 - 0.4 m | L | M | |||
3 | > 0.4 m | L | ||||
weakly pedal | < 0.2 m | H | E | |||
0.2 - 0.4 m | M | V | ||||
> 0.4 m | M | |||||
peds evident | < 0.2 m | H | E | |||
0.2 - 0.4 m | H | |||||
> 0.4 m | H | |||||
| 1 | apedal | < 0.2 m | M | H | |
2 | 0.2 - 0.4 m | L | M | |||
3 | > 0.4 m | L | ||||
weakly pedal | < 0.2 m | H | E | |||
0.2 - 0.4 m | H | E | ||||
> 0.4 m | M | |||||
peds evident | < 0.2 m | H | E | |||
0.2 - 0.4 m | H | E | ||||
> 0.4 m | M | |||||
| 1 | weakly pedal | < 0.2 m | H | E | |
2 | 0.2 - 0.4 m | M | V | |||
3 | > 0.4 m | M | V | E | ||
peds evident | < 0.2 m | M | V | E | ||
0.2 - 0.4 m | M | H | E | |||
> 0.4 m | M | H | E | |||
highly pedal | < 0.2 m | H | E | E | ||
0.2 - 0.4 m | M | V | ||||
> 0.4 m | M | V | ||||
| 1 | weakly pedal | < 0.2 m | M | H | E |
2 | 0.2 - 0.4 m | M | H | V | ||
3 | > 0.4 m | M | H | V | ||
peds evident | < 0.2 m | H | E | E | ||
0.2 - 0.4 m | M | V | E | |||
> 0.4 m | M | V | E | |||
highly pedal | < 0.2 m | H | E | E | ||
0.2 - 0.4 m | M | V | E | |||
> 0.4 m | M | V | E | |||
Table 19: Matrix combining slope and erodibility to provide a susceptibility rating to sheet and rill erosion
Slope % | Topsoil erodibility (from table 4) | ||||
Low | Moderate | High | Very high | Extreme | |
<1% | Very Low | Very Low | Low | Low | Moderate |
1-3% | Very Low | Low | Moderate | Moderate | High |
4-10% | Low | Moderate | Moderate | High | Very high |
11-20% | Moderate | Moderate | High | Very high | Very high |
>20% | Moderate | High | Very high | Very high | Very high |
Table 20: Susceptibility to gully and tunnel erosion: attributes and scores (taken and modified from Baxter et al. 1997)
Criteria | Description | Score |
| <1% | 1 |
1-3% | 2 | |
4-10% | 4 | |
11-32% | 5 | |
>32% | 7 | |
| E1 | 5 |
E2, E3(3), E3(4) | 4 | |
E3(1), E3(2) | 3 | |
E4, E5 | 2 | |
E6, E7, E8 | 1 | |
| >2.0 m | 1 |
1.6-2.0 m | 2 | |
1.1-1.5 m | 3 | |
0.6-1.0 m | 4 | |
0-0.5 m | 5 | |
| Acid Volcanics | Consolidated |
Aeolian | Unconsolidated | |
Alluvium | Unconsolidated | |
Colluvium | Unconsolidated | |
Basalt | Consolidated and Stable | |
Dunes | Unconsolidated | |
Granite | Consolidated | |
Gravels | Unconsolidated | |
Limestone | Consolidated and Stable | |
Metamorphics | Consolidated | |
Plains - Terraces | Unconsolidated | |
Sands | Unconsolidated | |
Sediments | Unconsolidated | |
Swamps | Unconsolidated |
Table 21: Rating for susceptibility to gully and tunnel erosion
Total attribute score | Susceptibility rating |
3-5 | Very low |
6-8 | Low |
9-11 | Moderate |
12-15 | High |
16-19 | Very High |
Appendix E: Land management practice tables
Sheet and Rill | ||||||||
Land Use | Mgmt Practice | Mgmt Types | Distribution (%) | Mgmt Practice/Type Combo Rankings | ||||
| High Prod Beef | Grazing Rotation | Graze spell | 20 | Grazing rotation | Pasture composition | Renovation method | Influence on erosion (south facing slopes) | Influence on erosion (north facing slopes) |
| Low Prod Beef | Set stock | 80 | Graze and spell | Perennial | Direct drill | Beneficial | Beneficial | |
| 50/50 Sheep and Cattle | Pasture Composition | Perennial | 30 | Graze and spell | Perennial | Cultivation | Weakly negative | Moderately Negative |
| 20/80 Sheep and Cattle | Annual | Sown annual | 50 | Graze and spell | Sown annual | Direct drill | Weakly negative | Moderately Negative |
| Cattle and Horses | Renovation Method | Direct Drill | 30 | Graze and spell | Sown annual | Cultivation | Moderate negative | Strongly Negative |
Cultivation | 70 | Graze and spell | Annual | Direct drill | Weakly negative | Moderately Negative | ||
| Graze and spell | Annual | Cultivation | Strongly negative | Strongly Negative | ||||
| Set stock | Perennial | Direct drill | Weakly negative | Moderately Negative | ||||
| Set stock | Perennial | Cultivation | Weakly negative | Moderately Negative | ||||
| Set stock | Sown annual | Direct drill | Weakly negative | Moderately Negative | ||||
| Set stock | Sown annual | Cultivation | Strongly negative | Strongly Negative | ||||
| Set stock | Annual | Direct drill | Weakly negative | Moderately Negative | ||||
| Set stock | Annual | Cultivation | Strongly negative | Strongly Negative | ||||
Sheet and Rill | ||||||||
Land Use | Mgmt Practice | Mgmt Types | Distribution (%) | Mgmt Practice/Type Combo Rankings | ||||
Private native veg - grazed | Grazing management | stock access | 80 | Grazing management | Influence on erosion (south facing slopes) | Influence on erosion (north facing slopes) | ||
stock exclusion | 20 | access | Weakly negative | Weakly negative | ||||
exclusion | Beneficial | Beneficial | ||||||
Hardwood plantations | Weed control | Broadacre | 50 | Deep Ripping | Mounding | Weed control | Influence on erosion | |
Softwood plantations
| Strips | 50 | Yes | Yes | Broadacre | Beneficial | ||
Spot sites | 0 | Yes | Yes | Strips | Very beneficial | |||
Deep Ripping | Yes | 100 | Yes | Yes | Spot sites | Very beneficial | ||
| No | 0 | Yes | No | Broadacre | Beneficial | ||
Yes | 100 | Yes | No | Strips | Very beneficial | |||
No | 0 | Yes | No | Spot sites | Very beneficial | |||
No | No | Broadacre | Weakly negative | |||||
No | No | Strips | Beneficial | |||||
No | No | Spot sites | Beneficial | |||||
No | Yes | Broadacre | Weakly negative | |||||
No | Yes | Strips | Weakly negative | |||||
No | Yes | Spot sites | Weakly negative | |||||
Sheet and Rill | |||||||||
Land Use | Mgmt Practice | Mgmt Types | Distribution (%) | Mgmt Practice/Type Combo Rankings | |||||
Hardwood Plantations | Cultivation | Grazing | Influence on erosion | ||||||
Softwood Plantations | Cultivation | No | 100 | No | No | Strongly Beneficial | |||
Yes | 0 | No | Yes | Beneficial | |||||
Grazing | No | 100 | Yes | No | Weakly negative | ||||
Yes | 0 | Yes | Yes | Moderately negative | |||||
| Grazing Rotation | Graze Spell | 20 | Irrigation | Grazing rotation | Pasture composition | Renovation method | Influence on erosion (south facing slopes) | Influence on erosion (north facing slopes) |
Set Stock | 80 | Spray irrigation | Graze and spell | Perennial | Direct drill | Beneficial | Beneficial | ||
Pasture Composition | Perennial | 30 | Spray irrigation | Graze and spell | Perennial | Cultivation | Weakly negative | Moderately negative | |
Sown Annual | 20 | Spray irrigation | Graze and spell | Sown annual | Direct drill | Weakly negative | Weakly negative | ||
Annual | 50 | Spray irrigation | Graze and spell | Sown annual | Cultivation | Weakly negative | Moderately negative | ||
Renovation Method | Direct Drill | 50 | Spray irrigation | Graze and spell | Annual | Direct drill | Weakly negative | Weakly negative | |
Cultivation | 50 | Spray irrigation | Graze and spell | Annual | Cultivation | Weakly negative | Moderately negative | ||
Irrigation | Spray irrigation | 35 | Spray irrigation | Set stock | Perennial | Direct drill | Weakly negative | Weakly negative | |
Flood | 0 | Spray irrigation | Set stock | Perennial | Cultivation | Weakly negative | Moderately negative | ||
No irrigation | 65 | Spray irrigation | Set stock | Sown annual | Direct drill | Weakly negative | Weakly negative | ||
Spray irrigation | Set stock | Sown annual | Cultivation | Weakly negative | Moderately negative | ||||
Spray irrigation | Set stock | Annual | Direct drill | Weakly negative | Weakly negative | ||||
Spray irrigation | Set stock | Annual | Cultivation | Weakly negative | Moderately negative | ||||
No irrigation | Graze and spell | Perennial | Direct drill | Beneficial | Beneficial | ||||
No irrigation | Graze and spell | Perennial | Cultivation | Weakly negative | Moderately negative | ||||
No irrigation | Graze and spell | Sown annual | Direct drill | Weakly negative | Weakly negative | ||||
No irrigation | Graze and spell | Sown annual | Cultivation | Weakly negative | Moderately negative | ||||
No irrigation | Graze and spell | Annual | Direct drill | Weakly negative | Weakly negative | ||||
No irrigation | Graze and spell | Annual | Cultivation | Weakly negative | Moderately negative | ||||
No irrigation | Set stock | Perennial | Direct drill | Weakly negative | Weakly negative | ||||
No irrigation | Set stock | Perennial | Cultivation | Weakly negative | Moderately negative | ||||
No irrigation | Set stock | Sown annual | Direct drill | Weakly negative | Weakly negative | ||||
No irrigation | Set stock | Sown annual | Cultivation | Weakly negative | Moderately negative | ||||
No irrigation | Set stock | Annual | Direct drill | Weakly negative | Weakly negative | ||||
No irrigation | Set stock | Annual | Cultivation | Weakly negative | Moderately negative | ||||
| Irrigation | Spray | 95 | Irrigation | Cultivation | Influence on erosion | |||
Cultivation | Trickle | 5 | Spray | Cultivation | Weakly negative | ||||
100 | Trickle | Cultivation | Beneficial | ||||||
| Grazing Rotation | Grazing rotation | Pasture composition | Fodder crop/ Pasture Renovation method | Influence on erosion (south facing slopes) | Influence on erosion (north facing slopes) | |||
Graze and spell | Perennial | Direct drill | Very beneficial | Very beneficial | |||||
Graze Spell | 50 | Graze and spell | Perennial | Cultivation | Beneficial | Beneficial | |||
Set Stock | 50 | Graze and spell | Sown annual | Direct drill | Beneficial | Beneficial | |||
Pasture Composition | Perennial | 30 | Graze and spell | Sown annual | Cultivation | Weakly negative | Weakly negative | ||
Sown Annual | 10 | Graze and spell | Annual | Direct drill | Weakly negative | Weakly negative | |||
Annual | 60 | Graze and spell | Annual | Cultivation | Moderately negative | Moderately negative | |||
Fodder crop and/or Pasture Renovation Method | Direct Drill | 20 | Set stock | Perennial | Direct drill | Weakly negative | Weakly negative | ||
Cultivation | 80 | Set stock | Perennial | Cultivation | Moderately negative | Moderately negative | |||
Set stock | Sown annual | Direct drill | Weakly negative | Weakly negative | |||||
Set stock | Sown annual | Cultivation | Moderately negative | Moderately negative | |||||
Set stock | Annual | Direct drill | Weakly negative | Weakly negative | |||||
Set stock | Annual | Cultivation | Moderately negative | Moderately negative | |||||
Gully & Tunnel | |||||||||
Land Use | Mgmt Practice | Mgmt Types | Distribution (%) | Mgmt Practice/Type Combo Rankings | |||||
Irrigated horticulture | Irrigation | Spray | 95 | Irrigation | Cultivation | Influence on erosion | |||
Trickle | 5 | Spray | Cultivation | Strongly beneficial | |||||
Cultivation | 100 | Trickle | Cultivation | Strongly beneficial | |||||
Private native veg - grazed | Grazing management | stock access | 80 | Grazing management | Influence on erosion (south facing slopes) | Influence on erosion (north facing slopes) | |||
Stock exclusion | 20 | Access | Weakly negative | Weakly negative | |||||
Exclusion | Beneficial | Beneficial | |||||||
Softwood plantations | Deep Ripping | Comply | 100 | Deep Ripping | Mounding | Influence on erosion | |||
Not Comply | 0 | Comply | Yes | Beneficial | |||||
Hardwood plantations | Mounding | Yes | 100 | Comply | No | Weakly negative | |||
Nt: this ONLY occurs every 12 years for hardwood and every 28 years for softwood. Refer below for practices included in LUIM | No | 0 | Not comply | Yes | Weakly negative | ||||
Not comply | No | Weakly negative | |||||||
Hardwood plantations | Cultivation | Grazing | Influence on erosion | ||||||
Softwood plantations | Cultivation | No | 100 | No | No | Strongly Beneficial | |||
Yes | 0 | No | Yes | Beneficial | |||||
Grazing | No | 100 | Yes | No | Weakly negative | ||||
Yes | 0 | Yes | Yes | Moderately negative | |||||
High Prod Beef | Fencing Reveg- gully | Yes | 15 | Fencing Reveg | Earthworks - gully or tunnel | Grazing rotation | Pasture composition | Influence on erosion (south facing slopes) | Influence on erosion (north facing slope) |
Low Prod Beef | No | 85 | Yes | Yes | Graze spell | Perennial | Strongly beneficial | Strongly beneficial | |
50/50 Sheep and cattle | Earthworks - gully (gully plugs; grass chutes) | Yes | 15 | Yes | Yes | Graze spell | Sown annual | Weakly negative | Weakly negative |
20/80 Sheep and cattle | No | 85 | Yes | Yes | Graze spell | Annual | Weakly negative | Moderately negative | |
Horses and Cattle | Earthworks - tunnel (deep ripping) | Yes | 10 | Yes | Yes | Set stocking | Perennial | Beneficial | Beneficial |
No | 90 | Yes | Yes | Set stocking | Sown annual | Beneficial | Weakly negative | ||
Grazing Rotation | Graze Spell | 20 | Yes | Yes | Set stocking | Annual | Weakly negative | Moderately negative | |
Set Stock | 80 | Yes | No | Graze spell | Perennial | Beneficial | Beneficial | ||
Pasture Composition | Perennial | 30 | Yes | No | Graze spell | Sown annual | Weakly negative | Moderately negative | |
Sown Annual | 20 | Yes | No | Graze spell | Annual | Weakly negative | Moderately negative | ||
Annual | 50 | Yes | No | Set stocking | Perennial | Beneficial | Beneficial | ||
Yes | No | Set stocking | Sown annual | Weakly negative | Moderately negative | ||||
Yes | No | Set stocking | Sown annual | Weakly negative | Moderately negative | ||||
Yes | No | Set stocking | Annual | Weakly negative | Moderately negative | ||||
No | Yes | Graze spell | Perennial | Beneficial | Beneficial | ||||
No | Yes | Graze spell | Sown annual | Weakly negative | Moderately negative | ||||
No | Yes | Graze spell | Annual | Weakly negative | Moderately negative | ||||
No | Yes | Set stocking | Perennial | Weakly negative | Moderately negative | ||||
No | Yes | Set stocking | Sown annual | Weakly negative | Moderately negative | ||||
No | Yes | Set stocking | Annual | Moderately negative | Strongly negative | ||||
No | No | Graze spell | Perennial | Weakly negative | Moderately negative | ||||
No | No | Graze spell | Sown annual | Weakly negative | Moderately negative | ||||
No | No | Graze spell | Annual | Moderately negative | Strongly negative | ||||
No | No | Set stocking | Perennial | Moderately negative | Strongly negative | ||||
No | No | Set stocking | Sown annual | Moderately negative | Strongly negative | ||||
No | No | Set stocking | Annual | Strongly negative | Strongly negative | ||||
| High Prod Beef/Dairy | Fencing Reveg - gully | Yes | 5 | Fencing Reveg | Earthworks - gully or tunnel | Grazing rotation | Pasture composition | Influence on erosion (south facing slopes) | Influence on erosion (north facing slope) |
No | 95 | Yes | Yes | Graze spell | Perennial | Strongly beneficial | Strongly beneficial | ||
Earthworks - gully (gully plugs; grass chutes) | Yes | 5 | Yes | Yes | Graze spell | Sown annual | Weakly negative | Moderately negative | |
No | 95 | Yes | Yes | Graze spell | Annual | Weakly negative | Moderately negative | ||
Earthworks - tunnel (deep ripping) | Yes | 10 | Yes | Yes | Set stocking | Perennial | Beneficial | Beneficial | |
No | 90 | Yes | Yes | Set stocking | Sown annual | Beneficial | Weakly negative | ||
Grazing Rotation | Graze Spell | 20 | Yes | Yes | Set stocking | Annual | Weakly negative | Moderately negative | |
Set Stock | 80 | Yes | No | Graze spell | Perennial | Beneficial | Beneficial | ||
Pasture Composition | Perennial | 30 | Yes | No | Graze spell | Sown annual | Weakly negative | Moderately negative | |
Sown Annual | 20 | Yes | No | Graze spell | Annual | Weakly negative | Moderately negative | ||
Annual | 50 | Yes | No | Set stocking | Perennial | Beneficial | Beneficial | ||
Yes | No | Set stocking | Sown annual | Weakly negative | Moderately negative | ||||
Yes | No | Set stocking | Annual | Weakly negative | Moderately negative | ||||
No | Yes | Graze spell | Perennial | Beneficial | Beneficial | ||||
No | Yes | Graze spell | Sown annual | Weakly negative | Moderately negative | ||||
No | Yes | Graze spell | Annual | Weakly negative | Moderately negative | ||||
No | Yes | Set stocking | Perennial | Weakly negative | Moderately negative | ||||
No | Yes | Set stocking | Sown annual | Weakly negative | Moderately negative | ||||
No | Yes | Set stocking | Annual | Moderately negative | Strongly negative | ||||
No | No | Graze spell | Perennial | Weakly negative | Moderately negative | ||||
No | No | Graze spell | Sown annual | Weakly negative | Moderately negative | ||||
No | No | Graze spell | Annual | Moderately negative | Strongly negative | ||||
No | No | Set stocking | Perennial | Moderately negative | Strongly negative | ||||
No | No | Set stocking | Sown annual | Moderately negative | Strongly negative | ||||
No | No | Set stocking | Annual | Strongly negative | Strongly negative | ||||
Mixed Grazing Enterprise | Erosion areas treated (earthworks, fencing and vegetation) | Grazing rotation | Pasture composition | Fodder crop /Pasture Renovation method | Influence on erosion (south facing slopes) | Influence on erosion (north facing slopes) | |||
Yes | Graze and spell | Perennial | Direct drill | Strongly beneficial | Strongly beneficial | ||||
Grazing Rotation | Graze Spell | 50 | Yes | Graze and spell | Perennial | Cultivation | Beneficial | Beneficial | |
Yes | Graze and spell | Sown annual | Direct drill | Beneficial | Beneficial | ||||
Yes | Graze and spell | Sown annual | Cultivation | Weakly negative | Moderately negative | ||||
Sown Annual | 10 | Yes | Graze and spell | Annual | Direct drill | Beneficial | Beneficial | ||
Annual | 60 | Yes | Graze and spell | Annual | Cultivation | Weakly negative | Moderately negative | ||
Fodder crop and/or Pasture Renovation Method | Direct Drill | 20 | Yes | Set stock | Perennial | Direct drill | Beneficial | Beneficial | |
Cultivation | 80 | Yes | Set stock | Perennial | Cultivation | Weakly negative | Moderately negative | ||
Erosion areas treated (earthworks, fencing and vegetation) | Yes | 20 | Yes | Set stock | Sown annual | Direct drill | Weakly negative | Weakly negative | |
Yes | 80 | Yes | Set stock | Sown annual | Cultivation | Weakly negative | Moderately negative | ||
Yes | Set stock | Annual | Direct drill | Weakly negative | Weakly negative | ||||
Yes | Set stock | Annual | Cultivation | Weakly negative | Moderately negative | ||||
No | Graze and spell | Perennial | Direct drill | Weakly negative | Weakly negative | ||||
No | Graze and spell | Perennial | Cultivation | Weakly negative | Weakly negative | ||||
No | Graze and spell | Sown annual | Direct drill | Weakly negative | Moderately negative | ||||
No | Graze and spell | Sown annual | Cultivation | Moderately negative | Strongly negative | ||||
No | Graze and spell | Annual | Direct drill | Weakly negative | Weakly negative | ||||
No | Graze and spell | Annual | Cultivation | Moderately negative | Strongly negative | ||||
No | Set stock | Perennial | Direct drill | Moderately negative | Strongly negative | ||||
No | Set stock | Perennial | Cultivation | Moderately negative | Strongly negative | ||||
No | Set stock | Sown annual | Direct drill | Weakly negative | Moderately negative | ||||
No | Set stock | Sown annual | Cultivation | Moderately negative | Strongly negative | ||||
No | Set stock | Annual | Direct drill | Weakly negative | Moderately negative | ||||
No | Set stock | Annual | Cultivation | Moderately negative | Strongly negative | ||||
Wind | |||||||||
Land Use | Mgmt Practice | Mgmt Types | Distribution (%) | Mgmt Practice/Type Combo Rankings | |||||
High Prod Beef | Grazing Rotation | Graze Spell | 20 | Grazing rotation | Pasture composition | Renovation method | Influence on erosion (south facing slopes) | Influence on erosion (north facing slopes) | |
Low Prod Beef | Set Stock | 80 | Graze and spell | Perennial | Direct drill | Beneficial | Beneficial | ||
50/50 Sheep & cattle | Pasture Composition | Perennial | 30 | Graze and spell | Perennial | Cultivation | Weakly negative | Moderately negative | |
20/80 Sheep & cattle | Sown Annual | 20 | Graze and spell | Sown annual | Direct drill | Weakly negative | Moderately negative | ||
Cattle and Horses | Annual | 50 | Graze and spell | Sown annual | Cultivation | Moderately negative | Strongly negative | ||
Renovation Method | Direct Drill | 30 | Graze and spell | Annual | Direct drill | Weakly negative | Moderately negative | ||
Cultivation | 70 | Graze and spell | Annual | Cultivation | Strongly negative | Strongly negative | |||
Set stock | Perennial | Direct drill | Weakly negative | Moderately negative | |||||
Set stock | Perennial | Cultivation | Weakly negative | Moderately negative | |||||
Set stock | Sown annual | Direct drill | Weakly negative | Moderately negative | |||||
Set stock | Sown annual | Cultivation | Strongly negative | Strongly negative | |||||
Set stock | Annual | Direct drill | Weakly negative | Moderately negative | |||||
Set stock | Annual | Cultivation | Strongly negative | Strongly negative | |||||
Wind | |||||||||
Land Use | Mgmt Practice | Mgmt Types | Distribution (%) | Mgmt Practice/Type Combo Rankings | |||||
Irrigated horticulture | Establishment | Direct drill | 0 | Establishment | Influence on erosion | ||||
Minimum till | 20 | Direct drill | Beneficial | ||||||
Conventional till | 80 | Minimum till | Weakly negative | ||||||
Conventional till | Moderately negative | ||||||||
Private native veg - grazed | Grazing management | stock access | 80 | Grazing management | Influence on erosion (south facing slopes) | Influence on erosion (north facing slopes) | |||
stock exclusion | 20 | Access | Weakly negative | Moderately negative | |||||
Exclusion | Beneficial | Beneficial | |||||||
Softwood plantations | Weed control | Broadacre | 50 | Weed control | Influence on erosion | ||||
Strips | 50 | Broadacre | Strongly negative | ||||||
Hardwood plantations | Spot sites | 0 | Strips | Beneficial | |||||
Nt: this ONLY occurs every 12 years for hardwood and every 28 years for softwood. Refer below for practices included in LUIM | Spot sites | Beneficial | |||||||
Hardwood plantations | Cultivation | Grazing | Influence on erosion | ||||||
Softwood plantations | Cultivation | No | 100 | No | No | Strongly beneficial | |||
Yes | 0 | No | Yes | Beneficial | |||||
Grazing | No | 100 | Yes | No | Weakly negative | ||||
Yes | 0 | Yes | Yes | Moderately negative | |||||
High Prod Beef/Dairy | Grazing Rotation | Graze Spell | 20 | Grazing rotation | Pasture composition | Renovation method | Influence on erosion (south facing slopes) | Influence on erosion (north facing slopes) | |
Set Stock | 80 | Graze and spell | Perennial | Direct drill | Beneficial | Beneficial | |||
Pasture Composition | Perennial | 30 | Graze and spell | Perennial | Cultivation | Weakly negative | Moderately negative | ||
Sown Annual | 20 | Graze and spell | Sown annual | Direct drill | Weakly negative | Moderately negative | |||
Annual | 50 | Graze and spell | Sown annual | Cultivation | Moderately negative | Strongly negative | |||
Renovation Method | Direct Drill | 50 | Graze and spell | Annual | Direct drill | Weakly negative | Moderately negative | ||
Cultivation | 50 | Graze and spell | Annual | Cultivation | Moderately negative | Strongly negative | |||
Set stock | Perennial | Direct drill | Weakly negative | Moderately negative | |||||
Set stock | Perennial | Cultivation | Weakly negative | Moderately negative | |||||
Set stock | Sown annual | Direct drill | Weakly negative | Moderately negative | |||||
Set stock | Sown annual | Cultivation | Moderately negative | Strongly negative | |||||
Set stock | Annual | Direct drill | Weakly negative | Moderately negative | |||||
Set stock | Annual | Cultivation | Moderately negative | Strongly negative | |||||
Appendix F: Gully erosion assessment sheet
| CAMSID |
|
Gully Erosion Assessment Sheet
| Landholder: | |
| Farm Location | |
| CFA Map ref: | |
| Gully Location (GPS point): | |
| Subcatchment |
| Cattle | Sheep | Mixed | Cropping | Other |
Location of Gully within Catchment:
Distance to major River or Stream (Please tick)
| >3000 m | 1000 - 3000 m | <1000 m |
Infrastructure above &/or below the erosion with within 1 km (Please tick)
Above | Below | |
| Dams | ||
| Public Roads | ||
| Bridges | ||
| Other (describe) |
Description of Existing Erosion: (Tick appropriate box)
Description of Gully at eroding head
| 1-2 m | 2-4 m | >4 m |
Length of eroded Gully
| <20 m | 20-50 m | 50-100 m | >100 m |
Average width of eroded Gully
| <10 m | >10 m | >20 m |
How far has gully moved in .................................... years? ......................... m
(If able to compare old aerial photography to new)
| Is Gully eroding? | Y | N |
Potential further erosion: (put in appropriate rating)
| Number of existing Gully Heads | ||
1 head only | 2 | |
2-3 heads | 5 | |
>3 heads | 10 | |
| Number of Secondary heads developing in Gully floor | ||
No secondary heads forming | 2 | |
1-2 forming | 5 | |
>1 forming | 10 | |
| Gully Floor Stability | ||
| Gully floor grassed and has visible rock barriers | 2 | |
| Gully floor grassed but has no rock barriers | 5 | |
| Gully floor not grassed but has rock barriers | 10 | |
| None of the above | 20 | |
| Total Length of drainage line/s unaffected | ||
| <200 m | 5 | |
| 200-500 m | 15 | |
| >500 m | 45 | |
| Width of drainage line | ||
| Does it broaden above the erosion? | 2 | |
| Does it say the same above the erosion? | 5 | |
| Does it narrow above the erosion? | 10 | |
| Slope of drainage line 0-10 m above eroding head | ||
| Gentle <4% | 2 | |
| Moderate 4-10% | 5 | |
| Steep >20% | 10 | |
| Catchment Slope | ||
| Gentle <4% | 2 | |
| Moderate 4-10% | 5 | |
| Steep >20% | 10 | |
| Slope Length | ||
| <50 m | 2 | |
| 50 - 200 m | 5 | |
| >200 m | 10 | |
| Catchment Status | ||
| Over 70% Remnant Veg - good condition | 2 | |
| Semi-cleared or heavily grazed remnant | 5 | |
| Over 70% cleared - good perennial pasture | 10 | |
| Over 70% cleared - poor perennial or annual pasture | 20 | |
Total (max 145) | ||
Estimated Cost of Works:
| Rock | (7 x head depth x head width) | m3 @ $ | /m3 $ |
| Earthworks | Type: | Hours @ $ | / hour $ |
| Pit & Pipe | Size 2ft with 4 lengths of pipe Headwall: | Y/N | $ |
| Fencing Materials | m @ $3.50 m | $ | |
| Fencing labour | m @ $2.00 m | $ | |
| Revegetation | trees @ $0.74/tree | $ | |
| Revegetation labour | trees @ $1.00/tree | $ |
Appendix G: Asset Values
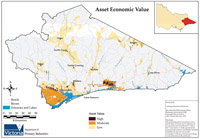
Table 22: Land asset values based on their use and their economic, environmental and social value as defined by the criteria in Table 3. Grey’d out rows represent land uses that were not included in the LUIM risk assessment.
Asset | Economic | Environmental | Social | Total Score | ||||||||||
Economic Activity | Capital Value | Facilitate Activity | Total | Signif | Cond | Rarity | Total | Heritage Value | Maintain Community | Visual Amenity | Social Amenity | Total | ||
| "Other" | 0 | 0 | 0 | 0 | 0 | |||||||||
| "Mines" | 0 | 0 | 0 | 0 | 0 | 0 | 0 | 0 | 3 | 0 | 0 | 0 | 3 | 3 |
| "Quarries" | 1 | 2 | 1 | 4 | 0 | 0 | 0 | 0 | 0 | 0 | 0 | 0 | 0 | 4 |
| Mixed Grazing 20% sheep, 80% cattle | 1 | 1 | 1 | 3 | 1 | 1 | 0 | 2 | 1 | 1 | 1 | 0 | 3 | 8 |
| Grazing Cattle (Low Production) | 1 | 1 | 1 | 3 | 1 | 1 | 0 | 2 | 1 | 1 | 1 | 0 | 3 | 8 |
| Softwood Plantation | 2 | 1 | 1 | 4 | 0 | 0 | 0 | 0 | 0 | 1 | 2 | 1 | 4 | 8 |
| Grazing High Production Beef and Dairy | 2 | 1 | 2 | 5 | 0 | 0 | 0 | 0 | 1 | 2 | 1 | 0 | 4 | 9 |
| Grazing Cattle (High Production) | 2 | 1 | 1 | 4 | 1 | 1 | 0 | 2 | 1 | 1 | 1 | 0 | 3 | 9 |
| Mixed Grazing 50% Sheep, 50% Cattle]]] | 1 | 1 | 1 | 3 | 1 | 1 | 2 | 4 | 1 | 1 | 1 | 1 | 3 | 10 |
| Hardwood Plantation | 2 | 1 | 1 | 4 | 0 | 0 | 0 | 0 | 3 | 1 | 1 | 1 | 6 | 10 |
| Beef and Dairy (High Production) | 2 | 3 | 3 | 8 | 0 | 0 | 0 | 0 | 1 | 2 | 1 | 0 | 4 | 12 |
| Private Land Grazing Native Vegetation | 0 | 1 | 1 | 2 | 2 | 2 | 2 | 6 | 0 | 1 | 2 | 1 | 4 | 12 |
| Irrigated Horticulture | 3 | 3 | 3 | 9 | 0 | 0 | 0 | 0 | 1 | 3 | 1 | 1 | 6 | 16 |
| Mixed Grazing Cattle and Horses | 1 | 1 | 1 | 3 | 3 | 1 | 3 | 7 | 1 | 3 | 1 | 1 | 6 | 16 |
| Mixed Grazing and Cropping Enterprises | 1 | 2 | 2 | 5 | 3 | 1 | 3 | 7 | 1 | 2 | 1 | 0 | 4 | 16 |
| "National, State and Coastal Parks" | 1 | 1 | 1 | 3 | 3 | 3 | 3 | 9 | 3 | 1 | 3 | 3 | 10 | 22 |
| "State Forest" | 3 | 2 | 3 | 8 | 3 | 3 | 2 | 8 | 3 | 3 | 3 | 3 | 12 | 28 |
| "Water" | 3 | 1 | 3 | 7 | 3 | 3 | 3 | 9 | 3 | 3 | 3 | 3 | 12 | 28 |

Appendix H: Area statements of high likelihood and risk of erosion
Table 23: Total area of map units rated as either high or very high for likelihood and risk for each asset management unit. *Total area modelled for risk to soil erosion, ie: does not include land assets (such as mining) not incorporated into the model.
Asset Management Unit | Total Area* (ha) | Sheet and Rill Erosion | Gully and Tunnel Erosion | Wind Erosion | Risk Area % | |||||
Likelihood | Risk | Likelihood | Risk | Likelihood | Risk | S & R | G & T | Wind | ||
| Bairnsdale Foothills Region | 54041 | 18596 | 17611 | 33574 | 33389 | 10082 | 10082 | 33% | 62% | 19% |
| Far East | 25177 | 17286 | 11337 | 4508 | 3712 | 6584 | 5840 | 45% | 15% | 23% |
| Buchan Valley Basin | 43676 | 41053 | 32670 | 17221 | 16083 | 4836 | 4822 | 75% | 37% | 11% |
| Coastal Hills | 20143 | 1715 | 851 | 10653 | 11135 | 2370 | 2666 | 4$ | 55% | 13% |
| Dargo Mountain Basin | 18731 | 17426 | 16721 | 13055 | 12891 | 4414 | 4223 | 89% | 69% | 23% |
| Lindenow and Bruthen Flats | 4390 | 532 | 53 | 357 | 303 | 339 | 339 | 1% | 7% | 8% |
| Red Gum Plains | 72683 | 5106 | 4472 | 18259 | 35901 | 59046 | 58982 | 6% | 49% | 81% |
| Snowy Mountain Basin | 41646 | 29225 | 17926 | 19750 | 19698 | 13914 | 13884 | 43% | 47% | 33% |
| Snowy River Flats | 29659 | 10571 | 3354 | 6052 | 2146 | 10118 | 4795 | 11% | 7% | 16% |
| Tambo Mountain Basin | 65216 | 59978 | 59465 | 38375 | 37375 | 28445 | 28445 | 91% | 59% | 44% |
| Omeo - Benambra | 66900 | 57446 | 56980 | 46162 | 46061 | 26275 | 26275 | 85% | 69% | 39% |
| TOTALS | 442262 | 258934 | 221440 | 207966 | 219694 | 166423 | 160353 | 50% | 50% | 36% |
Appendix I: Uncertainty, limitations, assumptions and validation of LUIM
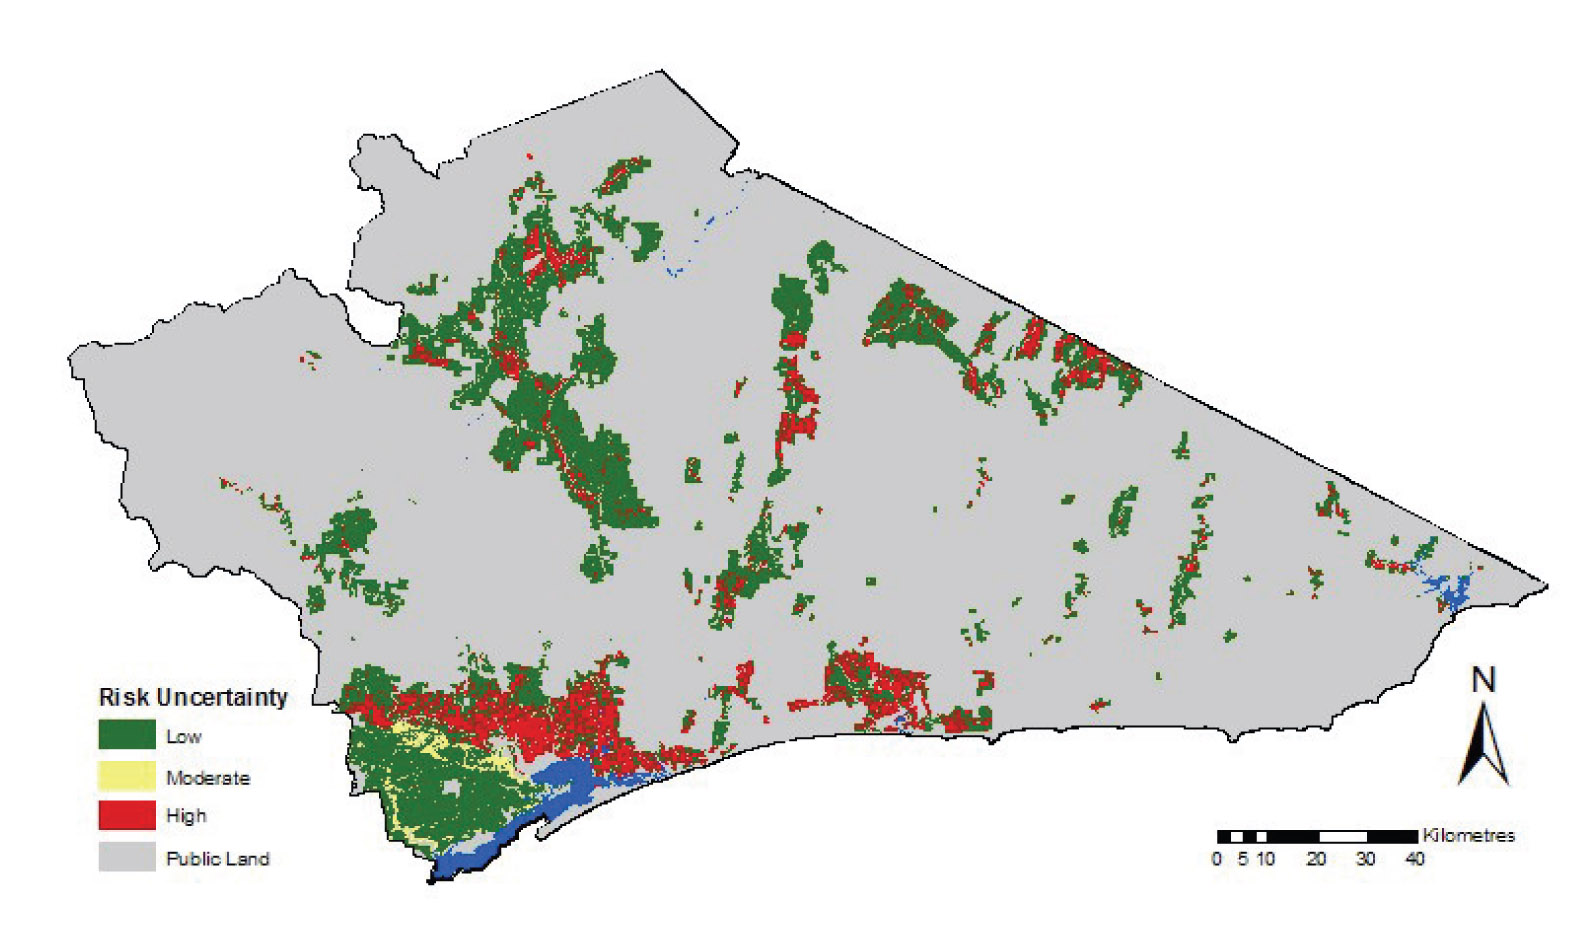 Figure 38: An uncertainty map of the risk ratings for sheet and rill erosion applied by LUIM. Uncertainty probabilities have been grouped into three classes: low, moderate and high | LUIM provides a measure of uncertainty when applying likelihood and risk ratings to the primary map units. The uncertainty comes from the LUIM’s use of a BBN to apply to each map unit a probability distribution for each rating. The probability distribution is derived from data that has been inputted through a probability classification table rather than being deterministic. In this study only the land management data was probabilistic (ie: the management practices were not spatially explicit). All other components were deterministic (ie: each map unit being assigned an exact, homogenous, attribute value for susceptibility, sensitivity and asset value). Therefore LUIM uncertainty in the likelihood and risk map outputs is due to land management data. This of course is not to say that uncertainty does not exist in the other components (eg: due to data quality) but rather it has not been accommodated by the model. The likelihood or risk rating with the highest probability score is the one applied by LUIM to the map unit. The combined probability scores of the other four risk classes can be mapped as a confidence measure in the model outputs (Figure 33). This is useful for identifying areas classified as a particular category where there is high spatial variability within a map unit or uncertainty in the land management data. This information can be mapped to identify areas where additional probability distribution data are necessary to provide greater confidence to decision-makers. |
Some limitations and assumptions that are inherent to the LUIM and the products in this study are listed below:
- The likelihood and risk maps are in the form of relative ratings based on subjective, not measured, values. As such the tool is useful for identifying areas at either end of the soil management problem scale but not quantitative differences along this scale.
- The likelihood maps should not be regarded as the actual condition of the assets in relation to soil erosion. Whilst erosion is likely to occur in certain areas it does not necessarily mean that it has.
- The coarse spatial resolution of some of the input datasets (such as the 1:100 000 soil dataset) disguises the heterogeneity of attributes that are likely to exist within each map unit. Obviously finer resolution data would produce more precise results. However precision should not be confused for accuracy and the limitations in erosion process knowledge should not be ignored.
- Management practices on certain land uses may only be enacted at certain times of the year or certain times of the agricultural cycle. Hardwood and softwood plantations for example have relatively benign management in terms of soil erosion for most of their production cycle however in a fallow year the management practices can be quite detrimental. Due to these temporal differences the likelihood and risk maps should be viewed in terms of which management practices have been included.
- The use of current land use to assess asset value has not taken into account the potential of a land parcel to be used for a higher value primary production.
- Data quality issues exist. This is especially relevant for soil susceptibility where attributes required to assess susceptibility did not exist and assumptions were required in order to derive them.
- Whilst uncertainty has been employed in the use of land management practice data it has not been applied to the other components of the model. It is recognised however that uncertainty is likely to exist due to data quality and resolution limitations.
© State of Victoria (Agriculture Victoria) 1996 - 2025.

This work, Victorian Resources Online, is licensed under a Creative Commons Attribution 4.0 licence. You are free to re-use the work under that licence, on the condition that you credit the State of Victoria (Agriculture Victoria) as author, indicate if changes were made and comply with the other licence terms.
The licence does not apply to ‘branding’ or some ‘images or photographs’ that may be owned by third parties. We ask you to seek prior approval to use images using the VRO feedback form. Access to higher quality images can also be provided on request.
This page was last updated on 23/03/2020.