
Salinity Province 8, Beaufort
|
|
 The Beaufort Salinity Province is an uplands province on the southern slopes of the Great Dividing Range with a mix of local to intermediate scale Groundwater Flow Systems. The salinity occurs as scattered patches that are mostly confined to drainage lines and may be associated with previous gold mining activity.
 Province Attributes
| Catchment Management Region: | GLENELG-HOPKINS |
| Priority Status: | High |
| Province Area: | 47,7340 ha |
| Recorded Soil Salinity Area 1: | 542 ha |
| Dominant Surface Geology Type: | Sedimentary |
| Influence of Geological Structure on Salinity Occurrence/s: | None |
| Relevant Geomorphological Mapping Units (GMUs): | 2.1.X |
| Predominant Groundwater Flow Systems (GFSs): | Local/Intermediate |
| Relevant Irrigation Areas: | N/A |
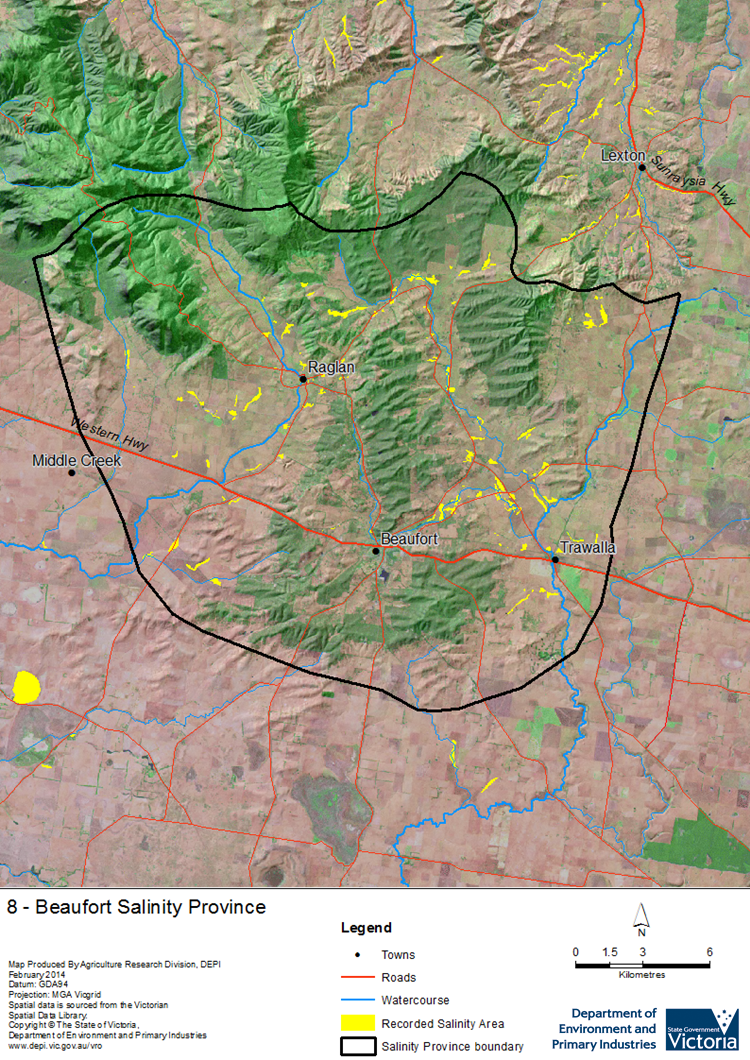
Beaufort Salinity Province Map
Links to further reading and material related to the Glenelg Hopkins Salinity Province
Groundwater Flow Systems (GFS) in the Glenelg Hopkins CMR
For further information relating to groundwater levels and salinities in this Province please see: Visualising Victoria's Groundwater (VVG)
1 Please Note: The ‘Recorded Soil Salinity Area’ indicated in the Salinity Province Attribute Table, comprises the total geographic area that has been mapped as having, or showing symptoms of, dryland soil salinity at some time (past or present). As dryland salinity occurrence in the Victorian landscape exhibits many different levels of severity and can change due to climate, landuse and vegetation, previously mapped areas may no longer be showing symptoms. In addition, as not all parts of the State have been mapped, or mapped in the same way, the mapping may not have captured some occurrences.
The soil salinity mapping used to calculate this ‘area’ does not cover irrigation regions. In irrigation regions, depth to watertable and watertable salinity mapping has been used to convey the threat of high watertables on soil waterlogging and/or soil salinisation and these areas are not included in this ‘area‘ calculation.
Please contact the Department, your Catchment Management Authority or your rural water provider for more information about salinity in your location.
© State of Victoria (Agriculture Victoria) 1996 - .

This work, Victorian Resources Online, is licensed under a Creative Commons Attribution 4.0 licence. You are free to re-use the work under that licence, on the condition that you credit the State of Victoria (Agriculture Victoria) as author, indicate if changes were made and comply with the other licence terms.
The licence does not apply to ‘branding’ or some ‘images or photographs’ that may be owned by third parties. We ask you to seek prior approval to use images using the VRO feedback form. Access to higher quality images can also be provided on request.
This page was last updated on .