
Salinity Provinces in the Mallee Catchment Management Region
The Mallee CMA Region is the largest CMA Region in the state covering over 17% of Victoria's northwest. It contains a number of ephemeral stream and lake systems which drain north towards or into the Murray River. The catchment landscape consists of the low lying and undulating Riverine Plains, and the ancient dune systems, the Mallee Dunefields, with limited topographic highs. Elevation extends from 150 m (AHD) in the southwestern corner of the ‘Big Desert’ towards 30 m (AHD) at Lake Wallawalla.
Average annual rainfall decreases slightly to the north ranging from 330 mm at Ouyen (south) to 300 mm at Mildura (north). Temperatures are extreme and vary seasonally. Maximum summer temperatures are commonly greater than 40 °C throughout the region and winter minimums may fall to -5 °C.
Native vegetation makes up 38% of the land cover, much of which is designated as public land. There are extensive ephemeral wetlands throughout the regional, some of which are RAMSAR listed. The majority of the land is broadacre farming dominated by cropping and dryland pasture for livestock production (sheep meat and wool, beef cattle). Irrigated horticulture in the Mallee extends along the Murray River from Nyah to the South Australian border and plays a significant role in salinity management.
units’,
Salinity is an important waterway and land management issue in the region and entrenched within the Regional Catchment Strategy (RCS). Salt loads into the Murray River are high and have a major negative impact on in stream health. Large groundwater discharge complexes called “Boinka”, considered a primary salinity process, dominate salinity mapping. Large shallow saline depressions are common, some of which are “Pink Lakes” due to the presence of carotenoid producing algae.
Groundwater Flow Systems within the region are generally of regional scale. Salinity has been recorded at over 1130 individually mapped units1, covering an area of nearly 130,000 hectares1 of the CMA. Where similar hydrogeological processes contribute to the salinity occurrence throughout the landscape, individual Salinity Provinces have been defined. Eleven such Salinity Provinces, nine of which are 'High' priority, have been distinguished in the region as a tool to understand the salinity processes and management options better.
The Mallee CMA has an extensive range of online materials (maps and documents etc.) which outline the biophysical assets of the catchment, as well as their major risks (including soil and water salinity). This material also outlines the programs and projects currently being completed by the CMA to protect and enhance these assets. An example of this is the Mallee CMA ‘Mallee Salinity Workshop Report (2012)’, which provides extensive information about both dryland and irrigation influenced salinity processes and occurrence in the region. The link to this document (and others) can be found at the base of this page.
Provinces displayed in this map are clickable or use the table of links provided
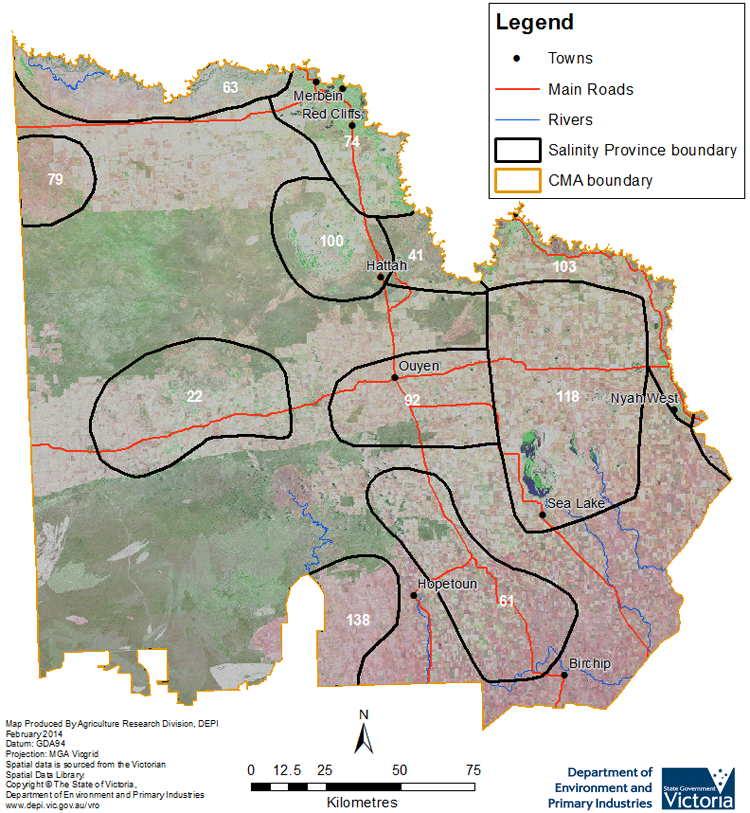
Province Name | No. | Area of Province (ha) | Recorded Soil Salinity Area 1 (ha) | Soil Salinity Area (% of SP) |
| Cowangie - Underbool | 22 | 215,930 | 29,186 | 13.52% |
| Hattah Lakes | 41 | 50,310 | 1 | 0.00% |
| Lascelles | 61 | 221,110 | 318 | 0.14% |
| Lindsay - Wallpolla | 63 | 130,980 | 25,867 | 19.75% |
| Mildura - Colignan | 74 | 124,710 | 3,131 | 2.51% |
| Morkalla | 79 | 65,830 | 2,469 | 3.75% |
| Ouyen | 92 | 158,780 | 3,596 | 2.26% |
| Raak Plains | 100 | 124,050 | 26,008 | 20.97% |
| Robinvale - Nyah | 103 | 122,440 | 6 | 0.00% |
| Tyrrell Basin | 118 | 380,010 | 36,454 | 9.52% |
| Yaapeet | 138 | 93,750 | 264 | 0.28% |
1 Please Note: The ‘Recorded Soil Salinity Area’ and ‘number of individually mapped units’ indicated in the CMA text and/or table, comprises the total geographic area or number of sites that have been mapped as having, or showing symptoms of dryland soil salinity at some time (past or present). As dryland salinity occurrence in the Victorian landscape exhibits many different levels of severity and can change due to climate, landuse and vegetation, previously mapped areas may no longer be showing symptoms. In addition, as not all parts of the state have been mapped, or mapped in the same way, the mapping may not have captured some occurrences.
Recorded soil salinity mapping used for these pages does not cover irrigation regions. Instead, depth to watertable and watertable salinity mapping has been used to convey the threat of high watertables on soil waterlogging and/or soil salinisation.
Please contact the Department, your Catchment Management Authority or your rural water provider for more information about salinity in your location.
Relevant Information
Links to further reading and material related to the Mallee CMR Mallee CMA region on VRO Mallee CMA (external link)
Mallee Catchment Management Authority region on VRO
Mallee Catchment Management Authority (external link)
Mallee CMA ‘Regional Catchment Strategy ’ (RCS)
Mallee CMA ‘Mallee Salinity Workshop Report (2012)’
Mallee CMA ‘Waterway Strategy’
Information about bores and groundwater resources in the Mallee CMA can be found on the Visualising Victoria’s Groundwater (VVG) website
© State of Victoria (Agriculture Victoria) 1996 - 2025.

This work, Victorian Resources Online, is licensed under a Creative Commons Attribution 4.0 licence. You are free to re-use the work under that licence, on the condition that you credit the State of Victoria (Agriculture Victoria) as author, indicate if changes were made and comply with the other licence terms.
The licence does not apply to ‘branding’ or some ‘images or photographs’ that may be owned by third parties. We ask you to seek prior approval to use images using the VRO feedback form. Access to higher quality images can also be provided on request.
This page was last updated on 23/03/2020.