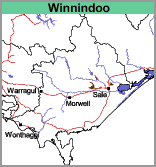
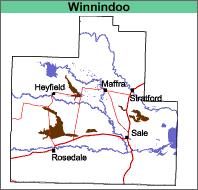
Winnindoo (Wi)
| Geology Late Pleistocene alluvial sediments. Landform Backplain of a stagnant alluvial plain. Topographically, it occurs adjoining the Stratford map unit. Original Vegetation Skene and Walbran (1949) refer to the areas mapped as Winnindoo loam and Winnindoo clay loam and are low-lying red gum woodlands. |  |  |
Previous Maps and Reports
Skene and Walbran (1948, 1949) mapped these soils in extensive detail. Aldrick et al. (1992) included these soils into the Valencia Land System and Ward (1977) placed most of them from the Sale area into the Meerlieu soil association.
Soils
The surface soils are usually dark greyish brown loams to fine sandy clay loams with a sporadically bleached sub-surface. At about 20 cm depth there is an abrupt change to a mottled medium to heavy clay with yellowish brown and greyish brown colours dominating. Medium to heavy clays continue to at least 1 m. The soils are generally classified as Yellow or Grey Sodosols using the Australian Soil Classification.
Chemical and Physical Analysis
Analyses are provided below for Soil Pit Site GP37 and Site GP61. Skene and Walbran (1948,1949) provided analyses for four locations on this mapping unit and profile 59 from Aldrick et al. (1992) from one other location.
The pH’s of the surface soils were generally found to be around 6.0 and with depth, the soils become strongly alkaline. The surface soils from pits GP37, GP61 and profile 59 are more acidic but all except GP61 become strongly alkaline with depth.
GP37. Soil Pit Site (Sargeant and Imhof, 2000)
| Depth cm | Texture | pH | EC dS/m | Cl % | Carbon % | Ca meq% | Mg meq% | K meq% | Na meq% | H meq% | ESP % | Gravel % | Coarse sand % | Fine sand % | Silt % | Clay % |
| 0-10 | L,FS | 5.7 | 0.18 | 2.7 | 2.5 | 1.8 | 1.4 | 0.4 | 6 | 16 | 46 | 19 | 14 | |||
| 10-20 | FSL | 5.2 | 0.21 | 1.4 | 1.5 | 0.7 | 0.4 | 4 | 14 | 48 | 21 | 15 | ||||
| 20-50 | MC | 7.3 | 0.18 | 2.3 | 7.1 | 0.6 | 2.1 | 18 | 13 | 31 | 7 | 35 | ||||
| 50-90 | MC | 8.5 | 0.35 | 0.04 | 1.8 | 7.6 | 0.6 | 3.1 | 24 | 9 | 30 | 18 | 42 | |||
| 90+ | MC | 8.8 | 0.51 | 0.06 |
GP61. Soil Pit Site (Sargeant and Imhof, 2000).
| Depth cm | Texture | pH | EC dS/m | Cl % | Nitrogen % | Carbon % | Ca meq% | Mg meq% | K meq% | Na meq% | H meq% | ESP % | Coarse sand % | Fine sand % | Silt % | Clay % | LAT % |
| 0-5 | L | 5.1 | 0.40 | 0.04 | 0.32 | 3.3 | 6.6 | 1.9 | 1.2 | 0.1 | 13.0 | 1 | 12 | 36 | 18 | 21 | 2 |
| 5-20 | FSCL | 5.0 | 0.09 | 3.1 | 2.2 | 0.6 | 0.2 | 5.6 | 2 | 10 | 41 | 21 | 24 | 1 | |||
| 20-40 | LMC | 6.1 | 0.07 | 2.3 | 3.8 | 0.3 | 0.5 | 1.3 | 6 | 11 | 37 | 19 | 31 | 1 | |||
| 40-60 | MC | 6.4 | 0.22 | 2.6 | 6.7 | 0.3 | 1.6 | 3.9 | 11 | 9 | 31 | 15 | 42 | 1 | |||
| 60-90 | MC | 6.2 | 0.47 | 0.07 | 2.1 | 6.9 | 0.3 | 1.1 | 3.9 | 8 | 7 | 28 | 16 | 46 | 1 | ||
| 90+ | MC | 5.5 | 0.77 | 0.11 | 1.5 | 7.1 | 0.2 | 1.7 | 4.5 | 11 |
Winnindoo loam, (Skene and Walbran, 1948)
| Depth cm | Texture | pH | EC dS/m | Cl % | Nitrogen % | Carbon % | Coarse sand % | Fine sand % | Silt % | Clay % | LAT % |
| 0-5 | L | 6.1 | 0.04 | .004 | 0.144 | 2.01 | 28 | 30 | 27 | 14 | 4 |
| 5-13 | SCL | 6.3 | 0.04 | .004 | 27 | 28 | 27 | 14 | 3 | ||
| 13-23 | LC | 6.7 | 0.11 | .012 | 28 | 16 | 24 | 27 | 3 | ||
| 23-36 | HC | 7.3 | 0.30 | .038 | 14 | 7 | 25 | 49 | 5 | ||
| 36-74 | MC | 8.2 | 0.56 | .085 | 9 | 28 | 18 | 38 | 4 | ||
| 74-97 | MC | 8.6 | 0.80 | .126 | 3 | 18 | 21 | 53 | 5 | ||
| 97-137 | LMC | 8.6 | 0.55 | .088 | 1 | 29 | 22 | 44 | 4 | ||
| 137-155 | LC | 8.7 | 0.44 | .066 | 2 | 39 | 18 | 37 | 4 | ||
| 155191 | FSC | 8.7 | 0.39 | .060 | 1 | 46 | 17 | 32 | 3 |
Winnindoo loam (Skene and Walbran, 1948)
| Depth cm | Texture | pH | EC dS/m | Cl % | Nitrogen % | Carbon % | Ca meq% | Mg meq% | K meq% | Na meq% | ESP % | Gravel % | Coarse sand % | Fine sand % | Silt % | Clay % | LAT % |
| 0-13 | L | 6.3 | 0.05 | .003 | 0.117 | 1.54 | 1.5 | 1.7 | 0.3 | 0.2 | 11 | 48 | 21 | 16 | 4 | ||
| 13-28 | CL | 6.6 | 0.05 | .004 | 3 | 15 | 43 | 20 | 21 | 3 | |||||||
| 28-41 | MC | 6.9 | 0.10 | .011 | 9 | 15 | 34 | 19 | 31 | 4 | |||||||
| 43-86 | MC | 6.9 | 0.58 | .087 | 1.2 | 8.0 | 0.4 | 2.4 | 20 | 3 | 8 | 29 | 20 | 43 | 2 | ||
| 86-114 | HC | 7.5 | 0.76 | .114 | 1.0 | 10.9 | 0.5 | 4.1 | 25 | 1 | 5 | 19 | 16 | 54 | 5 | ||
| 114-160 | HC | 7.9 | 0.70 | .108 | 1 | 4 | 15 | 18 | 58 | 5 |
Winnindoo clay loam, (Skene and Walbran, 1948)
| Depth cm | Texture | pH | EC dS/m | Cl % | Nitrogen % | Carbon % | Ca meq% | Mg meq% | K meq% | Na meq% | H meq% | Coarse sand % | Fine sand % | Silt % | Clay % | LAT % |
| 0-7 | CL | 5.9 | 0.14 | .005 | 0.230 | 3.40 | 3.5 | 3.1 | 0.8 | 0.2 | 3 | 18 | 46 | 25 | 1 | |
| 7-15 | CL | 6.0 | 0.05 | .004 | 2.1 | 2.6 | 0.5 | 0.2 | 4 | 19 | 45 | 26 | 1 | |||
| 15-30 | HC | 6.1 | 0.05 | .004 | 2.2 | 6.0 | 0.3 | 0.7 | 4 | 9 | 25 | 55 | 2 | |||
| 30-54 | HC | 5.9 | 0.07 | .006 | 3 | 6 | 21 | 65 | 2 | |||||||
| 54-131 | HC | 5.5 | 0.18 | .028 | 5 | 9 | 21 | 60 | 2 | |||||||
| 149-193 | HC | 7.3 | 0.19 | .027 | 13 | 20 | 12 | 50 | 1 |
Winnindoo clay loam, (Skene and Walbran, 1949)
| Depth cm | Texture | pH | EC dS/m | Cl % | Ca meq% | Mg meq% | K meq % | Na meq% | H meq% | Coarse sand % | Fine sand % | Silt % | Clay % | LAT % |
| 0-8 | CL | 5.9 | 0.15 | .030 | 3.6 | 3.6 | 0.2 | 0.6 | 8 | 22 | 42 | 23 | 1 | |
| 8-18 | LC | 5.6 | 0.17 | .041 | 4 | 20 | 39 | 31 | 1 | |||||
| 20-61 | HC | 5.5 | 0.89 | .271 | 1.7 | 8.3 | 0.1 | 1.8 | 2 | 11 | 29 | 53 | 2 | |
| 61-81 | HC | 5.4 | 1.21 | .332 | <1 | 8 | 29 | 57 | 2 | |||||
| 81-122 | HC | 6.6 | 0.92 | .262 | <1 | 5 | 31 | 57 | 1 |
Profile 59, Valencia 1, (Aldrick et al., 1992)
| Depth cm | Texture | pH | EC dS/m | Cl % | Nitrogen % | Carbon % | Ca meq% | Mg meq% | K meq% | Na meq% | H meq% | ESP % | Gravel % | Coarse sand % | Fine sand % | Silt % | Clay % |
| 0-5 | FSL | 5.2 | 0.10 | .010 | 0.39 | 4.88 | 2.3 | 2.4 | 0.7 | 0.3 | 15.9 | 1 | 99 | 36 | 24 | 22 | |
| 10-20 | CL | 5.7 | 0.04 | .003 | 0.071 | 0.73 | 1.3 | 1.4 | 0.4 | 0.2 | 6.1 | 2 | 2 | 12 | 42 | 30 | 15 |
| 20-30 | HC | 6.1 | 0.06 | .004 | 0.052 | 0.37 | 1.9 | 4.2 | 0.7 | 0.4 | 6.3 | 3 | 2 | 12 | 34 | 23 | 30 |
| 90-120 | MC | 8.6 | 0.49 | .056 | 2.3 | 9.7 | 0.3 | 3.3 | 1.0 | 20 | <1 | 23 | 29 | 48 |
The following abbreviations are used to describe field texture: S - sand; LS - loamy sand; ClS - clayey sand; SL - sandy loam; L - loam; CL - clay loam; SCL - sandy clay loam; SC - sandy clay; FSCL - fine sandy clay loam; FSC - fine sandy clay; LC - light clay; MC - medium clay; HC - heavy clay; GR - gravel; ZL - silty loam; ZCL - silty clay loam; ZLC - silty light clay; ZMC - silty medium clay.
Particle size distribution data given for Skene and Walbran (1948, 1949) does not include the water content of the soil. As a result the coarse sand, fine sand, silt, clay and loss on acid treatment (LAT) may not add up to 100%. Aldrick et al. (1992) does not provide LAT data.
Other symbols include: pH - analysed in water; EC - electrical conductivity; Cl - chloride; Ca - exchangeable calcium; Mg - exchangeable magnesium, K - exchangeable potassium; Na - exchangeable sodium; H - exchangeable hydrogen; ESP - exchangeable sodium percentage.
For Soil Pit Sites (Sargeant and Imhof, 2000) exchangeable cations have been determined using Gilman method (where pH >7) and Tucker method (pH <7). Exchangeable Sodium % (ESP) has been calculated here as the percentage of sodium in relation to the sum of the exchangeable basic cations.
Land Use
Both dryland grazing and irrigation are carried out on these soils.
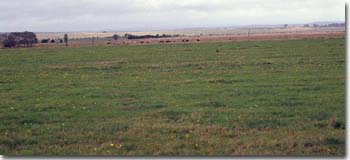
 Winnindoo mapping unit. Note Snake Ridge in the background (Coongulla mapping unit) which was uplifted along the Snake Ridge fault. |


