
Tunnel hydrology near Costerfield
S.C. Boucher
School of Geography and
Environmental Science
Monash University, Victoria 3800
This article has been reviewed by Dr. Ian Sargeant.
Introduction | Rainfall and tunnelflow | Particle size of eroded material | Composition of suspended sediment | Conclusions | References
Introduction
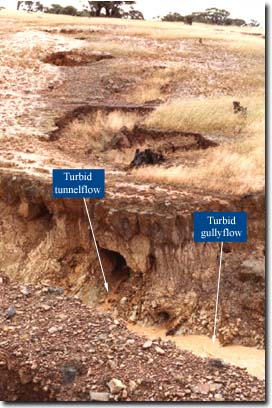 Photo: Tunnelflow carrying suspended sediment into a tributary gully near Costerfield. Photograph: Stuart Boucher | An overview of tunnel erosion in Victoria is provided on this website. Whereas most research into tunnelling in Australia has focussed on the properties that make a soil susceptible to erosion, this article is concerned with how rainfall from a single storm event moves through a tunnel network. The mechanisms of tunnel hydrology have not been previously studied in Australia apart from the work conducted by the author (e.g. Fitzpatrick et al. 1994, Boucher 1995, 2002). The research site in question, Costerfield, is located in the south-west area of the Goulburn Broken region. Some of the main results are as follows:
|
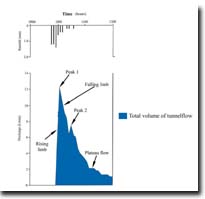 Rainfall and Tunnelflow: 12 May 1992 | The diagram below illustrates the rainfall and tunnelflow characteristics of the storm. The storm commenced at 0940 hours and ceased at 1035 hours. Flow monitoring was discontinued when discharge reached the low rate of 1.05 litres per minute (i.e. L/min) during the recession. The discharge measured for the first hydrograph peak was 12.2 L/min whilst that for the second peak was 7.5 L/min. The time from peak rainfall to peak runoff for the first peak was only 10 minutes. This result is significant when one considers that the rainfall has to enter the soil, as opposed to becoming part of surface runoff, and move vertically into the subsoil prior to reaching the weir. Therefore, flow must have passed through established pathways in the soil such as large macropores and macropores. By way of comparison, flow through the soil matrix would produce much slower flow speeds. |
| The second hydrograph peak appeared unrelated to rainfall and was probably a delayed contribution from another tunnel branch upslope. The ‘'plateau-like'’, which followed the steep falling limb of the second peak, commenced at 1115 hours when discharge fell to 2.1 L/min. By this time the soil upslope of the weir (i.e. towards the hillcrest) was approaching saturation and would take some considerable time to drain. Put simply, the pore space in the soil matrix was substantially filled with water from the antecedent moisture absorbed by the 30.5 mm which fell at Costerfield the previous day as well as that from the present storm. | 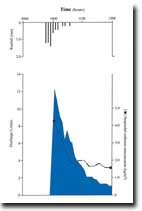 12 May 1992 |
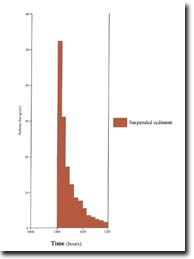 Suspended sediment flux of tunnelflow: 12 May 1992 | Suspended sediment is material that is carried by flow (e.g. dispersed clay) as opposed to that which is dissolved (i.e. solutes). The suspended sediment concentration is expressed in the unit 'kg/m3'. The first sample of suspended sediment was taken at the time of the first discharge peak and from then on the curve followed that of the falling limb of the hydrograph until discharge fell to 6.3 L/min and the sediment concentration remained at approximately 2 kg/m3. The total mass of suspended sediment was approximately 1.4 kg and its distribution over time followed that of the hydrograph. |
The EC25oC rose from approximately 0.04 dS/m to 0.08 dS/m at the end of the monitoring period - indicating that tunnelflow carried low levels of soluble salts (i.e. was not saline).
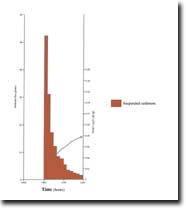
Suspended sediment flux and EC of tunnelflow: 12 May 1992
Particle size of eroded material
Generally speaking, the particle sizes of soil material are broadly grouped, in declining order of diameter, as sand, silt and clay. Each class has specific particles diameter limits which are expressed in micrometres (i.e. the unit being 'µm'). One µm is equivalent to a millionth of a metre.
Particle size class | Diameter range (µm) |
Sand | Diameter ≥ 60 |
Silt | 2 ≤ Diameter < 60 |
Clay | Diameter < 2 |
Broad particle size groups (after Marshall et al. 1996).
The three broad groups can be subdivided according to various schemes, but the one considered most appropriate for suspended sediment is that of the Massachusetts Institute of Technology and the British Standards Institute (Marshall et al. 1996) as it permits finer subdivision of the silt, fine sand and coarse sand fractions than the scheme adopted by the International Society of Soil Science. The breakdown of the clay fraction into coarse clay and colloids was made by the author.
Particle size class | Diameter range (µm) |
Fine sand and/or coarser | 2 ≤ Diameter < 6 |
Coarse silt | 20 ≤ Diameter < 60 |
Medium silt | 6 ≤ Diameter < 20 |
Fine silt | 2 ≤ Diameter < 6 |
Coarse clay | 1 ≤ Diameter < 2 |
Colloids | Diameter < 1 |
Particle size groups used for suspended sediment (after Boucher 2002).
The finest particles (i.e. the colloids) can be transported the longest distances.
Overall, the proportion of the ‘fine sand and/or coarser’ class amounted to 1.6 % of the total mass of suspended sediment. The total silt load represented the dominant particle size (i.e. 81.3 %) and comprised 15.4 % of coarse silt, 36.6 % of medium silt and 29.3 % of fine silt. The total clay mass amounted to 17.1 % and included 7.7 % of colloidal particles.
Composition of suspended sediment
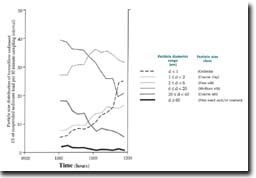 Particle size distribution flux of tunnelflow with respect to time: May 1992 | The 'fine sand and/or coarser' class was at its maximum percentage 10 minutes after the first discharge peak. The percentage of fine silt was consistently high over time, and the values for fine silt and medium silt were generally much higher than the coarse clay and colloid curves for most of the runoff period. The trends of medium silt and coarse silt were alike in that they decreased at a similar rate with time, although the former class had considerably higher values throughout. This pattern also bore an inverse relation to the clay fraction percentages with both subdivisions rising steadily over time, particularly in relation to decreasing discharge. |
Conclusions
The response of the tunnel discharge to rainfall was rapid and indicated that the flow had largely by-passed the soil matrix. Therefore, rainfall and surface runoff were infiltrating down to the subsoil (B2) horizon through established pathways. It is clear from the information presented above that the tunnel system actively transported solutes and suspended sediment and redistributed them both within the hillslope and around the local sub-catchment. The finer particles in particular were most susceptible to being carried the longest distances.
It follows that tunnelled land must be reclaimed in order to retain soil on the hillslopes rather than being deposited in waterways and dams. An overview of reclamation of tunnelled land is provided elsewhere on this website.
References
Boucher SC 1995: Management options for acidic sodic soils affected by tunnel erosion. In 'Australian sodic soils – distribution, properties and management'. (Eds R Naidu, ME Sumner and P Rengasamy) pp. 239-246. (CSIRO Australia: East Melbourne)
Boucher SC 2002: The initiation and development of tunnel erosion near Costerfield, Victoria. Unpublished PhD thesis, School of Geography and Environmental Science, Monash University, Clayton, Australia.
Fitzpatrick RW, Boucher SC, Naidu R, Fritsch E 1994: Environmental consequences of soil sodicity. Australian Journal of Soil Research 32, 1069-1093.
Marshall TJ, Holmes JW, Rose CW 1996: ‘Soil physics’. (Third edition). (Cambridge University Press: Cambridge)
© State of Victoria (Agriculture Victoria) 1996 - 2025.

This work, Victorian Resources Online, is licensed under a Creative Commons Attribution 4.0 licence. You are free to re-use the work under that licence, on the condition that you credit the State of Victoria (Agriculture Victoria) as author, indicate if changes were made and comply with the other licence terms.
The licence does not apply to ‘branding’ or some ‘images or photographs’ that may be owned by third parties. We ask you to seek prior approval to use images using the VRO feedback form. Access to higher quality images can also be provided on request.
This page was last updated on 22/02/2021.