
The Effect of Soil pH on Supply of Nutrients
Measuring and Interpreting Soil pH | pH and Nutrients | Acidification Animation
Emil Truog's diagram, published in 1946, is often used to illustrate the effect of soil pH on the ease of supply of nutrients to plants. It represents nutrients as separate bands and shows a wider band for the more favourable conditions of supply. Note that the pH range of 6.0 to 8.0 is favourable for most nutrient supply . However, the trace elements, manganese, iron, boron, copper and zinc are more available to plants when the soil is acidic with a pH of 4.5 to 6.5. This explains why plants growing on acidifying soils can develop manganese and boron toxicities.
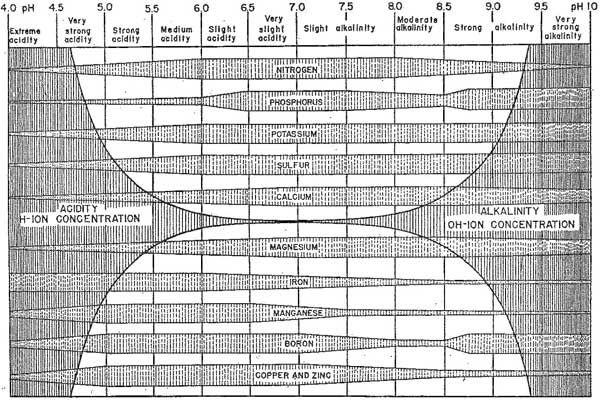
Emil Truog's diagram, published in 1946, often used to illustrate the effect of soil pH on the ease of supply of nutrients to plants
Emil Truog's diagram is still regularly provided in current literature. It should be used in the knowledge that it conceptualises the ease of supply based on information available at the time. More research work has been done since then on the solubility of nutrients, the biological transformations of nutrients in soils, and the effect of soil pH on them.
Further information on trace elements in pastures in Victoria is available on the VRO webpage Trace Elements for Pastures and Animals in Victoria.
Note that Truog's diagram was an expansion and simplification of a similar diagram for seven nutrients published by Pettinger in 1935.
Related Link
Further information about Surface Soil pH is available within the Soil section of VRO.
Further information about the Nitrogen cycle is also available.
© State of Victoria (Agriculture Victoria) 1996 - 2025.

This work, Victorian Resources Online, is licensed under a Creative Commons Attribution 4.0 licence. You are free to re-use the work under that licence, on the condition that you credit the State of Victoria (Agriculture Victoria) as author, indicate if changes were made and comply with the other licence terms.
The licence does not apply to ‘branding’ or some ‘images or photographs’ that may be owned by third parties. We ask you to seek prior approval to use images using the VRO feedback form. Access to higher quality images can also be provided on request.
This page was last updated on 23/03/2020.