
4 The soil system and soil health monitoring
Back to: Soil health for Victoria's agriculture - context, terminology and concepts
4.1 Physics - the soil as a three phase system | 4.2 The physico - chemical system
Earlier discussion and explanation of terminology (Section 2.3) presented a simple framework for soil health that linked the provision of ecosystem services to functions, processes, and attributes of soil. An indicator of health can be selected from any level. Ecosystem service provision may be inferred from favourable properties (e.g. infiltration rate) or may be directly monitored (e.g. water quality and quantity in runoff). Soil monitoring is a periodic rather than continuous activity and may entail annual site assessments or longer intervals between visits. Direct measurement of soil properties and soil condition is time consuming and appropriate indicators and methods need to be selected. Minimum datasets (MDS) comprising biological, chemical and physical measurements have been proposed in several sources and may be combined into a single index (for example, Andrews et al. 2002; Barbiroli et al. 2004). The extensive review by Hall (2003) on this topic is invaluable. Measurement and interpretation can be a job for experts or can be simplified for implementation by farmers themselves, as exemplified by the USDA’s soil quality test kit (USDA 1999).
Understanding the soil system is an essential precursor to selection, application and interpretation of appropriate indicators and methods. In particular, the inherent physical qualities of soil have a profound influence on the expected range of dynamic properties (physical, chemical or biological) in different soils.
4.1 Physics – the soil as a three phase system
Soil is a complex medium with components existing as solids, liquids or gas (Figure 5). The solid matter is primarily mineral with a small organic component. The mineral content of soils depends on their parent rock material and the degree of weathering. In turn this affects the soil’s ability to supply and store exchangeable cations and anions essential for, or sometimes, toxic to, plant growth. Grain size of the solids ranges from sub–micron (very fine clays) to centimetres (cobbles and boulders) and the fine earth or sub 2 mm fraction is assessed as soil texture. Texture, determined by hand, includes the influence of the soil organic fraction. Soil textures are broadly classified into sands, loams or clays. These principal classes are qualified by the amount of sand, silt and clay present (for example; sandy loam, clayey sand, silty clay loam). The solids may be aggregated (pedal) into structural units (peds), or they may have no identifiable structural units (apedal), being loose (single grain sands) or massive (a dense assembly of primary particles).
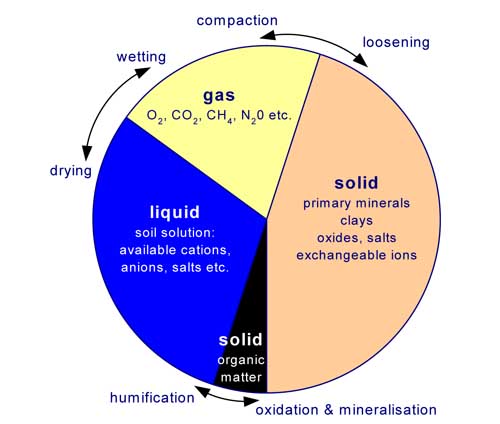
Figure 5 Representation of the bulk soil composition in relation to the three phases of matter: solid, liquid and gaseous.
The bulk relationships between these phases, particularly those between liquid and gas in the soil pore space, are critical with respect to plant growth. Figure 5 illustrates the way in which management can influence total porosity, whilst Figure 6 illustrates examples of the way in which porosity can differ widely between soils of different texture and density and the influence that this has on water availability and soil aeration.
Spaces between the solids constitute the soil porosity which has unique size and spatial properties. The spatial arrangement of solids and spaces and the stability and strength of the solids is referred to as structure. Soil structure is a critical aspect of soil quality as it controls or regulates soil functions such as water retention, water supply to plants, drainage, and aeration. Porosity has two components related to soil quality; textural and structural (Dexter 2004a). The textural component of porosity is determined by the grain size or soil texture and the way in which the primary soil particles naturally pack together. Structural porosity consists of microcracks, cracks, biopores and voids within and between soil aggregates. Textural porosity is largely unaffected by soil management, whereas structural porosity is readily influenced by tillage, compaction and biological activity. Structural porosity is therefore more relevant as an indicator of soil health whereas textural porosity affects only the inherent soil quality.
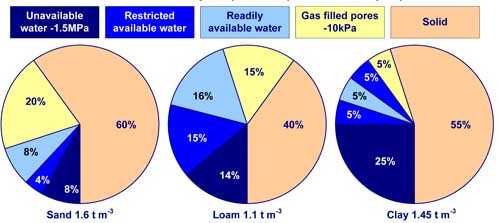
Figure 6 Water availability and volumetric relationships between solid, liquid and gaseous phases for three soils of different texture and density.
Differences in soil structure are to be expected between soils of different texture and are illustrated by the differences in bulk density, macroporosity (>30 μm, holding water at tensions above –10 kPa), residual porosity (<0.2 μm, holding water below –1.5 Mpa) and available water capacity (between –10 kPa and –1.5 Mpa) for three soils in Figure 6. Examples are shown for a sand, loam and clay. Sand readily compacts to a packing density dictated by the primary sand particles. However, it has relatively few pores that are <0.2 μm and a high proportion that are >30 μm, and therefore most of the water stored is available to plants. The loam example represents a finely–tilled surface with high total porosity (60%) and low bulk density. The loam in the example presents the best soil quality of the three, but its condition could readily change through compaction. The clay, though not as dense as the sand, provides less support for plant growth, with respect to water supply, than either the sand or the loam. Water is readily available if there is sufficient aeration and the water is in larger micropores that are well connected. As soils dry, water is confined to smaller pores and the pathways for water movement become more tortuous and slow. Hence availability of water can be restricted at the dry and wet ends of the available range (assuming a critical air filled porosity of 10%). This situation is illustrated in Figure 6 by the pie diagram for clay.
Interpreting texture, density and compaction
Assessments and comparisons of soil health (actual condition relative to potential condition) must be made within texture groups and cannot easily be made between texture groups. Comparisons of soil quality (capacity to perform functions) can legitimately be made between as well as within texture groups. Bulk density is a useful measure of soil physical quality but has little value unless related in some way to functional properties of the soil. It should be used as an indicator of degree of soil compaction only if reported as a ratio. For example, field bulk density can be compared with the maximum bulk density achievable with a Proctor compaction test for that soil. Håkansson and Lipiec (2000) have provided a useful analysis of the relation between crop response and degree of compactness for a range of soil types and value that is independent of soil texture. Compaction can also be indicated by ped shape, distorted surfaces of peds (clays), reduction in percentage of macropores, and the relationship between moisture content and mechanical strength. Dexter (2004a, 2004b) has proposed an index of soil physical quality, S4, that is positively correlated with soil workability and is independent of texture.
Least limiting water range, soil texture, growth limiting bulk density and soil quality
The soil water holding characteristic (volume of water held vs. pore size or matric tension) is a useful indicator of soil health and quality. Many workers have proposed the Least Limiting Water Range (LLWR) as an important integrator of factors affecting root growth. The LLWR serves as an index of soil structural quality that integrates values of soil matrix potential, aeration and soil strength (da Silva et al. 1994). Quantification of LLWR requires knowledge of soil moisture contents for the following four limiting states:
| 1 | Wilting point or physical lower limit of water available to plants (–1.5 MPa); θwp |
| 2 | Field capacity or drained upper limit water content of the soil (nominally –0.01 MPa); θfc |
| 3 | Critical air filled porosity to maintain adequate oxygen in the root zone (10%); θafp |
| 4 | Critical soil strength at which root penetration is restricted (2 MPa); θsr |
The upper limit for the LLWR is equal to θafp if <θfc, otherwise it is equal to θfc. The lower limit for the LLWR is equal to θsr if >θwp, otherwise it is equal to θwp.
The application of this concept has been the subject of several papers in the last five years (Zou et al. 2000; Benjamin et al. 2003; Wu et al. 2003; Lapen et al. 2004; Leao et al. 2006). Groenevelt et al. (2001) went further and proposed the term ‘integrated water capacity’ (IWC) as a development from LLWR, introducing overburden pressure as another factor and integrating changes in bulk density of swelling soils to allow for better estimation of water availability.
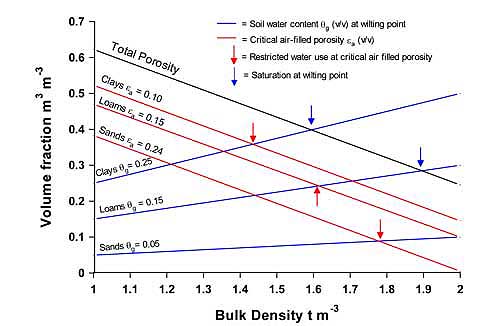
Figure 7 Relationship between bulk density, porosity and water content, illustrating critical limits for air filled porosity (red lines) and wilting point water contents
(blue lines) for sands, loams and clays (Generalised data from various literature sources).
Generalised data for wilting point moisture contents and theoretical relationship between particle density, bulk density and porosity (porosity = 1 – bulk density/particle density) have been plotted in Figure 7 for three soil textures. Critical air–filled porosity fractions for different soil textures adapted from Pierce et al. (1983) have also been plotted in Figure 7 and indicate the upper limit of LLWR for any bulk density and texture. The bulk density value at the intersection of critical air–filled porosity and wilting point water content represents the growth limiting bulk density (GLBD) for that texture. These theoretical values correspond well with those given in the Soil Quality Institute’s soil quality test kit guide (USDA 1999). GLBD values may be lower if critical soil strength is exceeded at moisture contents above wilting point.
The soil profile – variability of the physical system with depth
The physical properties affecting soil functions are not uniform with depth. Differences in texture and structure with depth are normal features in most natural soils. These differences are recognised as ‘soil horizons’ and result from soil formation processes (pedogenesis) over decades and millennia. While most assessments of agricultural soils concentrate on the surface horizon (or topsoil), differences in material below the surface affect many soil functions at the surface. Interpretation of the whole profile is therefore necessary for optimal soil management.
4.2 The physico–chemical system
Chemical properties of the soil material are an essential aspect of soil fertility and plant nutrition. There are complex relationships that exist between plant nutritional requirements, soil solution, pH, nutrient availability and soil composition. Interpretation of chemical properties is confounded by differences in analytical methods, plant species requirements and tolerances and variable production responses in different soils. Generalised rules concerning soil chemical properties can be applied with regard to many soil properties (Peverill, Sparrow and Reuter 1999):
- pH has a reasonable relationship to nutrient availability and metal toxicity.
- EC is strongly correlated with water availability, and yield of salt sensitive plant species.
- Nitrogen, Phosphorus, Sulfur, Calcium, Magnesium and Potassium levels can all be directly related to crop production.
- Cation balances between Calcium, Magnesium, Potassium and Sodium have variable relationships to soil structure and animal health.
- Micro–nutrient levels of Copper, Zinc, and Boron are related to plant health.
- Some micro–nutrient levels such as Aluminium, Chloride, Manganese and Boron can be related to plant toxicity.
However, the degree of confidence for prescribed optimum values depends upon regional and specific crop evidence and experience. For example, although there is strong advocacy by some advisers for very specific cation ratios, particularly for Calcium, Magnesium and Potassium, there is no evidence that supports such recommendations (Kopittke and Menzies 2007). Chemical properties and mineralogical composition also affect a number of physical functions, for example:
- Clay type determines the amount of swelling or shrinkage of soil as it wets or dries, and so affects creation of structural cracks, regeneration of structure after compaction, and soil aeration or waterlogging.
- Soluble salts affect the osmotic strength of the soil solution and therefore limit water uptake before the physical lower limit of water availability (permanent wilting point) is reached.
- Exchangeable sodium at modest levels5 affects the swelling and dispersion of clays and deterioration of soil structure by clogging pores, restricting air movement and drainage.
Physical indices and soil biology
Theoretical values for GLBD provide a simple indicator of soil physical health. Whilst the GLBD is a useful indicator of a poorly structured soil with respect to restricted LLWR and low potential for root growth, there are other aspects of structure that should be considered. Bulk density is, as it sounds, a measurement applied to bulk soil and does not reveal aspects of pore geometry that would affect root growth. The number, volume, connectivity and orientation of macropores are particularly important in dense soils as they determine air and water movement to a limited rhizosphere. In structured clay soils, roots are usually observed in fissures, interpedal pores and biopores. Whilst the volume occupied by roots in such soils may be small, the physical environment is quite different to that measured in the bulk soil. Whalley et al. (2005) have demonstrated that water retention and aeration properties of the rhizosphere soil are enhanced with respect to root growth compared to the properties of the bulk soil. Passioura (2002) describes the many interactions between root and soil that demonstrate the ability of plants to adapt to and survive in stressed situations.
While high bulk density has a significant negative influence on soil aeration, mechanical strength and root growth, equivalent effects have not been observed in biological properties. Shestak and Busse (2005) studied the effect of increased bulk density on biological indices of soil health (although the imposed densities were not high). They found that there was no negative effect on microbial communities but that in some instances there were increases in activity (fungal hyphae, carbon use, total phospholipid fatty acids). The compaction experiments resulted in decreases of 50 to 90% in macroporosity (>30 μm) whereas habitable pores for microbes (0.2 to 30 μm) increased by at least 40%. Microbial activity is positively correlated with water content (matric potential) and soil health tests comparing microbial activity should be carried out at equivalent moisture potentials.
© State of Victoria (Agriculture Victoria) 1996 - .

This work, Victorian Resources Online, is licensed under a Creative Commons Attribution 4.0 licence. You are free to re-use the work under that licence, on the condition that you credit the State of Victoria (Agriculture Victoria) as author, indicate if changes were made and comply with the other licence terms.
The licence does not apply to ‘branding’ or some ‘images or photographs’ that may be owned by third parties. We ask you to seek prior approval to use images using the VRO feedback form. Access to higher quality images can also be provided on request.
This page was last updated on .