
Tools and systems for assessing soil health
Back to: Tools and systems for assessing soil health
Contributing authors: ARichard MacEwan, BDamian Bougoure, CMelissa Cann, ADoug Crawford, AGemma Heemskerk, AMark Imhof, CTim Johnston, CBernard Noonan, CDarryl Pearl and AAbdur Rab.
A Future Farming Systems Research Division; B Biosciences Victoria Division; C Farm Services Victoria Division
Acronyms | 1. Introduction | 2. Tests and tools for monitoring | 3. Tools for soil management | 4. Training and education for management of soil health | References | Appendix 1 - Soil physical tests | Appendix 2 - Soil chemical tests | Appendix 3 - Models and calculators for soil carbon | Appendix 4 - Soil biological tests | Appendix 5 - Testing for soil-borne pests and diseases
1. Introduction
1.1 Background
The ‘Healthy Soils – Soil Health for Sustainable and Productive Landscapes’ (or more commonly ‘Healthy Soils’) project is funded by the Victorian Government’s ‘Our Environment, Our Future – Sustainability Action Statement’ (ESAS) initiative. This project was run in partnership with the ‘Soil Health: Leaving a Legacy for South Eastern Australia’ project funded by Land and Water Australia as part of their Healthy Soils for Sustainable Farms program.
Soil health is critically important to sustainable agricultural productivity and environmental wellbeing. Healthy Soils provide a range of environmental services including water infiltration, habitat provision and profitable and sustainable agriculture. The ‘Healthy Soils’ project will help farmers manage their soil for productivity and for environmental protection. The project aims to improve farmer’s capacity to manage soil health issues by providing soil management strategies and techniques, and focuses on the dryland cropping regions of western Victoria. The project will leave a legacy of enhanced knowledge and capacity around soil health for the future that will provide a resource for farmers, advisers and for all levels of education.
1.2 Soil health tools
Soil health is a complex topic. It is a term used by policy makers, planning authorities, scientists, land managers and others. For each group the term takes on different meanings and nuances. At the agricultural and horticultural enterprise level, consideration of soil health is pragmatic and is focussed on sustainable productivity. Management of soil health is practiced insofar as it is recognised as critical to sustaining productivity and healthy safe food products. Soil health management may also extend into an altruistic care of the soil regardless of measured economic benefit and is often linked to more fundamental and holistic philosophies regarding nature and agriculture (organic farming and biodynamics). While many practices may be adopted on received advice, largely as ‘acts of faith’, there are many measures of soil properties that serve as indicators of soil health and can be used to guide management decisions.
This report provides a summary of tools that are currently used to assess soil condition or soil health at the farm or paddock scale. The review is simply an inventory with some commentary. It is not claimed to be complete, nor is it a manual for interpretation of results. The structure of this report provides an overview of key subject areas, references cited, and a collection of appendices containing tabular summaries of individual tools, tests and methods.
Useful comprehensive Australian references that provide more detail on methods or interpretation are:
Hazelton and Murphy (2007) ‘Interpreting Soil Test Results – What Do all the Numbers Mean?’; McKenzie et al. (2002) ‘Soil Physical Measurement and Interpretation for Land Evaluation’; Peverill et al. (1999) ‘Soil Analysis - an Interpretation Manual’; and, McDonald et al. (1990) ‘Australian Soil and Land Survey Field Handbook’. Other sources are cited in relation to particular tests and tools described in this report.
For the purposes of this report a ‘tool’ may be any of the following:
- A device or method for measuring a soil physical, chemical or biological property (e.g. a penetrometer, a pH meter, or biolog plates).
- A kit comprising several devices for measuring a range of soil properties (e.g. Soil Quality Institute’s soil quality kit).
- A manual providing methods and guidelines on soil assessment (e.g. Cornell Soil Health Assessment Training Manual).
- A decision support system or tool (e.g. a decision tree) enabling interpretation of soil properties and used to determine a management action, or further investigation (e.g. a subsoil constraints decision support system developed under the GRDC’s SIP08 subsoil constraints programme).
- A conceptual system that explains soil properties, processes and management (i.e. knowledge and science of soils, general references, scientific publications).
- A rating system (such as a score card or index) that allows comparison of soil condition over time or between different soils and management practices (e.g. the Northern Rivers Soil Health Card).
- A management system that uses the results of soil (health) monitoring to determine soil inputs and management (e.g. regular testing of soil fertility, pH etc.).
- A planning system that integrates different aspects of a farm business with soil management for the long term (e.g. a soil health management plan).
1.3 Putting it all together into a ‘soil health management plan’
Soil is a finite resource on the farm. The farm enterprise is adapted to this resource in terms of the total land area of the farm and soil quality. These factors combine with season temperatures and water availability to determine the choice of produce, the production system, and the productive potential of the enterprise. Most of the annual enterprise decisions centre on the economics of production; machinery operation and replacement costs, seeds, fertilizers, chemicals and labour. These decisions are largely driven by historical experience of what has been successful in the past and the market opportunities for the coming season.
Management of soil health is generally not an explicit part of this planning process but there are many aspects of the seasonal farm operations that have an impact on soil condition. Conversely, there are many soil related factors that have impacts on a successful outcome for the enterprise. Figure 1 illustrates some of these factors and relationships.
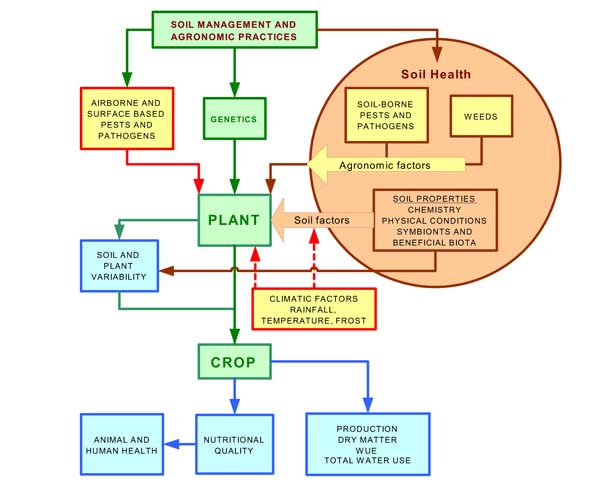
Figure 1. Illustration of soil health factors and their relationship to the production system
The central pathway in the figure (green boxes) represents the primary agronomic choice (the crop or pasture that is to be grown) and the end result (blue boxes) as food quality, animal and human health, total production and production efficiency (the latter expressed in terms of water use. Farming practices are applied to achieve the best result by managing soil conditions and weeds (brown circle) whilst responding to seasonal invasions of pests and pathogens and the vagaries of the weather (yellow boxes not included in the soil health circle).
Economic aspects of the system such as the input costs associated with production units, such as energy, labour, fertilisers, chemicals, machinery and infrastructure depreciation, are not represented in Figure 1.
1.3.1 Basic elements for a soil health plan
The basic elements required for a soil health plan are:
1. Inventory and interpretation: what is the nature of the soil or soils on the farm? What key qualities of the farm’s soil will affect productivity and degradation hazard?
2. Assessment and monitoring: What factors should be monitored to indicate soil condition? What is the current condition of the soil?
3. Planning: What management actions are required to maintain or improve soil condition?
1.3.2 Implementing a soil health plan
Why should a landholder bother?
We have no direct experience of implementation of a soil health plan, although there are similarities with whole farm planning. Whilst it is possible to create a framework for such a plan, implementation is the responsibility of the land manager. The challenge is to find or provide a driver that will motivate a land manager to adopt the ideas in the framework and make them part of the farm business planning activity.
Economic benefits are not clear enough for economics to be, at this time, a major driver, although many of the ‘alternative’ farming philosophies stress soil health as an objective that can benefit the economics of production through lowering the costs of inputs and raising the value of produce for specialised markets. There are considerable costs involved in changing farm equipment to adopt controlled traffic systems, for example, and there may be economic risks in reducing tillage or adopting zero till systems. However much we may point to successful examples that demonstrate the long term improvements to soil structure, the quantifiable production benefits are uncertain. Lower fuel usage may be one of the most powerful drivers for change in traffic and tillage and this is likely to increase as oil becomes scarcer and more costly. An ecological conscience (caring for soil) and economics both play their part as drivers, but, at the present time, economics is the weaker of the two.
How should a soil health management planning framework be promoted?
There are many examples of failed attempts to get farmers to adopt new practices. The issue of drivers already discussed is an important one but failures also occur because of the intellectual and emotional distance between the developer/s and the recipient/s. A ‘back-room’ approach to reviewing knowledge of a topic can work very well, but development of the knowledge into an application or tool to be used by others who have not been involved in the knowledge review is another matter. Recent examples of soil quality and soil health knowledge extension stress the need to involve the farmers from the beginning (Andrews 2003; Lobry de Bruyn and Abbey 2003). Unless the farmer ‘owns’ the plan it will never translate fully into management.
The subsequent sections of this report provide a summary of tools covering physical, chemical and biological properties that could be applied to managing and monitoring soil and could therefore be incorporated into a soil health management plan. However, there is no prescription to say what should be included. In this review we have attempted to rate the tools with respect to their technical complexity, cost and usefulness for decision making.
1.4 Minimum datasets for soil health assessment
Since the early 1990's there have been attempts to define the essential tests for monitoring soil quality or soil health. General agreement is that the tests need to be ‘robust’; i.e. tests should:
- Have a sound basis in science and understanding of what is being measured.
- Have methods that are consistently applied, are relatively cheap and require modest equipment.
- Have clear guidelines for interpretation.
- Represent soil functions and dynamic properties of the soil that are sensitive to management.
A minimum dataset should encompass soil biological, chemical and physical properties that sufficiently represent major soil functions, see, for example, Doran and Parkin (1996).
1.5 Evaluating soil modification through crop responses
Using a crop’s response to evaluate soil modification or soil differences is something farmers and researchers have been doing since farming began. Some of the earliest work was simply picking the best performing plant in a crop on a particular soil type and using that seed to sow next year’s crop on that soil type. Modern agricultural researchers conduct replicated treatment trials on different soil types across a region. Farmers, today, evaluate many things; for example, addition of a soil amendment such as gypsum to part or all of a paddock or two crops sown side by side in one paddock to see how they perform in that soil and possibly what affect they each have on the following year’s crop.
For both researchers and farmers the aspects they are evaluating in a soil modification process are the crop growth and appearance during the season and the final crop yield. The researcher will in most cases go into more detail than a farmer, possibly measuring such things as growth stages, root production, dry matter production, grain quality and the treatment’s impact on the soil. Both groups have an interest in the effect of the modification over more than one year to see if a benefit is carried through to future crops.
For both farmers and researchers the key is knowing what the treatment is doing to the soil, or in the soil. A simple example is a cultivated versus non cultivated treatment. Is the difference in crop performance due to the breaking up of a hard pan in the soil, the quick break down of organic matter which releases nutrients or is it the removal of root diseases? Not knowing what a soil modification is treating can lead to the wrong assumption being made, for example cultivation for a hard pan may actually help in the control of root diseases in one paddock but, in another paddock that does not have the disease, may result in damage to soil structure, lower yield and additional non-beneficial cultivation costs.
Soil modification can occur on part or all of a paddock. Soils can also be removed from the field for pot experiments, placed in containers, modified and the plant responses evaluated. Modifications can be mechanical such as deep ripping or physical/chemical such as adding lime or gypsum or a combination of both such as deep banding of a product. In all cases it is the response of plants growing on the treated site that is evaluated.
General method 1. Soil and plant growth assessment using field trials
Name to test | Field trials / Crop yields |
| Description | Field trials can be established on-farm to monitor the impact of different treatments on crop production through the season and on final harvest yields. Treatments may include a different management practice or product. Can be done as a single replicate for demonstration purposes or as multiple replicates for statistical purposes. |
| Method reference | The TOPCROP state focus paddocks reports and any DPI demonstration trials show the methods to be used. A key to success is to have base measurement/s or agreed value/s before the trial. |
| Complexity | A relatively easy method to compare treatments. The complexity depends on the number of treatments, amount of replication and the amount of in-crop sampling required during the growing season. |
| Technology | Generally no specialist equipment is required beyond that normally used for crop management. |
| Cost and time | Costs and time requirements depend on the complexity of the experimental design. |
| Interpretation | Depends on the message and how much information the participants want. In the most basic form it will provide yield and or quality information. |
| Decision | On-farm trials usually create discussion on how treatments or management practices can be applied to a whole farm system – farmer case studies are valued within the farmer community. |
| Value | On-farm field trials have high value as an awareness tool for growers as they demonstrate to growers how treatments may impact on their crop production. |
General method 2. Soil and plant growth assessment using field test strips
Name to test | Field test strips |
| Description | During the growing season or over a long term, areas of a paddock are set aside to undertake test strips. A set amount of product is spread or sprayed over a known area and the impact on crop production is monitored over the growing season. Alternatively, a strip of a paddock has a different management system (e.g. a strip of conventional farming within a no-till paddock). |
| Method reference | Department of Primary Industries Victoria (2008a) |
| Complexity | Relatively simple and achievable by any farmer. |
| Technology | Normal equipment used for crop establishment and management. |
| Cost and time | Only cost is the cost of the product, acquiring appropriate equipment if not have it, the person’s time and any crop monitoring required during the growing season. |
| Interpretation | Interpretation depends on what the person is looking to prove, which will control what things will be coincided in the interpretation (not sure if this is really appropriate). |
| Decision | Can be used for decision making as long as you are confident that all consideration have been taken into account. |
| Value | Test strips are a useful method to get growers to look at their soils and consider the impact of additives to the crop, or particular management systems. |
General method 3. Soil and plant growth assessment using pot trials
Name to test | Pot trials |
| Description | Pot trials are a useful method to observe the impact of specific soil treatments on crop growth. The treatment may be applied to soil in pots prior to the planting of the relevant crop. The pots can be maintained in a controlled environment to ensure that interference from other externals factors are minimised. |
| Method reference | |
| Complexity | The setting up of the trial pots is very simple but should be replicated and randomised to allow statistical analysis of results. |
| Technology | No complex equipment required. |
| Cost and time | Inexpensive, depending on what is being applied to the pots. The availability and use of greenhouse could have associated costs. |
| Interpretation | Basic visual interpretation of the affect on the plants being grown either by colour, amount of plant matter or seed or fruit produced. Plant tissue tests may also be used to demonstrate nutrient deficiencies in the crop. |
| Decision | Fair management decisions can be made from this method as it demonstrates: 1/ what needs to be measured 2/ what may be the visual affects of the treatment, and 3/ the impact of the treatment on the crop. |
| Value | This is a useful test as it focuses on one issue and is not impacted on by other things in the paddock. Pots can also be taken to field days or meetings to trigger discussion. |
2 Tests and tools for soil monitoring
2.1 Soil water monitoring
Receiving, storing and transmitting water are important functions of soil. The monitoring of soil water in the paddock provides growers with a greater understanding of soils and plant water use. In particular, growing season monitoring of soil water content (SWC) in the root-zone provides information on how much water the crop is accessing - this is a useful indicator of soil health.
There are three different ways that water content is measured in soil:
- Gravimetric SWC: the mass of water in the soil.
- Volumetric SWC: the volume of water in the soil.
- Soil water potential: the pressure or suction required to remove water from the soil.
There are also a number of limits and ranges for SWC that are important for plant growth:
- Saturated soil: all pore space is filled with water.
- Field Capacity (FC) or Drained Upper Limit (DUL): soil has as much water as can be held against natural or local drainage – some pores are filled with air.
- Permanent Wilting Point (PWP) or Crop Lower Limit (CLL): the SWC below which water cannot be removed by plants.
- Available Water Capacity (AWC): the amount of water that can be held in the soil and will be available to plants. This is calculated by the difference between FC and PWP per unit depth of soil.
These limits must be known in order to interpret the results of soil water monitoring, regardless of the measurement method. They are also essential inputs into the Yield Prophet® crop production model.
Combinations of direct and indirect methods are used to measure soil water, these are summarised in Appendix 1 (Soil Physical Tests).
2.2 Soil chemistry and soil fertility
Soil and plant analysis is a key part of any farming system. Testing soil chemistry is used to predict the fertiliser needs of future crops, monitor soil fertility, and to investigate poor plant growth or health. It also helps to monitor sustainability and soil health.
A basic data set for any soil investigation includes field texture, salinity (Section 2.2.10) and soil pH (Section 2.2.2). For field crops, row crops, orchards, vineyards and semi-permanent horticultural crops, a minimum of additional tests would be available Phosphorus (Section 2.2.5), available Nitrogen (Section 2.2.3) and exchangeable cations (Section 2.2.8). For pastures a minimum of additional tests would be available Phosphorus, available Potassium (Section 2.2.6) and available Sulfur (Section 2.2.7).
Plant testing and analysis of visual symptoms, are also important tools for assessing the supply of nutrients to the plant during the growing season and so are an important adjunct to soil testing. However, as this report deals with tools and systems for assessing soil health and not plant health, they are not discussed further here. For a farmer, testing soil chemistry and fertility helps to strike a balance between the risk of wasting fertiliser by applying too much, the risk of missing out on profits that might have been gained had enough been applied, making sure soil health is sustained or improved, and making sure that off-site impacts, e.g. nutrient run-off, are minimised.
When testing, it is important to select a credible laboratory that does tests that are field calibrated for the combination plant, soil and climate being investigated. Sampling that provides the best representation of the soil is also critical and strict guidelines should be followed.
The following provides a brief description of tests for soil chemistry. Further details on some soil chemistry tests can be found in Appendix 2. All the tests and tools listed in this section are laboratory methods. The soil tests listed here are described in more detail by Rayment and Higginson (1992), and the application of these tests to soil fertility investigations are reviewed and explained by Peverill et al. (1999). These two texts effectively set the industry standards in Australia and so are tools-of-the-trade when using soil tests. In-field tests for soil chemistry exist (e.g. Manutec pH) and are detailed in Appendix 2.
Table 1. General principles for chemical tests on soils
| Tool | Testing a suite of soil chemistry characteristics |
| Simple description and purpose | Either direct determination of an analyte (e.g. Soil Organic Carbon), or extraction of the soil in water, saline solution or acid followed by direct determination of the analyte (e.g. soil pH) or a component of the total (e.g. available P). In each case, a recommendation is formulated from interpretation of the test result based on a field calibrated relationship between: plant response to a fertiliser (e.g. Colwell P v. superphosphate); an ameliorant (e.g. pH v. lime); or an ameliorating practice (e.g. salinity v. drainage), and the test. |
| Inputs | The inputs include not only a representative soil sample, but also information on how the sample was taken, the objectives of the investigation, plant symptoms, paddock history and site characteristics. Department of Primary Industries Victoria (2009a). |
| Outputs | Information with which decisions are made on the use of ameliorants, fertilisers and/or ameliorating practices. |
| Calibration | Field calibration of soil chemistry tests is variable. Application of some tests is supported by extensive field trials, where as others have little field research from which to justify their use. |
| Complexity | Analytical chemistry is a complex science. Soil chemistry is complex and is affected by soil biology and soil physical characteristics to various degrees depending on the soil test. An understanding of these is needed to use soil tests. The simplest stage is obtaining a soil sample, but training is needed and care must be taken not to contaminate the sample and to collect a representative soil sample. The high degree of complexity in the remaining stages, are addressed by using a reliable government or commercial laboratory and a competent agronomist. |
| Technology | Requires special equipment from sampling to analysis. Requires a library of research reports on field calibration of soil tests. |
| Cost | Cheap compared to the cost of fertiliser and opportunity cost of getting it wrong. Costs are minimised by the use of government or commercial laboratories rather than by installation of an on-farm laboratory. On-farm laboratories analyse large numbers of samples to minimise the cost per sample incurred by capital costs and running costs. The costs of field calibration are already paid for when the research was funded by governments, the fertiliser industry and farmer levies. Consultancy costs (i.e. interpretation and recommendation) are either recovered by fertiliser sales or by direct billing of the client. |
| Decisions | Soil tests provide one source of information to determine fertiliser application and other soil ameliorating practices to managing plant growth and soil health. Key reference for Australian soils is by Peverill et al. (1999). |
| Availability | Some state governments have laboratories that undertake soil chemistry testing for agriculture. Commercial laboratory services are either provided by fertiliser suppliers or consultancy companies. Quality assurance , turn-around times and cost differentiate services. Short turn-around times do not signify excellence. Quality assurance can be checked on websites maintained by NATA (external link) and ASPAC (external link). |
2.2.1 Soil Organic Matter (SOM) and Soil Organic Carbon (SOC)
Measures of soil organic matter help assess fertility and structure. Typically, soil organic carbon content (SOC) is measured and soil organic matter content (SOM) is derived from SOC. The Walkely-Black method was once widely used to determine SOC (Baldock & Skjemstad 1999) but it does not consistently recover all soil organic carbon and as a laboratory method, it can be unreliable. Today, combustion (Dumas) methods are used providing automated, reliable, and cheap results using modern laboratory instruments.
To derive SOM from SOC:
SOM = SOC x 1.72
However, the conversion of SOC to SOM is inaccurate. Unfortunately, neither the Walkely-Black method, nor the combustion (Dumas) method, differentiates biologically active carbon from biologically inactive carbon, e.g. charcoal. To do so requires analysis using mid-infra red spectroscopy. With continued development, mid-infra red spectroscopy is likely to become more widely used.
2.2.2 Soil reaction (pH)
Soil pH measures the acidity, neutrality or alkalinity of soil. Tests of soil pH are used to detect extremes in acidity or alkalinity, and changes in soil pH. The availability of nutrients such as Phosphorus, Iron, and Molybdenum, and phytotoxic elements such as Aluminium and Manganese are affected by extremes in soil pH.
There are two methods of measuring soil pH in a laboratory:
1. Older method (pHw) - 1:5 suspension of soil in water
2. Newer method (pHc) – 1:5 suspension of soil in 0.01 M CaCl2
pHc more closely replicates the ionic strength of soil water and is less affected by variations in ionic strength (ionic strength is affected by the concentration and charge of salts in soil water). The soil water bathing plant roots varies in ionic strength and pH during the growth season. Unpublished research has shown that pHw is closer to soil solution pH in winter, while pHc is closer to soil solution pH when it is drier. While pHc is a better test for monitoring acidification in temperate Australia, calibrations of plant sensitivity to acidity and alkalinity, and lime requirement have been done using the pHw test.
Soil pH is used to estimate of the quantity of lime required to raise soil pH. Other information that is needed to estimate the lime required includes soil organic matter content and soil texture. These indirectly inform on the pH buffering capacity of the soil. Direct tests of buffering capacity can be used but these are not commonly offered as they are slow and expensive. Acidic soils should also be tested for the potential phytotoxicity of soil aluminium.
Soils that are too alkaline, and where it is feasible to acidify the soil, can also be managed using soil pH tests. As for liming acidic soils, estimates of the quantity of acidifying ameliorants are determined from the soil organic matter content, texture, starting soil pH and target soil pH.
2.2.3 Soil nitrate
Soil nitrate testing is used predict the Nitrogen (N) fertiliser needs of non-legume field crops. To measure soil nitrate the soil is sampled down to 60 cm and available N is extracted using saline solutions of potassium chloride (KCl). The forms of available N are ammonium, nitrate and nitrite. Nitrate is usually measured as nitrate-N. Some commercial laboratories report only available N, while others report ammonium-N and nitrate-N separately.
Nitrate is typically considered to be the main available form of N taken up by plants. But this perception is a product of the methods, conditions and objectives of the research which initially investigated this question, and the sampling times and objectives of soil investigations in which this test is used. The soil N cycle is complex and the forms of N in the available N pool are subject to seasonal conditions, management practices and soil type. Availability of N is controlled by soil biology. Losses of N are controlled by soil chemistry and physical characteristics, as well as soil biology.
There is no simple index of plant available N. It is difficult to calibrate and calibrations have focused on field crops other than legumes. In some situations ammonium is the major form of N in the available N pool and the form taken up by plants, so that care is needed when interpreting soil nitrate tests. Soil nitrate is used as just one of many pieces of information in decision support tools.
2.2.4 Total soil nitrogen (TSN)
Tests of total soil nitrogen (TSN) can be used to assess long term soil N trends.
TSN is measured by a combustion method that can be completed at the same time as measuring soil organic carbon. TSN was measured using the Kjeldahl method but was replaced by the more reliable and cheaper combustion methods. TSN test is less variable than tests of available N. This test has been calibrated in the Wimmera in Victoria to guide ley rotations.
2.2.5 Soil phosphorus (P)
There are two tests typically used to measure soil P: Colwell P and Olsen P. The Colwell P test is used widely for cropping in Australia. Colwell P primarily measures the quantity of soil P. Colwell P is measured using an extracting solution of sodium bicarbonate (NaHCO3). Phosphorus Buffering Index (PBI) is available to adjust critical Colwell P values as the interpretation of Colwell P is affected by the buffering of P due to Fe, Al and Ca minerals.
Olsen P is another test used to measure soil P, and measures a complex of the intensity and quantity of soil P. Olsen P is also based on an extracting solution of sodium bicarbonate (NaHCO3). Olsen P is calibrated in Victoria for pastures and wheat.
Conversions of one soil P test by either method into the other are crude and are best avoided. Most calibration research for soil P has been conducted measuring the soil P tests versus the fertiliser response in wheat. Little or no research has been done to calibrate soil P tests for other field crops. Soil P tests are not quantitative measures of the soil P taken up by the plant. Much of soil P is immobilised in forms not readily available to plants.
2.2.6 Extractable potassium (K)
In Victoria, DEPI has historically used the Skene K test for pastures. Commercial laboratories offer Colwell K (using an extracting solution of sodium bicarbonate as for P (Section 2.2.5)) and Extractable K tests. The latter is derived from data from exchangeable or extractable cation tests (refer Section 2.2.8). For practical purposes, most available K tests are equivalent. Crop responses to applied K have been rare in Victoria. Consequently, little research effort has been expended in calibrating soil K tests for field crops in Victoria. This may change as cropping moves into Victoria’s high rainfall zone.
2.2.7 Extractable sulphur (S)
Sulfur occurs in the mineral and organic fractions of soils, and the organic S fractions are highly correlated with Carbon and Nitrogen. Measurements of total S asses the size of the S pool, and as a result are poorly correlated to the plant uptake of S in response to fertilisers. Response to S has been rare in cropping in Victoria. This may change as cropping moves into the high rainfall zone.
There are several methods for extracting S from soils using an extracting solution of calcium phosphate (Ca(H2PO4)2. In Victoria, the former DPI developed the CPC-S test for pastures. The KCl-40 test is used for pastures in New England and can be used for the first or second canola crop after pasture in acid soils. It is not a good indicator for all crops. Many commercial laboratories use the CPC-S test without the charcoal step (used to remove soluble organic S from extract) which can introduce bias.
2.2.8 Cations
Cations and Cation Exchange Capacity (CEC) are measured using a variety of methods. For example, the ammonium acetate method, without prior removal of soluble salts, is a cheap, quick method used in many commercial laboratories to analyse surface soil. However, it is only suited to neutral or alkaline soil samples from temperate areas which are not organic, saline, calcareous or dominated by metal oxides. Methods have been specifically developed for soil samples which are high in soluble salts, calcium carbonate, organic matter, oxides of iron, manganese or aluminium, oxide nodules (buckshot), coffee rock, or are from Podosols, Ferrosols or Organosols.
The sum of exchangeable cations can be used to measure Cation Exchange Capacity, but it is better to directly measure CEC. Care is needed when using the sum of exchangeable cations to estimate CEC in acidic soils since exchangeable Al+, Mn2+ and H+ can occur in significant quantities. Care is also needed where soluble salts are present. Failure to remove soluble salts means that “extractable” cations, not “exchangeable” cations are measured, and cation exchange capacity cannot be estimated from the sum of extractable cations.
Exchangeable cation tests are mostly used to estimate Exchangeable Sodium Percentage (ESP) and Calcium:Magnesium ratios. These, along with field texture and tests of the water stability of natural and remoulded fragments, are used to assess gypsum requirement. Exchangeable potassium is used to derive available K to assess K fertiliser requirement.
2.2.9 Aluminium (Al)
In Victoria, DEPI has used the potassium chloride (KCl) extractable Al method. It was developed to assist in the establishment of lucerne. Other methods include extraction by calcium chloride (CaCl2), and exchangeable Al as a percentage of Cation Exchange Capacity (CEC). These are offered by commercial laboratories. Interpretation is specific to method, soil, plant species and varieties.
Soil tests of soluble aluminium are used to assess the potential for Al phytotoxicity and are used with tests of soil pH, field texture and organic matter to assess lime requirement.
2.2.10 Salinity
Soil salinity is usually assessed by measuring the electrical conductivity (EC) in a 1:5 soil:water suspension. The soluble salts consist mostly of the cations sodium, magnesium and calcium, and the anions chloride, sulphate and bicarbonate. Saline soils are very unfavourable for most plants. Salinity effects the ability of plants to extract water from the soil, and can cause undesirable soil physical properties. Many threshold levels for plant tolerance to EC are reported for the EC value of a saturated paste extract (ECe). EC is automatically done with soil pH tests. EC is converted to ECe using field texture. Tests of soil EC are not the same as salinity tests of potable water, surface water, sea water or ground water. Interpretation of EC is based on Victorian data and is for assessing salinity of dryland and irrigated soils, while interpretation of ECe is based mostly on pot data from the USA where it was developed for the irrigation industry. ECe can be measured rather than estimated from EC, but the method is more expensive and slower than the simple conversion of EC to ECe . In interpreting soil tests for EC it is important to know the method, soil texture and unit result reported in. EC can be reported in a variety of units (standard unit is dS/m) that greatly effect interpretation of the result.
2.2.11 Chloride (Cl)
Chloride is the most commonly occurring mobile (soluble) anion in Australian soils. Chloride only accumulates where drainage is poor so therefore testing for Cl is used to assess drainage and specific salt toxicity issues. Testing for soil Cl can also help to interpret the soil nitrate test. Chloride is simply extracted out of the soil using water by centrifuging/filtrating a soil/water suspension.
2.2.12 Micronutrients
Micronutrients of Zinc (Zn), Copper (Cu) and Boron (B) are also commonly measured in Australian soils. However, for each of these micronutrients there is little research available to confidently interpret soil tests.
The empirical methods used to measure these micronutrients are the:
- DTPA test (extracting solution containing chelating agents such as diethylenetriaminepentaacetic acid) for Cu and Zn;
- EDTA test (extracting solution of ethylenediaminetetraacetic acid) for Cu and Zn; and
- Hot calcium chloride (CaCl2) or hot water for B.
The DTPA and EDTA tests flag the need for leaf Zn and/or Cu analysis. Soil pH should be measured and the presence of soil calcium carbonate should be known when investigating Zn fertility. Soil Cu tests are calibrated for wheat in South Australia but there is no reported calibration for Victoria, although calibrations have been attempted for pastures in Victoria.
Boron is a mobile nutrient. Research has focused on B deficiency in horticulture and toxicity in field crops. Other factors that help to indicate potential for B toxicity in field crops include low rainfall, clay soil, sodicity, salinity, and free lime.
2.3 Soil carbon modelling
Many soil properties impact soil quality, but organic matter deserves special attention. It affects several critical soil functions, can be manipulated by land management practices, and is important in most agricultural settings across the country. Because organic matter enhances water and nutrient holding capacity and improves soil structure, managing for soil carbon can enhance productivity and environmental quality, and can reduce the severity and costs of natural phenomena, such as drought, flood, and disease. In addition, increasing soil organic matter levels can reduce atmospheric CO2 levels that contribute to climate change. Various tools are available to assess the changes in soil organic carbon (SOC) due various crop management and landuse systems (Appendix 3). These include two soil carbon indices: (i) Carbon calculator (DPI Unpublished 2008b) and (ii) Soil Conditioning Index (USDA 2002; 2003 a,b) and the simulation models: (i) SOCRATES model (Grace et al. 2006a, b), (ii) RothC model (Coleman and Jenkinson 1999) and (iii) CENTURY model (Parton et al. 1987, Bandaranayake et al. 2003). These tools were evaluated and summarised using the following nine criteria: (i) purpose, (ii) input variables, (iii) output variables, (iv) verifications, (v) complexity, (vi) technology, (vii) cost, (viii) availability, (ix) interpretation and decision.
The Soil Conditioning Index (SCI) is likely to provide long-term trend in organic carbon compared to the Carbon calculator. The SOCRATES is the simplest among three simulation models. It was reported that the accuracy of SOCRATES in simulating changes in SOC in agroecosystems was found to be superior to both the CENTURY and RothC. However, the RothC is widely used in Australia compared to SOCRATES and CENTURY models and is the preferred model in the national carbon accounting system.
Table 2. Tools for modelling soil carbon
Criteria | Tools | ||||
Carbon calculator | Soil Conditioning Index (SCI) | SOCRATES | RothC model | CENTURY model | |
| Input variables | Easily obtainable - three input parameters | Easily obtainable - seven input parameters | Eastily obtainable - six input parameters | Nine input parameters. Some local parameterisation needed | Six input parameters. Some local parameterisation needed |
| Output variables | Plant carbon input to soil | Trends in soil organic matter in the top 10 cm of the soil | Long-term changes in topsoil organic carbon | Long-term (several decades) total organic C content, microbial bio mass C content in the top soil, and radiocarbon age of the soil | Long-term (up to millennium) dynamics of Carbon, Nitrogen, Phosphorus and Sulphur. |
| Verifications | Limited sites in Victoria | Simple | Moderate simple. One week training required | Moderately complex One week training required | Complex One-two week training |
| Technology | Personal computer (PC) | PC | PC | PC | PC or UNIX platforms |
| Cost | Free | Free | Free | Free | Free |
| Availability | Personal contact | Web | Personal contact | Web | Web |
| Interpretation & Decision | Paddock level decision making | Paddock level decision making | Useful for paddock decision making | Useful for paddock and farm level decision making | Useful for paddock and farm level decision making |
Further information is contained in Appendix 3.
2.4 Soil biology
There are two approaches to measuring and monitoring soil biology. Often an economic approach is to consider a minimum data set (MDS) approach where a set of indicators may be measured and/or monitored. A more encompassing approach is a multi-parametric and integrated one – where a multitude of tests and indicators that considers the entire farming system are used. Often computer models would be included in such an approach. It is important to distinguish between measuring and monitoring for soil biology and management. Measurements (direct soil biology or indicators) give on the spot numbers to consider in terms of a healthy or unhealthy soil, or how a management strategy affects a particular measurement/indicator in a single season. Monitoring considers measurements or indicators in terms of longer term implementation of a particular farming system, looking for patterns and changes in soil biology. Monitoring may pay more attention to factors such as climate as well as changes in soil chemistry and physical structure.
When testing for soil biology you need to consider:
1. What is the need of the test? Is it to assist decision making for management options, or reassurance that a management practice in use is valid?
2. What is the question you are trying to answer?
3. What is the specific impact/effect of interest? (e.g. tillage, rotation, herbicide).
4. What knowledge is needed to interpret the tests?
5. What are the limitations of the tests?
Once a suitable test or indicator has been chosen you will need to consider:
1. Is the information general or specific? This limits the interpretation of a data set and what we can actually understand from the measurements.
2. Is there an established target value for the test chosen? e.g. healthy vs. unhealthy soil.
Targets for soil biology is an area of great debate amongst farmers and scientists alike. These targets should be based on large scale monitoring projects and data collation. Rating scales could then be implemented to make useful meaning of a measurement. If using targets be sure to consider whether the target value is relevant for the region (e.g. soil type and climate) and management practices employed. Often great variability exists between regions as to what might be considered a normal/healthy measurement relative to a particular management strategy. A healthy value in one region may well be below par in another. Many tests and indicators have been developed to measure and monitor different factors that relate directly to soil biology (refer Appendix 4). Technologies employed to measure and monitor soil biology maybe considered as low resolution (e.g. simple earthworm counts), or more sensitive high resolution (e.g. Microarray Technology). Often the measurements are indirect indicators of soil biology e.g. earthworm counts give us information about things like C levels and soil structure. Other biological tests may be more direct, such as Microbial Biomass, where the data tells us exactly what microbial C or N is in the soil. Each approach reveals different information about soil biology and each test has its own strengths and weaknesses.
2.5 Soil borne pests and diseases
There are many organisms in soil that can have a harmful affect on plant growth. Three of the main diseases concerning farmers and agronomists in broad acre farming are: Take All, Rhizoctonia and Crown Root. The impacts of any of these on farm income can be very severe with large yield loss occurring if the pest or disease is allowed to reach even moderate levels.
The key to managing pests and diseases is being able to detect their presence in the soil when they are at low levels. Tests for soil borne pests and diseases are detailed in Appendix 5. When the pest or disease is treated early it is likely to have a lesser impact on yields and farm profitability, and will hopefully be less expensive to control. Inspections of plants throughout the season, both above and below ground, is the most effective way to monitor for pest and disease presence and abundance. Practices that decrease the opportunities for the pest or disease to multiply in the paddock include:
- the use of a resistant plant variety;
- not sowing consecutive susceptible crops;
- mechanical intervention; and
- chemical intervention practices.
These practices all have different costs and physical impact on the soil and soil biota.
Common Armyworm, Common Cutworm (Bogong moth), Brown Cutworm, Black-headed (BH) Pasture Cockchafer, Red-headed (RH) Pasture Cockchafer, Pasture Webworm, Cereal Cyst Nematodes (CCN) and slugs are some of the more common pests that farmers and agronomists focus on (Appendix 5). It is debatable as to whether some of these are soil borne pests. However, they spend part if not all of their life cycle in the soil for shelter, food or breeding, and some of the control practices target the soil, therefore the pests and diseases are considered to be soil borne.
Management of these and other pests requires knowledge of the conditions that trigger population increases, and therefore monitoring crops at the appropriate times. For example:
- A wet spring may trigger a faster breeding cycle of one of the Cockchafers.
- Strong winds from the right direction and at the right time may blow in adult bud worms that then lay large numbers of eggs that all hatch at the one time.
- Growing certain plants may encourage higher populations such as Cockchafers in pasture paddocks.
The various practices used to control soil borne pests and diseases have differing impacts on soil structure and soil health. For example, cultivation to reduce Red-headed (RH) Pasture Cockchafer disturbs soil structure and may cause compaction.
As practices improve for managing these pests and diseases, other pests and diseases may become more prevalent and fill the gap (e.g. Root Lesion Nematode (Pratylenchus thornei andPratylenchus neglectus)).
The future may see genetically modified crop varieties that are more resistant to these pests and diseases. For the present monitoring and knowledge of life cycles, and accepted management practices are the tools to control soil borne pests and diseases.
2.6 Kits for assessment of soil health
A soil health assessment kit is a collection of selected field procedures to evaluate the physical, chemical, and biological properties of the soil. Physical properties assessed by the kits generally include bulk density, water content, infiltration rate, aggregate stability, slaking, and morphological estimations. Biological properties measured include soil respiration and earthworms. Soil chemical properties measured include pH, electrical conductivity (EC), and soil nitrate levels. The tests, or indicators, are designed as a screening tool to provide immediate results for comparing management systems, monitoring changes in soil health over time, and for diagnosing possible soil health problems due to land use and management. All kits include a guide that provides a list of supplies and instructions for conducting the on-farm tests, and interpretive information for each test.
These tests can be easily conducted on the farm by trained field personnel or by landowners themselves to assess the health of their soil. Use of the kit allows advisers to be an active participant with the landowner in the assessment of soil health. The assessment will provide the opportunity to discuss management options when the need arises.
2.6.1 USDA Soil Quality Test Kit
Test kit 1. USDA Soil Quality Test Kit
| Name of test | USDA Soil Quality Test Kit |
Description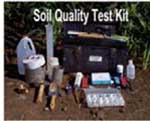 | A quantitative assessment kit that can provide results to diagnose possible soil problems, such as compaction or salinity, compare management systems and monitor changes in soil quality over time. The kit uses a minimum dataset of indicators chosen primarily for agricultural soils quality assessments, which are integrated into quantitative tests for biological, chemical and physical properties of the soil ecosystem. A total of 11 tests can be performed, including soil respiration, infiltration, bulk density, electrical conductivity, soil pH, soil nitrate content, aggregate stability, soil slaking, earthworm counts, and various observations of soil physical attributes. The kit consists of a portable box, which includes most of the equipment needed to complete the tests. A guide is included in the kit. |
| Method reference | United States Department of Agriculture (1999a) |
| Complexity | The kit is simple to use and provides relatively quick results without sending the sample off-site to be analysed. |
| Technology | All equipment is contained within the kit. Distilled water, a shovel and access to electricity is necessary for completion of some tests and is the only addition required. |
| Cost and time | Cost unknown, estimated $800. Most tests are relatively rapid, but some tests require several hours (or days) to undertake. |
| Interpretation | See evaluation below. |
| Decision | The test kit may facilitate sustainable management decisions. The test kit is sensitive to changes in soil properties due to management and is able to identify potential problem areas in the field tested – see evaluation below. |
| Value of test | A valuable tool to help increase the awareness of soil quality issues – see evaluation below. |
Evaluation of USDA Soil Quality Test Kit
The USDA Soil Quality Test Kit has been evaluated in various studies in the United States (Seybold et al. 2001; Liebeg et al. 1996). The Alberta Environmental Sustainable Agriculture (AESA) Soil Quality Program evaluated the kit in a variety of management systems and soils across Alberta, Canada (Winder et al. 2003). The evaluation also determined if the kit was easy to use and interpret, if the kit was sensitive to differences due to management, and to determine the accuracy of the results against those obtained through standard laboratory analyses.
The evaluation made the following conclusions:
- The kit could be used to detect differences between management systems in most situations.
- The kit was useful for characterising soil quality in the field and comparing relative changes in soil properties, but site characteristics must be known in order to interpret some of the results.
- The results from the kit were consistently lower than those from standard lab analyses for pH, EC and nitrate content, however, interpretation of the results is similar to lab interpretations. This indicates that the kit is able to provide measurements for the purpose of monitoring soil quality and identifying problem areas in the field.
- The kit is easy to use in the field, as each step of the procedures is described in detail in the users guide.
- The results interpretation section of the guide provides the user with some indication of where problems may exist in the field but does not provide any management related solutions.
- The kit is a valuable tool to measure important soil parameters in-situ.
- It gives land managers the opportunity to become familiar with the health of their soils and provides them with relatively quick results, which may lead to improved management decisions in the future.
2.6.2 ‘Healthy Soils for Sustainable Farms’ (HSSF) Soil Health Assessment kit
Each of the individual kit components are described in Appendix 1 (Soil Physical Tests), 2 (Soil Chemical Tests) and 4 (Soil Biological Tests). The tables in the appendices relevant to the HSSF Soil Health Assessment kit are denoted as such. The comments in the appendix tables are based on the experiences of the DEPI Healthy Soils Officers in using the kit with growers.
Test kit 2. HSSF Soil Health Test Kit
| Name of test | HSSF Soil Health Test kit – general overview |
| Description | Based on the USDA Soil Quality Test Kit (USDA 1999 a), this is a complete kit to provide a quantitative assessment of the current status of the soil as a medium for productive plant growth. The kit was developed by Queensland University of Technology (QUT) and includes field-based tests to identify the effects of management practices through interpretation of soil properties. The kit includes equipment for biological, chemical and physical tests. A total of 10 tests can be performed, including soil respiration, infiltration, bulk density, electrical conductivity, soil pH, soil nitrate content, soil stability, earthworm counts, mineralisable nitrogen and observations of soil physical attributes. Kit includes a 47 page User Guide, a summary page of the procedures, a soil health score card and a tool box containing the equipment. |
| Method reference | Grace and Weier (2007) |
| Complexity | Although designed to be used by growers, users need to undertake a minimum 1-3 hr workshop including a field demonstration of the kit before satisfactory skills will be obtained. Most growers would not find the kit ‘user friendly’ without training. Some techniques are easier to follow than others, but generally easy to undertake after some training. Support should be provided to users with continued use and interpretation of the kit results, e.g. follow-up workshop (6-12 months) after initial training. If monitoring changes in the soil over time, need to sample at the same time each year, preferably when the soil profile is moist (spring). Also need to choose a sampling location within the paddock that best represents the management treatment. |
| Technology | All equipment is contained within the kit. Rainwater is the only additional requirement. |
| Cost and time | Approximately $800. Most tests are relatively rapid, but some tests require several hours (or days) to undertake. |
| Interpretation | The interpretation pages in the User Guide are fairly generic and most tests require minimal expert knowledge. Limited interpretation of the impact of the test results on crop productivity. Time of sampling is important because soil properties vary within a season and with management operations. |
| Decision | Some of the tests can be used for in -paddock decisions when comparing different management practices. |
| Value of test | A useful ‘one-stop-shop’ to quantitatively measure soil health. Can be used to diagnose possible soil problems, compare management practices and monitor changes in soil health over time. A useful educational tool for advisers, but of limited value for growers who have not undertaken initial training in the use of the kit, or who have a low knowledge base. |
Evaluation of HSSF Soil Health Kit
“The kit is fine and because it’s tangible people want one (and sometimes use it) but we felt it lacked a structure to make it obvious why you assessed the 12 or so things it can measure. Of course in grain systems, people already use commercially available and superior tests to some of the test kit tests. However, the test kit remains a useful tool to engage people and discuss soil health.” (David Lawrence, QLD agronomist).
Case Study – New Zealand Visual Assessment Method for Soil Health
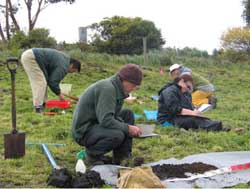 Figure 2. Staff from the former DPI carrying out field visual assessments on a dairy farm in south west Victoria. | In 2006 and 2007, the Heytesbury District Landcare Network’s ‘Soil and Water Dairy Action Program’, funded by the National Landcare Program, evaluated the New Zealand Visual Soil Assessment (Shepherd 2000). The hypothesis was that the visual assessment tool would generate similar ‘scores’, regardless of operator. To test this hypothesis, two assessors independently undertook the visual assessments at each monitoring site. The NZ Visual Soil Assessment (Shepherd 2000 and Shepherd et al. 2000) involved two parts: Visual assessment of soil indicators involving site characterisation (texture of surface soil, moisture condition at time of sampling and seasonal weather conditions), then scoring of soil structure and consistence; soil porosity; soil colour; number and colour of mottles; earthworm counts; and a scoring of surface relief. Visual assessment of plant indicators including pasture composition, pasture growth and regrowth rates, pasture utilisation, areas of bare ground, drought stress of pastures during dry periods, degree of surface ponding, stock carrying capacity and fertiliser use. |
Results of the Heytesbury project showed an agreement between independent observers, but the correlation was not as high as expected. There was good agreement between the field pH and the analytical results for pH. Farmers concerned about low pH levels could quickly and cheaply check a large number of soils within their paddocks to assess whether lime is required or, if in doubt, whether further tests should be undertaken.
There was a significant correlation between the soil strength scores for all observers and the quantitative measures from the cone penetrometer. As a rapid, low-cost indicator of soil strength, this test was particularly useful. However, soil strength is not a good indicator of soil health as it varies with soil water content.
There was no correlation between the visual assessment score and soil Olsen P or Skene K levels - parameters identified earlier as being important in the Heytesbury region.
The New Zealand Visual Soil Assessment did not meet the expectations of the project team with regard to consistency between assessors, or to detecting potential soil health risks. However, the tool may be useful for service providers and others involved with farmer groups to generate interest and understanding of soil types and soil health issues. Field measurement of soil pH has the potential to alert farmers to low soil pH levels, but low field pH tests should be followed up by a quantitative soil test from a bulked sample. Soil health self-assessment tools are not recommended as a surrogate for soil testing.
Information & photograph provided by Greenwood et al. (2008)
2.7 Soil health score cards and indices
A Soil health score card, put simply, is a practical tool that can enable anyone interested in their soil to monitor soil health (Jenkins 2006). The idea was developed by the Natural Resources Conservation Service: Soil Quality Institute of the USDA (United States Department Agriculture), which defines it as a simple rating system that people can use to evaluate and monitor soil health or compare practice effects on soil health. Essentially it is a collection of a few (usually around 10) easy tests to monitor the health of soil. The tests are carried out every 6 to 12 months. The USDA prepared a comprehensive guide to the development of soil quality score cards (USDA 1999b) and a number of examples can be found through the USDA soil quality (external link) website.
Australian examples of the approach are shown below.
A Soil health score card should complement other soil tests, such as laboratory chemical tests, rather than be exclusive of them. Most importantly the importance of farmers driving the process is stressed (Jenkins 2006).
It has been shown that a Soil health score card can be used effectively to:
1. Raise awareness of soil health, and what soil health really means
2. Foster farmer discussion and interest in soils issue
3. Encourage documentation of observations
4. Provide a holistic understanding of soil health, as opposed to standard chemical analysis
5. Introduce landholders to documentation of indicators and interpretation for management decisions
(Jenkins 2006).
Score card 1. Northern Rivers Soil Health Card
| Name of test | Northern Rivers Soil Health Card – A soil management tool developed by farmers for farmers. |
| Description | The Soil Health Card was developed as a practical tool for farmers in the northern rivers region of NSW to monitor the health of their soils. A loose-leaf document of 10 visual soil tests (12 black-and-white A4 pages) including: ground cover, penetrometer, infiltrometer, diversity of soil life, root development, soil structure, aggregate stability, earthworms, soil pH,and a leaf colour observation. |
| Method reference | Tuckombil Landcare Inc. (2002) |
| Complexity | Intended for farmers across a range of industries. Little or no training would be required to undertake the simple tests. |
| Technology | No specialist equipment required. All equipment can be easily manufactured by the user. |
| Cost and time | Inexpensive and relatively rapid. |
| Interpretation | A scoring and interpretation sheet is provided for the 10 tests described by the Soil Health Card. Each test can be scored on a scale of 1–9 in categories of poor (1–3), fair (4–6) and good (7–9). There is no overall value of soil health calculated. |
| Decision | Would not use for in-paddock decisions, but a useful educational tool. Some benchmarks available. |
| Value | A useful educational and practical tool that landholders can use to monitor the health of the soil. |
| General comments | As per New Zealand visual assessment guide (page 16), the tool was trailed by the Heytesbury Soil Health project in south west Victoria in 2006-07 (Greenwood et al. 2007). The card was generally well received by landholders, but it was suggested that scoring of soil health has the potential to be controversial and contentious for individual farmers and the industry when scores are low (or poor) compared with benchmarks. |
Score card 2. Monitoring Land Condition – Field Recording Booklet
| Name of test | Monitoring Land Condition: a field recording booklet |
| Description | Two A3 charts are used to record four sets of indicators; plant measurement, water use efficiency, stubble management, and soil measurements. A fifth section of the chart is used to record yield limiting factors for the previous year and actions for the coming year. The charts have provision for five annual records for one paddock or management unit. |
| Method reference | Bourne J (1998). |
| Complexity | Relatively simple to understand and interpret. Designed for farmer use. |
| Technology | Sodicity, pH, and EC (surface and subsoil); Nitrogen (0-60 cm); Phosphorus, Sulfur and Organic Carbon (0-10 cm); mechanical breakdown in surface soil (e.g. from tillage); and stubble (percent initial and final cover). |
| Cost and time | Crop factors (previous; sowing date; rate; grain yield; protein; hay cut; pasture DM). Water use efficiency (Apr-Oct rainfall; potential yield (French); yield as percent potential). |
| Interpretation | Very simple but availability of replacement charts is a limitation. Could readily be translated into a computer based spreadsheet system. |
| Decision | Very low cost and time efficient. |
| Value | Requires additional interpretation tools but has provision to integrate crop performance with soil health and paddock management. |
| General comments | The information collation in the charts is geared to making a decision – the fifth section of the chart. Could form a useful basis on which to build a soil health management plan. |
3. Tools for soil management
3.1 Decision Support Tools
What is a decision support tool (DST)? Is it a computer program, is it a book with a decision tree or table, or is it the people you discuss an issue with? Well a decision support tool is what ever you use to help make decisions. This summary will be discussing a few examples of decision support tools, but a good start for anyone before going any further is to think about the decision support tools they use now and the strengths and weaknesses of each.
A computer program can be a very simple or very complex DST depending on the person’s needs. A simple DST is one that allows the operator to retrieve information such as paddock history and use this for future decisions. Complex DSTs such as Yield Prophet®, Mallee Calculator, and AgriGater all require the input of data such as rainfall, fertiliser, target yields or production costs. Once the data have been entered, the program can be interrogated to see what the DST predicts as the most likely outcome for certain activities or events. Rainfall-to-yield DSTs will normally use the known rainfall to that point in the season and run rainfall scenarios for the rest of the season to predict yields. More complex DSTs could have soil data entered so that the calculations take into account the moisture and nutrients needed to match these yields. The complexity of the DST can be increased again to provide predictions of financial return or gross margins for production. In this case, input costs to produce the different crop yields must also be entered into the DST. All of this builds up the complexity of the DST and if the data entered are not accurate then the outputs will be unreliable.
Model 1. Yield Prophet®
| Name of test | Yield Prophet® |
| Description | Yield Prophet® simulates crop growth based on paddock-specific inputs of soil type, pre-sowing soil water and nitrogen, rainfall, irrigation and nitrogen fertiliser applications, and climate data. Yield Prophet® uses the computer simulation model APSIM together with paddock specific soil, crop and climate data to generate information about likely outcomes of farming decisions. Yield Prophet® does not generate recommendations or advice. |
| Method reference | Birchip Cropping Group (2008) |
| Complexity | A computer model that requires a basic understanding of computer operations. The user must also understand the importance of the data being entered. |
| Technology | Access to a computer and an understanding of soil test results. A user with basic soils knowledge should not have trouble using this tool. |
| Cost and time | Single farm, group and corporate subscription rates. Approximately $110 per paddock. |
| Interpretation | Yield Prophet® predicts Nitrogen well, and fair on plant available water |
| Decision | The predictions/outcomes of the Yield Prophet® tool are heavily dependent on the quality of the data entered, including that the data is correct for the location. As a decision support tool Yield Prophet® provides another tool for better understanding of soil potential and rainfall. |
Model 2. Mallee Calculator
| Name of test | Mallee Calculator |
| Description | The Mallee Calculator is a simple spreadsheet tailored to Mallee conditions. It was devised to help farmers in their estimates of potential yield and nitrogen fertiliser requirements of cereals and canola. It has been developed by CSIRO Land and Water, Adelaide. The Mallee Calculator can be used in two decision making modes: To determine a single application of nitrogen fertiliser at sowing. This is the simplest strategy, but involves the full risk of uncertain seasonal conditions. To determine a split application of nitrogen fertiliser. The model allows for a revision of nitrogen fertilisation decisions in August-September that take into consideration the actual amount of rainfall from sowing to the time of revision, and the initial amount of fertiliser applied. If farm logistics allow it, split or delayed application of nitrogen fertiliser is a valuable tool for management of risk. |
| Method reference | CSIRO Land and Water (2005) |
| Complexity | A computer model that requires a basic understanding of computer operations. The user must also understand the importance of the data being entered. |
| Technology | Access to a computer and an understanding of soil test results. |
| Cost and time | No cost associated with this software available free to download. Time and willingness is required to sit down and enter the data into the model is required. |
| Interpretation | Is good on Nitrogen prediction and fair on plant available water. |
| Decision | The predictions/outcomes of the Mallee Calculator are heavily dependent on the quality of the data entered, including that the data is correct for the location. As a decision support tool, the Mallee Calculator provides another tool for better understanding of soil potential and rainfall. |
Model 3. AgriGater
| Name of test | AgriGater |
| Description | AgriGater can be used to calculate cost of production, gross margins and analyse budgeted financial performance for grain, livestock and horticultural enterprises. For soil issues, it can be used to calculate the cost of a soil activity or input and the impact of that on profitability. |
| Method reference | Department of Primary Industries Victoria (2008c) |
| Complexity | A computer model that requires a basic understanding of computer operations. The user must also understand the importance of the data being entered. Knowledge of farm paddock production figures is necessary. AgriGater is a computer based database that works from a default information base but that can be refined to an individual’s farm by inputting their own figures. |
| Technology | Basic computer skills. |
| Cost and time | No cost associated with this software available free to download. Half a day should be sufficient to enter primary data for the farm. Scenarios can be run quite rapidly once the primary data are set up. |
| Interpretation | Gross margin comparisons for different scenarios of crop, stock and machinery management. |
| Decision | Provides a useful decision support in planning the annual farm investment. |
A decision tree is a series of linked questions that enable the user to reach a decision that is based on the inclusion or exclusion of particular conditions related to the issue. An example for diagnosing the management of acid soil in Western Australia taken from a decision tree for diagnosing problem soils is shown in Figure 3.
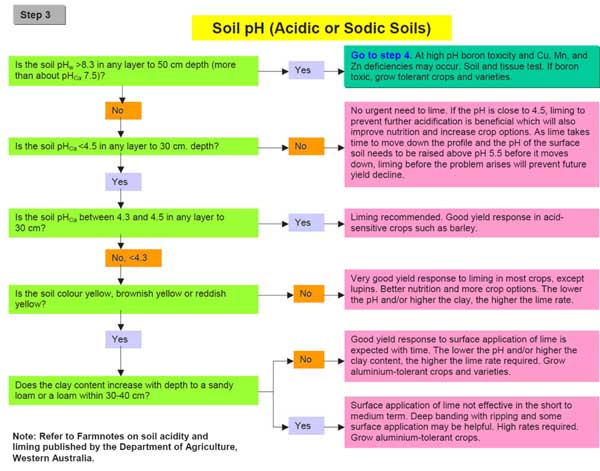
Figure 3. Decision tree for management of acidic or sodic soils (reproduced from Department of Agriculture WA 2005)
DSS 1. Identifying hostile subsoils
| Name of test | Identifying, understanding and managing hostile subsoils for cropping |
| Description | Publication with diagnostic guide (decision tree) to assist in directing the reader to the chapter relevant to their issue. |
| Method reference | Department of Primary Industries Victoria (2004) |
| Complexity | The publication has many chapters covering topics such as soil type, salinity, sodicity and field diagnostics. It is comprehensive enough to provide information and does sign post peoples direction. |
| Technology | A fair understanding of scientific principles is needed. |
| Cost and time | The publication is free. Any costs associated with testing that may need to be undertaken as a result of the information presented in the publication may need to be considered. |
| Interpretation | Individuals’ ability to interpret the information presented in the publication will depend on their knowledge and understanding of the topics, or access to people who can help them. |
| Decision | A tool to facilitate discussion for people with a fair understanding of soils, but will not aid decision making for those with little to no prior understanding of soils and subsoil constraints. |
3.2 Web resources for soil health and soil management
This chapter provides an inventory of soil health related material resourced from the internet. The web resources cited may contain fact sheets and information brochures, instruction and assessment manuals, and/or general web text and images that may not necessarily be available in a downloadable format.
3.2.1 International web resources
- Alberta Agriculture and Rural Development (external link) - The Alberta Environmentally Sustainable Agriculture (AESA) Soil Quality Resource Monitoring Program was established in 1997 (Alberta Agriculture and Rural Development 2007).The program focuses on monitoring, extension, risk assessment, and science development in soil quality. The program has included several benchmark sites, aimed to determine the state of soil quality across Alberta and to determine the risk of change in soil quality with various management practices. Reports of the results of these benchmark sites are available on the website. The main page of this website was last updated in August 2008.
- The Soil Quality Program of the Canada-Alberta Environmentally Sustainable Agriculture Agreement (external link) also included benchmark sites, and fact sheets on wind erosion, water erosion and salinity can be found on the associated website. The website was last updated in March 2009.
- Cornell University Soil Health (external link) - The Cornell Soil Health website (Cornell University Soil Health Team 2005) includes some basic definitions and information on soil health including ‘What is soil health?’ and ‘Why is soil health important?’ The website promotes the Cornell Soil Health Manual (various components of the Cornell Soil Health Manual in Appendix 1), a resource found to be very useful by the DEPI Healthy Soils Team.
- Landcare Research New Zealand (external link) SINDI (soil indicators) is a web-based tool designed to help you interpret the quality or health of a soil you have sampled (Landcare Research New Zealand 2009). Ten indicators have been selected to characterise the intrinsic resources, and biological, chemical and physical properties of a soil. SINDI allows you to:
- compare your soil with information from our soils database
- assess the intrinsic resources and biological, chemical and physical quality of your soil
- see how your soil measures up against current understanding of optimal values
- learn about the effect each indicator has on soil quality and some general management practices that could be implemented to improve the soil
- The webpage clearly states that SINDI and the indicators used by the tool are not intended as a basis for fertiliser requirements, and that the indicators themselves to not measure soil quality. “Soil quality is a value judgement about how suitable a soil is for a particular use”. The website does not contain any supporting material on what soil quality is, or any downloadable information on the properties used as indicators of soil quality. The links to the Landcare Research New Zealand pages that may contain this information are currently broken.
- United States Department of Agriculture – Soil Quality website (external link) - The USDA Soil Quality website (2009) contains several elements pertinent to this report. The website provides information sheets of several soil properties including aggregate stability, available water capacity, bulk density, infiltration, soil crusting, soil structure and slaking. The website also contains links to assessment guidelines, score cards, and the USDA soil health test kit. Some of the information available to download for the USDA soil health assessment includes:
- ‘Guidelines for Soil Quality Assessment in Conservation Planning’ – 48 page PDF, January 2001.
- ‘Soil Quality Test Kit Guide Fact Sheet’ – 2 page PDF, March 2003.
- ‘Soil Quality Test Kit Guide’ – 88 page PDF, August 1999. The USDA Soil Quality website also details information relating to soil biology, and includes some downloadable technical notes and references to other texts. Last updated June 2009.
- Soil Foodweb Inc. (external link) - Dr. Elaine Ingham is President and Director of Research at Soil Foodweb Inc. (2005), a small business that grew out of her Oregon State University research program. The business is essentially a lab service, offering sample and product testing in the USA, Australia, Canada, New Zealand and South Africa.
- This website contains information regarding soil biology and the soil foodweb, including details on how to sample and interpret “soil foodweb assays”.
- Sustainable Farming Connection (external link) - This website, created by the Committee of Sustainable Farming (1997) has the subtitle ‘Where farmers find and share information’ and contains many links to other web resources. This website does not contain soil health information and/or downloadable material, but links to several of the web pages already detailed above.
The company now extends to Australia with the Soil Foodweb Institute Australia (external link) (last updated May 2009).The Australian web page includes downloadable information on topics such as ‘Benefits of a healthy foodweb’. There are ‘Soil Foodweb Newsletters’ downloadable from the website; however the most recent available newsletter is from early 2007.
3.2.2 National web resources
- Better Soils Agricultural Bureau of South Australia (1997) developed the Better Soils website through the Better Soils Project. This website contains information in the form of text and images, grouped into Module topics including:
- Module 1 -an overview of the characteristics of healthy soils, soil classification and erosion potential
- Modules 2 -soil and crop nutrition
- Module 3 – soil and pasture nutrition
- Module 4 -soil biota and soil health
- Module 5 – management of soil moisture
- Module 6 – physical, chemical and biological barriers to effective root growth The website also includes many downloadable fact sheets on topics such as ‘Properties of a healthy soil’, ‘Does summer weed control save soil water?’ and ‘Root facts’. Links to many other national and South Australian web resources are also available at Better Soils.
- Department of the Environment and Heritage (external link) - The Australian Government’s web page on Soil Condition is managed by the Department of the Environment and Heritage (2008). Soil properties related to sustainable production and environmental protection are linked to the measurement of particular indicators for monitoring soil condition including:
- soil acidity (pH)
- soil organic carbon
- soil erosion by water
- soil erosion by wind
- New South Wales Department of Primary Industries (external link) (NSW DPI) ‘Soil health and fertility’ pages on the NSW DPI (2005a) website provides information and downloadable documents on a wide range of topics, including:
- Fertilisers and soil improvement
- Soil types, structure and condition
- Soil biology
- Soil carbon
- Soil management guides
- Soil acidity
- Acid sulphate soils
- Sodic soils
- Soil erosion
- Testing and assessing soil
- Salinity The website also includes a list of recent news releases.
- SOILpak (external link) is a particular resource of the NSW DPI (2005b) that is available from the website in a downloadable form. SOILpak is intended for managers who want to learn more about how to manage their soil, and consultants and extension officers who wish to become more skilled in advising their clients on soil management. By following the link ‘Soil management guides’ on the website, SOILpak is available for:
- cotton growers
- dryland farmers on the red soil of Central Western NSW
- northern wheat belt
- southern dryland farmers
- southern irrigators
- vegetable growers
- Back Paddock Company (external link) - Back Paddock Company (2009) is an Australian company that provides tailored advisory services and products to agriculture. The website provides information through ‘SoilMate’, however you have to be a member with a log-in and password to access this information. The Back Paddock Company conducts certified training courses in soil chemical testing, and the website provides a useful link to training opportunities.
- Queensland Department of Natural Resources and Water (QDNRW) (external link) (last updated April 2009) has a range of fact sheets relating to the recognition, extent and management of a range of land degradation issues such as erosion, acidification, compaction and salinity. There are also a number of fact sheets on acid sulphate soils.
- Soil Foodweb Institute Australia (external link) - As detailed above, the Soil Foodweb Institute Australia (2009) webpage, of the business Soil Foodweb Inc. (2005), contains some downloadable information and newsletters.
- Soil Health (external link) - This website simply named Soil Health is funded by the Ian Potter Foundation and is headed by Professor Lyn Abbott of the University of Western Australia (Abbott 2005a). The website focuses on soil biology, but does include some brief information on soil chemistry and physics with the intention to develop these components of the website in the future. Topics include soil fungi, organic matter, roots, bacteria, animals and soil fertility. The information is presented as web text only and not as downloadable documents. The website also link to downloadable newsletters titled ‘Soils are Alive’, however these have not been updated since 2005. The website was last updated in 2008.
- Professor Lyn Abbott is also the chief of the Australian Soil Club (external link) (Abbott 2005b). This club and its associated website have been “established to develop a national network of land managers and others interested in increasing their knowledge of soils and sustainable land management practices”. The website contains some information and photographs of soil types.
- Soil Quality (external link) - The University of Western Australia and the Department of Agriculture and Food Western Australia are the key contributors to this newly developed website through the ‘Healthy Soils for Sustainable Farms’ program. The website is authored by Soil Quality Pty Ltd (2009) and provides information in the form of downloadable fact sheets on several soil biology, chemistry and physics properties and issues.
- A key element of this website is that it provides a tool to search by region and compare soils data (some biological, chemical and physical) within a local catchment. This website is currently populated for Western Australia only, but the intention is to develop this across Australia. There is some concern of the suitability of such a tool in states such as Victoria where soils are highly variable (in comparison to Western Australia’s generally deep sandy profiles).
The website also links to some Decision Support Tools (calculators) such as the Green Manure Calculator, Wheat Yield Potential Calculator, and the Lime Comparison Calculator.
- Tasmanian Department of Primary Industries and Water (external link) - The web page of interest within the broader Tasmania DPIW website is ‘Land Management and Soils’ (2009). This page links to further information on salinity, soil resource assessment, and soil management. The soil management section is particularly pertinent to soil health, containing information on soil structure, salinity, irrigation, wet soils and integrated catchment management. The website also details options for managing soil health, providing some guidelines and information in the form of calendars (i.e. green manure calendar), calculators, and assessment procedures (i.e. ‘Looking for Compaction’ and ‘Testing if the Soil is Right to Rip’).
The website also offers some decision support to farmers as it details sampling and analyses procedures and considerations, “issues to consider”, timing and rates of application, “things to remember”, and “what to do?”
Information is only provided in the form on online text, tables and graphs, and is not available in a downloadable form (e.g. Fact sheets). Website last updated July 2009.
- University of New England (external link) - The University of New England (2007) web page titled ‘Oz Soils v 3.0’ provides a downloadable demo version of the Oz Soils program. This program is designed as a classroom tool, providing an “interactive introduction to soil science”. The website does not provide any online information relating to soil health, but the Oz Soils tool is widely used throughout universities and teaching institutions for soil science. However, Oz Soils is currently being updated and is unavailable.
- Victorian Resources Online The Department of Primary Industries Victoria (2008d) authors a website titled Victorian Resources Online (VRO). This website contains detailed information on soils in the form of online text, downloadable documents and reports, maps and images. Pages on soil health are being populated and currently provide links to other soil health web resources and tools.
- VRO also details much information on themes such as climate, landform, land use, vegetation, biodiversity, water and marine. VRO can be searched by theme/subject, or by geographical area.
The Healthy Soils Team use VRO extensively in project development and work, and find VRO to be an excellent web resource.
4 Training and education for management of soil health
4.1 Soil Management Training Courses for Australian Cotton Industry (1997-1999)
 | Hands-on training in soil management was provided to 170 members of the Australian cotton industry (focused on needs of private consultants and Government advisers) at a series of 11 courses between 1997 and 1999 in both Queensland and New South Wales. The main aim of these was to demonstrate how to use 'SOILpak for Cotton Growers, Third Edition' (McKenzie 1998) with an emphasis on soil sampling for yield map interpretation and soil monitoring for farm accreditation. Most of the time allocated to each course was spent in and around backhoe inspection pits in commercial cotton fields. Practical training was used to transfer soil diagnostic skills. At each training site, subgroups described a soil pit and agreed on an appropriate management recommendation for that site. Major topics discussed were:
|
The SOILpak for Cotton Growers manual (McKenzie 1998) aims to assist cotton growers to improve their soil management and focuses on one major soil type (i.e. Vertosols). The history of its development is outlined in the paper by Daniells et al. (1996). It involved gathering available information on soil management from researchers, agronomists and leading growers to present in a user-friendly format.
Assessment of yield trends and a survey of SOILpak clients indicated that the manual had assisted in improving farming practices. By helping growers to make soil management decisions, the manual assisted the industry's trend towards adopting minimum tillage, permanent beds, and controlled traffic. It provides favourable land management options for growers and their advisors, based on the results of a semi-objective assessment of soil structure.
SOILpak manuals are now available for dryland farmers on red soils of Central Western NSW, northern wheat belt, southern dryland farmers, southern irrigators and vegetable growers.
Major features of the SOILpak manuals are:
- Links to associated information in other chapters
- Effective use of diagrams, tables and decision flow charts
- Glossary of terms
- Soil description sheets (including "dummy" sheets)
- A small "Pocket Notes" booklet -summary for use in the field
Daniels et al. (1996) concluded that such problem-oriented, paper-based, loose-leaf manuals are an effective means of extending knowledge. A 20 minute video was also produced to show how to use the manual. The video includes testimonials from key landholders and consultants -a valuable way to earn credibility.
4.2 Healthy Soils for Sustainable Farms (HSSF) program
The Healthy Soils for Sustainable Farms (HSSF) Programme was a $5 million initiative of the Australian Government's Natural Heritage Trust managed by Land & Water Australia (LWA) and supported by the Grains Research and Development Corporation (GRDC). The Program concluded in June 2008 and outcomes included:
- More farmers building the health of their soils on their farms
- More farmers aware and knowledgeable about soil health issues
- Participation by farmers at field days, regional industry planning sessions and national symposiums about the role of soil health in supporting sustainable farm businesses and healthy catchments
- Use of tools and guidelines generated by the programme.
4.2.1 Vegetable Soil Health
 | The vegetable industry healthy soils project was one of ten major projects within the HSSF Programme. This project developed a soil interpretation and reference guide (‘Healthy Soils for sustainable Vegetable Farmers: Ute Guide’ (Anderson et al. 2007)) for vegetable production. The project also aimed to develop a soil interpretation and management course in line with the Australian National Testing Authority: Certificate of Amenity Horticulture RTF03 (Level IV or higher). The Soil Interpretation and Management Course was developed to assist vegetable growers in all states to learn about their soil profile, to identify and interpret soil structure and chemistry, to restore or improve the health of the soil and to select the appropriate crop types for the soil with the least impact on the broader environment. In conjunction with the Guide, growers also had access to an instructional CD/DVD – aimed at time-poor growers. |
4.2.2 Victorian Soil Health Training Modules
The HSSF Programme in Victoria involved collaboration between agencies, farmer groups and the private sector across south-eastern Australia, led by the former DPI Victoria. Project partners included Birchip Cropping Group (BCG), Southern Farming Systems (SFS), Mallee Sustainable Farming Inc. (MSF), and Rural Solutions SA. Nutrient Management Systems (NMS) were employed as consultants to the project in the field of training/accreditation to assist in developing and delivering soil training modules.
Soil Health Training modules were developed in the 2007 for delivery to farmer and adviser groups in 2008 (Table 3). This involved collation and synthesis of the best-available information and science elating to:
- Understanding Soil Structure,
- Understanding Soil Types,
- Understanding Soil Chemical Testing,
- Understanding Soil Biology,
- Understanding Soil Organic Matter, and
- Understanding Soil Erosion.
Additional modules for subsoil constraints and for soil water use efficiency are under development. Information packages included comprehensive PowerPoint presentations (up to 150 slides) and associated ‘Quick Reference Guides’, ‘Practical Notes’ and ‘Information Notes’. This information has been augmented with information on key regional soils and relevant land management practices. Information packages are stored in the DEPI ‘Project Forum’ intranetsite – enabling both project staff and non-project staff to access materials. From February to July 2008, these modules have been delivered at 14 workshops across northwest and southwest Victoria and attended by 240 participants (Figure 4 and Figure 5).
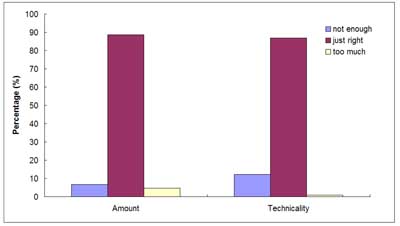 | Figure 4. Summary of responses to evaluation questionnaire by participants who attended ‘Healthy Soils’ project training sessions from February to May 2008. |
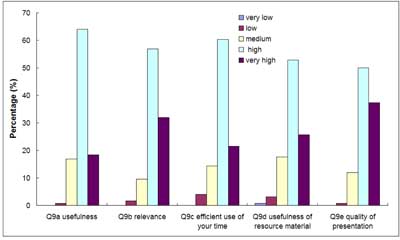 | Figure 5. Summary of responses to evaluation questionnaire by workshop participants who attended ‘Healthy Soils’ project training sessions from February to May 2008. |
Table 3. Healthy Soils Training Modules
Understanding Soil Types & Soil Structure Modules | |
 | Session 1: Describing Soil Profiles Session 2: Soil Structure Overview (understand soil structure, aggregation, aggregate stability and indicators of soil structural condition) Session 3: Soil Structure and Management Session 4: Understanding Soils of your Region (distribution of major soil types and management implications, soil variability) Session 5: Mapping Soil Differences at Paddock Scale Practical sessions: soil texturing, plant available water, characterisation of soil pit in field. |
Understanding Soil Tests – Chemical Module. | |
 | Session 1: Understanding issues and developing an investigation hypothesis Session 2: Developing a sampling strategy Session 3: Laboratory selection Session 4: Interpretation of soil test results Session 5: Communicating results with the farmer Practical Workbook sessions for each of the sessions. |
Understanding Soil Biology Module | |
 | Session 1: What is Soil Biology? Session 2: Why is Soil Biology Important? Session 3: Regulators of Soil Biology Session 4: Measuring and Monitoring Soil Biology Practical exercises: Labile Carbon test using potassium permanganate; microscopy. |
Managing Soil Organic Matter Module | |
 | Session 1: Carbon Cycle and Definitions of SOM and how it can be measured. Session 2: Functions of Organic Matter Session 3: Fixed and Manageable Controls of SOM Session 4: What happens to SOM on the Farm Session 5: Assessment and Investigating Practices that influence SOM. |
Understanding Soil Erosion Module | |
 | Session 1: Soil Erosion in Context Session 2: Assessing Erosion Risk Session 3: Water Erosion Session 4: Wind Erosion Session 5: Local Issues |
4.3 Soil Wise – Managing Soils and Fertilisers
This trainer pack is designed for trainers and farmers and was developed to assist farmers understand soil processes and to use fertilisers more effectively. The resource provides basic soil and fertiliser information, step-by-step soil testing procedures and a guide to using the correct quantity of fertilisers. It can be used in training sessions as well as a ‘take home’ resource. A ‘Trainer Pack’ includes a DVD and a Pocket Field Guide. The Soil Wise trainer pack provides information for achieving competency in the units ‘Determine basic properties of soil/growing media (RTE2504A) and ‘Establish horticultural crops (RTF2010A)’ in the Rural Production Training Package (RTE03) and the Amenity Horticulture Training Package (RTF03). The DVD provides information, activities and sets of procedures for testing soil and managing fertiliser use. It uses video rather than text to demonstrate basic soil principles and testing procedures and can be used in training sessions while the trainer discusses the relevant content and demonstrates the soil testing skills.
The pack covers a range of soil and fertiliser topics including:
- What is soil?
- Soil structure
- Soil pH
- Soil salinity
- Soil erosion
- When to use fertilisers
- How much fertiliser to use
- Organic fertilisers
- Testing for nitrogen in your soil
References
Abbott L (2004) The fungal-bacterial ratio: Tipping the balance for soil health. Soils are Alive Newsletter 3 (3).
Abbott L (2005a) Soil Health. Soil Biology Research Group, Faculty of Natural and Agricultural Sciences, School of Earth and Geographical Sciences, the University of Western Australia. <www.soilhealth.com (external link)>
Abbott L (2005b) Australian Soil Club. School of Earth and Geographical Sciences, the University of Western Australia. <www.soil.org.au (external link)>
Agricultural Bureau of South Australia (1997) Better Soils. Agricultural Bureau of South Australia.
Alberta Agriculture and Rural Development (2007) AESA Soil Quality Resource Monitoring Program. Government of Alberta. Last update March 2008. <www1.agric.gov.ab.ca/$department/deptdocs.nsf/all/aesa8402#Overview (external link)>
Amato M,Ladd J N (1988) Assay for microbial biomass based on ninhydrin-reactive nitrogen in extracts of fumigated soils. Soils and Biochemistry 20,107-114.
Anderson A, Kelly J, McKenzie D (2007) Healthy Soils for Sustainable Vegetable Farms: Ute Guide. Land and Water Australia (HSSF) & AUSVEG Environmental Programme.
Andrews SS, Flora CB, Mitchell JP, Karlen DL (2003) Growers’ perceptions and acceptance of soil quality indices. Geoderma 114, 187-213.
Back Paddock Company (2009) <www.backpaddock.com.au (external link) >
Bandaranayake W, Qian YL, Parton WJ, Ojima DS, Follett RF (2003) Estimation of soil organic carbon changes in Turfgrass systems using the CENTURY model. Agronomy Journal 95,558-563.
Birchip Cropping Group (2008) Yield Prophet. Information Technology Online (ITOL) Program of the Department of Communications, Information Technology and the Arts, Australian Government. <www.bcg.org.au/cb_pages/what_is_yield_prophet.php (external link)>
Bourne J (1998) Monitoring land condition: a field recording booklet (CRCSLM/CTT/2/98). Cooperative Research Centre for Soil and Land Management, Adelaide, South Australia.
Burk L, Dalgliesh N (2008) Estimating plant available water capacity – a methodology. CSIRO Sustainable Ecosystems, Canberra.
Campbell CD, Grayston SJ, Hirst DJ (1997) Use of rhizosphere carbon sources in sole carbon source tests to discriminate soil microbial communities. Journal of Microbiological Methods 30,33–41.
Charlesworth P (2005) Soil Water Monitoring – an information package (2nd Edn). In ‘Irrigation Insights No.1’. National Programme for Sustainable Irrigation, Land and Water Australia, Canberra. Retrieved 13 August 2009 from http://www.precirieg.net/documentacion/soilwater.pdf (external link)
Coleman K, Jenkinson DS (1999) The Rothamsted carbon model webpage. Retrieved 5 September 2013 from http://www.rothamsted.ac.uk/ssgs/RothC/RothC.html (external link)
Committee of Sustainable Farm Publishing (1997) Sustainable Farming Connection. Last update June 2008. <www.ibiblio.org/farming-connection/soilhlth/home (external link)>
Cornell University Soil Health Team (2005) Cornell Soil Health. Cornell University, USA. Last update April 2008. <www.hort.cornell.edu/soilhealth (external link)>
CSIRO Land and Water (2005) Yield and N estimation for dryland cropping. CSIRO Land and Water Adelaide, Grains Research Development Corporation, and Mallee Sustainable Farming Project. Last update August 2009. <www.clw.csiro.au/products/ncalc (external link)>
Daniells IG, Larsen D (Eds) (1991) `SOILpak, a Soil Management Package for Cotton Production on Cracking Clays (2nd Edn).' NSW Agriculture, Narrabri.
Daniells IG, Larsen D L, McKenzie DC, Anthony DTW (1996) SOILpak: A successful decision support system for managing the structure of Vertisols under irrigated cotton. Australian Journal of Soil Research 34, 879-889.
Department of Agriculture WA (2005) Diagnosing and Ameliorating Problem Soils (Decision Tree on How to Diagnose and Ameliorate Problem Soils) (2nd Edn). Miscellaneous Publication 25/2005. Government of Western Australia. Retrieved 13 August 2009 from http://www.agric.wa.gov.au/objtwr/imported_assets/content/lwe/land/compact/problemsoils.pdf (external link)
Department of the Environment and Heritage (2008) Soil Condition. Australian Government NRM Team. Last update May 2008. <www.nrm.gov.au/publications/factsheets/me-indicators/soil (external link)>
Department of Primary Industries and Water Tasmania (2009) Land Management and Soils. State Government of Tasmania. Last updated July 2009. <www.dpiw.tas.gov.au/inter.nsf/ThemeNodes/TPRY-5YG384?open (external link)>
Department of Primary Industries Victoria (2009a) Sampling Soils used for Growing Pasture, Field and Fodder Crops. Agriculture Note AG0375. State Government of Victoria. Retrieved 5 September 2013 from http://www.dpi.vic.gov.au/agriculture/farming-management/soil-water/soil/growing-pastures-fodder-crops
Department of Primary Industries Victoria (2009b) Cereal Root Diseases. Agriculture Note AG0562. State Government of Victoria. Retrieved 5 September 2013 from http://www.dpi.vic.gov.au/agriculture/pests-diseases-and-weeds/plant-diseases/grains-pulses-cereals/cereal-root-diseases
Department of Primary Industries Victoria (2008a) Using fertiliser test strips on pasture. Agriculture Note AG0204. State Government of Victoria. Retrieved 5 September 2013 from http://www.dpi.vic.gov.au/agriculture/dairy/pastures-management/fertilising-dairy-pastures/chapter-7
Department of Primary Industries Victoria (2008b) Carbon Calculator. State Government of Victoria. Unpublished [contact: peter.fisher@depi.vic.gov.au]
Department of Primary Industries Victoria (2008d) Victorian Resources Online – Soil. State Government of Victoria. <www.depi.vic.gov.au/vro/soil>
Department of Primary Industries Victoria (2004) ‘Subsoil constraints to crop production in north-eastern Australia: A reference manual’. Northern Australia GRDC Subsoils Project SPI08. Contributing organisations Department of Primary Industries Victoria, University of Adelaide, South Australian Research and Development Institute, Birchip Cropping Group and Wimmera Farming Systems.
Doran JW, Parkin TB (1996) Quantitative indicators of soil quality: a minimum dataset. In ‘Methods for Assessing Soil Quality’ (Eds JW Doran and AJ Jones). pp. 25-37. Soil Science Society of America Special Publication No. 49, ASA and SSSA, Madison, WI.
Field DJ, McKenzie DC and Koppi AJ (1997) Development of an improved Vertisol stability test for SOILpak. Australian Journal of Soil Research 35,843-852.
Grace PR, Jeffrey N, Ladd JF, Robertson GP, Gage SH (2006a) SOCRATES—A simple model for predicting long-term changes in soil organic carbon in terrestrial ecosystems. Soil Biology and Biochemistry 38,1172– 1176.
Grace PR, Post WM, Hennessy K (2006b) The potential impact of climate change on Australia's soil organic carbon resources. Carbon Balance and Management 1:14 (doi: 10.1186/1750-0680-1-14).Retrieved 13 August 2009 from http://www.cbmjournal.com/content/1/1/14 (external link)
Grace PR, Weier KL (2007) Soil Health Assessment Users Guide 2007 Version 1, Queensland University of Technology, Brisbane, Australia. 47pp.
Greacen EL, Correll RL, Cunningham RB, Johns GG, Nicholls KD (1981) Calibration. In ‘Soil Water Assessment by the Neutron Method’ (Ed. EL Greacen). pp. 50-72. CSIRO, Melbourne.
Greenwood K, Rees D, Davey M, Brown A (2007) ‘Progress Report HDLN Soil and Water Dairy Action Program – Soil Assessment component’. Progress Report to Dairy Australia on DAV 12222. Department of Primary Industries, Kyabram and Werribee, Victoria.
Greenwood K, Rees D, Davey M, Brown A (2008) ‘Final Report HDLN Soil and Water Dairy Action Program— Soil Assessment Component’. Final Report to Dairy Australia on DAV 12222. Department of Primary Industries, Kyabram and Werribee, Victoria.
Gugino BK, Idowu OJ, Schindelbeck RR, van Es HM, Wolfe DW, Moebius BN, Thies JE, Abawi GS (2007) Cornell Soil Health Assessment Training Manual, 1st ed. Cornell University, Geneva, New York. Retrieved 13 August 2009 from http://soilhealth.cals.cornell.edu/extension/manual/manual.pdf (external link)
Henry K, Bellati J (2008) Crop Insects the Ute Guide: Southern Grain Belt Edition. Primary Industries Research South Australia, Adelaide.
Herrick JE, Whitford WG, de Soyza AG, Van Zee JW, Havstad KM, Seybold CA, Walton M (2001) Field soil aggregate stability kit for soil quality and rangeland health evaluations. Catena 44,27-35.
Janssen PH, Yates PS, Grinton BE, Taylor PM, Sait M (2002) Improved Cultivability of Soil Bacteria and Isolation in Pure Culture of Novel Members of the Divisions Acidobacteria, Actinobacteria, Proteobacteria, and Verrucomicrobia. Applied Environmental Microbiology 68(5), 2391–2396.
Jenkins A (2006) ‘Northern Rivers Soil Health Card: A monitoring tool for farmers developed by farmers’. Proceedings of the APEN International Conference, Practice change for sustainable communities: Exploring footprints, pathways and possibilities. 6-8 March 2006. Beechworth, Australia. Retrieved 13 August 2009 from http://www.regional.org.au/au/apen/2006/refereed/1/3157_jenkinsa.htm (external link)
Kennedy N, Brodie E, Connolly J, Clipson N (2004) Impact of lime, nitrogen and plant species on bacterial community structure in grassland microcosms. Environmental Microbiology 6 (10),1070–1080.
King PM (1981) Comparison of methods for measuring severity of water repellency of sandy soils and assessment of some factors that affect its measurement. Australian Journal of Soil Research 19,275-85.
Landcare Research New Zealand (2009) SINDI. <http://sindi.landcareresearch.co.nz/ (external link)>
Larsen DL (1994) Soil Management Training. Final Report to Cotton Research and Development Corporation’. NSW Agriculture, Narrabri, NSW.
Latter PM, Walton DWH (1988) The cotton strip assay for cellulose decomposition studies in soil history of the assay and development. In ‘Cotton Strip Assay: an Index of Decomposition in Soils’. (Eds AF Harrison, PM Latter, DWH Walton). pp. 7-10. Retrieved 13 August 2009 from http://nora.nerc.ac.uk/4961/1/N004961CP.pdf (external link)
Liebig MA, Doran JW, Gardner JC (1996) Evaluation of a Field Test Kit for Measuring Selected Soil Quality Indicators. Agronomy Journal 88, 683-686.
Lobry de Bruyn LA, Abbey JA (2003) Characterisation of farmers' soil sense and the implications for on-farm monitoring of soil health. Australian Journal of Experimental Agriculture 43, 285 – 305.
McDonald R C, Isbell R F, Speight J G,Walker J and Hopkins MS( 1990) ‘Australian Soil and Land Survey, Field Handbook (2nd Edn)’. Inkata Press, Melbourne, Australia.
McKenzie DC (Ed) (1998) ‘SOILPak for Cotton Growers (3rd Edn)’. NSW Agriculture, Orange.
McKenzie N, Coughlan K, Cresswell H (Eds) (2002) 'Soil Physical Measurement and Determination for Land Evaluation’. CSIRO Publishing, Collingwood, Australia.
Mele P, Hollier T (1995) Worm Wise II. Agriculture Victoria, Grains Research and Development Corporation and the Rural Industries Research and Development Corporation. Rutherglen Research Institute, Rutherglen, Victoria. Retrieved 13 August 2009 from http://www.dpi.vic.gov.au/dpi/vro/vrosite.nsf/pages/soilhealth_reports_docs#biology
Micic S, Henry K (2007) Identification and control of pest slugs and snails for broadacre crops in Western Australia. Bulletin 4713. Department of Agriculture and Food WA, Perth. Retrieved 13 August 2009 from http://www.agric.wa.gov.au/objtwr/imported_assets/content/pw/ins/pp/gc/slugsnailbulletin.pdf (external link)
New South Wales Department of Primary Industries (2005a) Soil health and fertility. State of New South Wales. <www.dpi.nsw.gov.au/agriculture/resources/soils (external link)>
New South Wales Department of Primary Industries (2005b) SOILpak. Government of New South Wales. <www.dpi.nsw.gov.au/agriculture/resources/soils (external link)>
New South Wales Department of Primary Industries (1998) Part C –Diagnosing Soil condition. In ‘SOILpak for Cotton growers (3rd Edn)’. Government of New South Wales. Retrieved 13 August 2009 from www.dpi.nsw.gov.au/agriculture/resources/soils/guides/soilpak/cotton (external link)
Parton WJ, Stewart JWB, Cole CV (1987) Dynamics of C, N, S, and P in grassland soils: A model, Biogeochemistry 5, 109-131.
Peverill KI, Sparrow LA, Reuter DJ (Eds) (1999) ‘Soil Analysis –an Interpretation Manual’.CSIRO Publishing, Collingwood.
Queensland Department of Natural Resources and Water (2009) Fact and Information Sheets: Land Management. Last updated April 2009. <http://www.nrw.qld.gov.au/services_resources/item_list.php?category_id=123&topic_id=11 (external link)>
Rayment GE, Higginson FR (1992) ‘Australian Laboratory Handbook of Soil and Water Chemical Methods’. Inkata Press, Australia.
Robertson FA, Myers RJK, Saffigna PG (1995) Respiration from Soil and Litter in a Sown Perennial Grass Pasture. Australian Journal of Soil Research 33, 167-178.
Ross DJ, Speir TW Cowling JC, Whale KN(1984) Temporal fluctuations in biochemical properties of soil under pasture. II. Nitrogen mineralization and enzyme activities. Australian Journal of Soil Research 22 (3), 319 –
330. Rowell DL (1994) ‘Soil Science. Methods and Applications’. Longman, UK. Sessitsch A, Hackl E, Wenzl P, Kilian A, Kostic T, Stralis-Pavese N, Tankouo Sandjong B, Bodrossy L (2006)
Diagnostic microbial microarrays in soil ecology. New Phytologist 171 ,719-736. Seybold CA, Dick RP, Pierce FJ (2001) USDA Soil Quality Test Kit: Approaches for Comparative Assessments. Soil Survey Horizons 42, 43-52. Sharma S, Radla V, Haia B, Kloosa K, Fukaa MM, Engela M, Schaussa K, Schloter M (2007) Quantification of functional genes from prokaryotes in soil by PCR. Journal of Microbiological Methods 68, 445-452. Shepherd G (2000) ‘Visual Soil Assessment Vol. 1 Field guide for cropping and pastoral grazing on flat to rolling country’. Horizons. /Landcare Research, Palmerston North, New Zealand. Shepherd G, Ross C, Basher L, Saggar S (2000) ‘Visual Soil Assessment Vol. 2 Soil management guidelines for cropping and pastoral grazing on flat to rolling country’. Horizons. mw/Landcare Research, Palmerston North, New Zealand. Retrieved 13 August 2009 from www.landcareresearch.co.nz/research/soil/vsa/documents/VSA_Vol2_smaller.pdf (external link)
Soil Foodweb Inc.(2005) Soil Foodweb Inc.<www.soilfoodweb.com (external link)>
Soil Foodweb Institute Australia (2009) Soil Foodweb Australia. Last update May 2009. <www.soilfoodweb.com (external link)>
Soil Quality Pty Ltd (2007) Soil Quality. <www.soilquality.org.au (external link)>
South Australian Research and Development Institute (2009) Predicta-B Diagnostic Service. <www.sardi.sa.gov.au/pestsdiseases/diagnostic_service/predicta_b (external link)>
Stanley M, Marcroft S (1999) Canola: The Ute Guide. TOPCROP Australia, Primary Industry and Resources South Australia, Adelaide.
Tasmanian Department of Primary Industries and Water (2008) ‘Land management and soils’. <www.dpiw.tas.gov.au (external link)>
Tuckombil Landcare Inc. (2002) Northern Rivers Soil Health Card -A soil management tool developed by farmers for farmers. Good Soil Project and Good Worm Project. Tuckombil Landcare Inc. in partnership with NSW Agriculture and the Natural Heritage Trust. Retrieved 13 August 2009 from www.dpi.nsw.gov.au/__data/assets/pdf_file/0007/168703/northern-rivers-soil-health-card.pdf (external link)
University of New England (2007) Oz Soils v3.0. Discipline of Agronomy and Soil Science, University of New England. Last update February 2007. <www.une.edu.au/agss/ozsoils (external link)>
United States Department of Agriculture (2009) Soil Quality – Improving how your soil works. National Resources and Conservation Service, United States Department of Agriculture. Last update May 2008. <www.soils.usda.gov/sqi (external link)>
USDA (2003a) Interpreting the Soil Conditioning Index: A Tool for Measuring Soil Organic Matter Trends. Soil Quality – Agronomy Technical Note No. 16. Soil Quality Institute, National Soil Conservation Service, United States Department of Agriculture.
USDA (2003b) Soil Conditioning Index Worksheet. Version 25. Soil Quality Institute, National Soil Conservation Service, United States Department of Agriculture. Retrieved 13 August 2009 from http://soils.usda.gov/sqi/publications/publications.html#sci (external link)
USDA (2002) Guide to Using the Soil Conditioning Index. Soil Quality Institute, National Soil Conservation Service, United States Department of Agriculture. Retrieved 13 August 2009 from hftp://ftpfc.sc.egov.usda.gov/SQI/web/SCIguide.pdf (external link)
USDA (1999a) Soil quality test kit guide. Soil Quality Institute, National Soil Conservation Service, United States Department of Agriculture. Retrieved 13 August 2009 from http://soils.usda.gov/sqi/assessment/files/test_kit_complete.pdf (external link)
USDA (1999b) Soil quality card design manual: A guide to develop locally adapted conservation tools.Soil Quality Institute, National Soil Conservation Service, United States Department of Agriculture. Retrieved 13 August 2009 from http://soils.usda.gov/sqi/assessment/sq_card.html (external link)
Wallwork H (2000) ‘Cereal Root and Crown Diseases’. SARDI, Adelaide, SA; GRDC, Canberra.
Winder JL, Cannon KR, Goddard TW (2003) ‘Evaluation of the Soil Quality Test Kit for Alberta’. Alberta Agriculture, Food and Rural Development Conservation and Development Branch, Alberta, Canada.
Wokner G, Dalgleish NP, Dang Y, Price L, Voller J (2004) ‘Measuring and managing soil water – training manual’. Queensland Department of Natural Resources and Mining, and the Queensland Department of Primary Industries and Fisheries, Toowoomba.
Appendix 1. Soil physical tests
General method 4. Soil Profile Description
| Name of test | Soil profile description. |
| Description | Examination and description of soil from the surface to depth (>1.0 m) using excavator, pick and shovel or soil auger. Soil horizons are described in terms of their colour, texture, structure and depth. |
| Method reference | McDonald et al. (1990), and various other soil text books. |
| Complexity | Most of the descriptors are fairly simple but training and experience are needed for proficiency. |
| Technology | Requires no specialist tools. |
| Cost and time | Full description and sampling of a soil pit (30 minutes to an hour). Additional preparation time may be needed. |
| Interpretation | Interpretation is an expert role though there are many indicators that can be readily used by someone with minimal training. |
| Decision | Essential for soil mapping, paddock zoning and many management decisions. |
| Value | High value both for land management and providing insight or data for modelling hydrology. |
General method 5. HSSF Soil Health Test Kit -site description and management history
| Name of test | Site description and management history |
| Description | Previous history of the crop or pasture production to monitor impact of management practices on yield. Includes growing season rainfall, chemical and fertilizer usage, tillage, amount of residue cover and soil texture by feel. |
| Method reference | Grace and Weier (2007) |
| Complexity | A very simple record keeping method. Soil texturing by feel requires some practice. |
| Technology | Requires no specialist skills. |
| Cost and time | Only time to make records. |
| Interpretation | No interpretations provided. |
| Decision | Would be of use for in-paddock decisions. |
| Value | A valuable method of monitoring land management practices. |
General method 6. HSSF Healthy Soils Test Kit -physical observations
| Name of test | Soil physical observations |
| Description | General soil physical observations of a hole can be made with a spade. Concerned with topsoil depth, root growth, penetration resistance and soil structure. Soil texture by feel (raw indicator of soil water holding capacity). |
| Method reference | Grace and Weier (2007) |
| Complexity | A combination of simple observational tests, but some experience required when describing type of soil structure, soil texture and grade of aggregates. |
| Technology | No specialist equipment required. |
| Cost and time | Inexpensive. Inexperienced users may require some time (1-2 hours) to undertake all observations. |
| Interpretation | No interpretations provided in manual. |
| Decision | If users are experienced, can be used to help make in-paddock decisions regarding management practices. |
| Value | A useful set of visual observations to educate growers on the importance of soil structure on root growth. |
General method 7. New Zealand Visual Soil Assessment
| Name of test | New Zealand Visual Soil Assessment |
| Description | The guide provides an assessment of visual soil properties, mainly physical and biological, based on 3 pictures – good, moderate and poor condition. Properties include soil porosity, soil colour, soil mottles, tillage pan presence, root development, clod development, soil erosion, and waterlogging. The guide is aimed at cropping and grazing practices. |
| Method reference | Shepherd (2000) and Shepherd et al. (2000) |
| Complexity | Little or no training would be required to undertake the visual assessment described in the field guide as the pictures are self-explanatory. |
| Technology | No specialist equipment required. |
| Cost and time | Inexpensive and rapid. |
| Interpretation | The pictures in the booklets are good quality but limited to only three condition scores. |
| Decision | Would not use for in paddock decisions, but a useful educational tool. Some benchmarks available. |
| Value | A useful educational and practical tool that landholders can use to monitor the health of the soil. |
| General comments | The tool was trailed in pasture paddocks by the Heytesbury Soil Health project in south west Victoria in 2006-07 (Greenwood et al. 2007). The card was well received by landholders as they were easily able to compare in-field conditions with the pictures in the guide. However, it was suggested that scoring of soil health has the potential to be controversial and contentious for individual farmers and the industry when scores are low (or poor) compared with benchmarks. |
Test 1. Soil colour
| Name of test | Soil Colour |
| Description | Colour of soil is recorded in moist and dry state. Mottles (contrasting colours within a horizon) are also recorded for size and contrast. A standard soil colour chart should be used. |
| Method reference | Munsell Soil Colour Charts |
| Complexity | A simple field observation test, with little training required. Results are reasonably repetitive between operators. |
| Technology | Requires a soil colour chart (Munsell or equivalent). |
| Cost and time | No cost. It may be necessary to take moist samples and allow them to dry. |
| Interpretation | Soil colour indicates degree of leaching, organic matter accumulation and the hydrology of a soil. |
| Decision | Used to assist in soil mapping. |
| Value | Good for assessing soil differences across a farm or through a profile. A useful indicator of the drainage status of a soil profile. |
Test 2. Soil texture
| Name of test | Soil Texture |
Description | The proportions of sand, silt and clay particles determine soil texture. Texture affects all physical properties of soil, particularly storage of air and water, the organic matter level, the movement of and availability of water and nutrients, ease of root growth and its workability and resistance to erosion. Soil texturing the field can be undertaken using the ribboning technique. Soil samples down a soil profile can be collected whilst digging a hole with a spade, augering a hole to depth or by excavating a soil pit. |
| Method reference | McDonald et al. (1990), and various other soil text books. |
| Complexity | A simple field observation test, with little training required. |
| Technology | No specialised equipment required. |
| Cost and time | No cost. It takes a little bit of time to determine a soil profiles texture. |
| Interpretation | There are six texture groups and nineteen grades of texture. This is also a subjective test but with practice growers will pick up the subtle differences in texture grades. |
| Decision | Very useful tool for understanding your soil above and below the surface. May assist in determining crop type and variety, along with farming system management (along with other tests). |
| Value | Will highlight soil issues and trigger discussion amongst growers, as part of a soil pit day or any soil activity. |
Test 4. Soil consistency
| Name of test | Soil Consistency |
| Description | The strength of soil aggregate of soil is subjectively evaluated on an 8-point scale. Reporting of consistency may be standardised against air-dry aggregates. Moisture status should be recorded. Related to soil texture. |
| Method reference | McDonald et al. (1990), and various other soil text books. |
| Complexity | A simple field observation test, with little training required. Results are reasonably repetitive between operators. |
| Technology | No specialised equipment required. |
| Cost and time | No cost. It may be necessary to take moist samples and allow them to dry. |
| Interpretation | Consistency is dependent upon soil texture, organic matter content and chemical properties of clay. It is a good integrator of a number of soil properties into a single structural indicator. |
| Decision | May be used to determine timing of tillage |
| Value | Good for assessing soil differences across a farm or through a profile. May have some value as a monitoring tool where soil structure is likely to be affected by a change in management. |
Test 5. Excavation to visually assess soil at depth
| Name of test | Shovel/auger/soil pit |
| Description | A visual assessment of a soil profile can be undertaken by digging a shallow hole with a spade, augering a hole to depth or by excavating a soil pit. All of these methods can be used to demonstrate to growers the importance of the soil below the ground and how it impacts on production above the ground. Shovel or auger holes can also be replicated several times across a paddock to assist in identifying in-paddock soil variability. |
| Method reference | The SOILpak documents from New South Wales Department of Primary Industries (2005b) have a good process for each of these activities and the reasoning for using each. |
| Complexity | The shovel is a very simple method relying on the person’s physical strength to dig into the soil. The hand auger again relies on physical strength but can go deeper than a shovel. The soil pit is generally dug with an excavator, but there are issues associated with accessibility and safety. |
| Technology | All three methods require no specialist equipment. |
| Cost and time | From a few dollars for a shovel, a couple of hundred dollars for an auger to $300-500 for an excavated soil pit. |
| Interpretation | Interpretation with the shovel is a basic visual observation of plant roots, soil type and colour. The auger method is useful to assist in identifying soil changes deeper in the soil profile, bit it is difficult to observe soil structure. The soil pit is the preferred method as changes in soil texture, colour and structure can be observed. A pit also allows for more complex classification and description of soil type to occur. |
| Decision | The shovel method only provides a basic overview of soil activity in the topsoil, but may highlight issues of hard pan layers that could assist in management decisions. Soil samples from the auger method could be used for chemical analyses and assist in management decisions. The pit allows for good decision making as it gives good access to the soil profile, but it is only a snap shot of the direct area. |
| Value | All three methods have value as they can highlight soil issues and trigger discussion amongst growers. |
Test 3. Soil structure
| Name of test | Soil Structure |
| Description | The size, shape and strength of soil aggregates, if any, are recorded as well as the size and number of visible pores and cracks. Related to: soil consistency, soil texture |
| Method reference | McDonald et al. (1990), and various other soil text books. |
| Complexity | An apparently simple field observation test, but requires training. Results are often inconsistent between operators unless experienced. |
| Technology | No specialised equipment required. Size and shape charts provide better consistency for records. Photography is extremely valuable for this aspect of soil description. |
| Cost and time | No cost. |
| Interpretation | Soil structure is dependent upon soil texture, organic matter content and chemical properties of soil. |
| Decision | May be used to determine measures to improve or protect soil structure. |
| Value | Good for assessing soil differences across a farm or through a profile. May have some value as a monitoring tool where soil structure is likely to be affected by a change in management. |
Test 6. Determination of gravimetric soil water content
| Name of test | Determination of gravimetric soil water content |
| Description | Gravimetric soil water content refers to how much water is in the soil on a weight for weight basis (g water per g of soil). It is determined by weighing a field moist sample of soil (10 -100 g), drying it in an oven at 105oC for 24 hours, and re-weighing. The weight difference is the water extracted from the soil. It is reported as a fraction (g water /g oven dry soil) or a percent (g water /100 g oven dry soil). |
| Method reference | Standard soil texts dealing with physical methods. For example: McKenzie et al. 2002. |
| Complexity | A fairly straightforward process. |
| Technology | Some specialist equipment required. Balance accurate to +/- 0.1 g, oven capable of 105oC +/- 5oC. |
| Cost and time | Low cost, little time involved. |
| Interpretation | Essential soil water parameter that is related to soil strength and soil water availability. |
| Decision | Can be used to determine irrigation scheduling, water availability. |
| Value | High value measurement when related to soil water holding properties. |
Test 7. Determination of soil bulk density
| Name of test | Determination of soil bulk density |
| Description | A known volume of soil is sampled and it, or a sub-sample, is dried at 105oC, and then weighed. The soil bulk density = (oven dry weight of the soil) / (undisturbed soil volume). Usually reported as t/m or g/cc. Purpose is to determine the degree of packing of the soil solid material – it is the inverse of soil porosity. Used in calculations of available water and to assess soil compaction. |
| Method reference | Standard soil texts dealing with physical methods. For example: McKenzie et al. 2002. |
| Complexity | A fairly straightforward process. |
| Technology | Some specialist equipment required. Soil sampling ring or core, or other way of determining extracted soil volume. Balance accurate to +/- 0.1 g, oven capable of 105oC +/- 5oC. |
| Cost and time | Low cost, little time involved. |
| Interpretation | Essential soil physical parameter that is related to soil water availability, soil strength and soil compaction. Can be used to diagnose compaction problems and soil water availability. Growth Limiting Bulk Density (GLBD) varies according to soil texture, with lower GLBDs in clays (1.5) than in loams (1.65) or sands (1.8). |
| Decision | Essential parameter for gross nutrient calculations (e.g. Carbon in surface soil, total N in soil horizons, etc.) and therefore nutrient budgeting. Factor involved in calculations concerning irrigation scheduling. Essential component of planning for remediation of compaction (soil loosening requirements). |
| Value | High value measurement when related to soil chemical fertility, water holding properties and soil structure. |
Test 8. Determination of volumetric soil water content
| Name of test | Determination of volumetric soil water content |
Description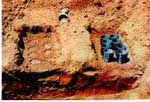 | Direct measurement involves a combination of two tests: determination of soil bulk density and determination of gravimetric soil water content. Volumetric moisture content is the product of these two determinations. Water Content (gravimetric) × Bulk Density = Water Content (volumetric). Bulk density needs to be determined for a horizon / site only once, and then subsequent gravimetric water content values can be converted to volumetric values simply by multiplying by bulk density. |
| Method reference | Standard soil texts dealing with physical methods. For example: McKenzie et al. 2002. |
| Complexity | A fairly straightforward process. |
| Technology | Some specialist equipment required. Soil sampling ring or core, or other way of determining extracted soil volume. Balance accurate to +/- 0.1 g, oven capable of 105oC +/- 5oC. |
| Cost and time | Low cost, little time involved. |
| Interpretation | Essential soil water parameter that is used to calculate soil water availability. |
| Decision | Can be used to determine irrigation scheduling, water availability. |
| Value | High value measurement when related to soil water holding properties. |
Test 9. Measurement of plant available water capacity
| Name of test | Estimation of Plant Available Water Capacity |
| Description | The reference provides practical skills in soil water measurement in field monitoring. Plant available water capacity (PAWC) is an indicator of the storage capacity of individual soils. PAWC allows comparison between soils of potential productivity and helps to explain variations in yield between soils. Methods are provided to estimate Drained Upper Limit (DUL) and Crop Lower Limit (CLL) of soils. Technique is used in Yield Prophet. |
| Method reference | Wokner et al. (2004) |
| Complexity | A fairly complex process. Users require training prior to attempting the methods. Considerable volumes of water required for estimation of DUL. Knowledge of in-paddock soil variability required. |
| Technology | Some specialist equipment required. |
| Cost and time | It is time consuming to setup in-situ equipment for DUL and CLL. Most cost is for labour input. |
| Interpretation | PAWC benchmarks are available. |
| Decision | Can be used to help make in-paddock decisions regarding management practices. |
| Value | A useful method to allow comparison between soils of potential productivity and helps to explain variations in yield between soils. Essential for modelling plant growth. |
Test 10. Estimation of soil water holding capacity from texture and rooting depth
| Name of test | Estimation of Soil Water Holding Capacity using soil texture |
| Description | Knowledge of the soil water holding capacity (SWHC) of soils to the rooting depth of the plants allows comparison between soils of potential productivity and helps to explain variations in yield between soils. A soil pit or augered hole method is used to establish the root zone depth and the depths and textures of individual soil horizons. The depth of the soil horizons are multiplied by a texture factor to determine the water holding capacity (WHC) for each horizon. The WHC for each horizon are added together to determine the water holding capacity of the soil within the root zone. |
| Method reference | Burk and Dalgliesh (2008) |
| Complexity | A fairly easy process once the soil depth and texture horizons are known to the root zone depth. Knowledge of in-paddock soil variability required. |
| Technology | No specialist equipment required. |
| Cost and time | No cost. Time it takes to dig holes and describe the soil profile. |
| Interpretation | To be used as a field guide to plant available water. |
| Decision | Can be used to help make in-paddock decisions regarding management practices. |
| Value | A useful method to allow comparison between soils of potential productivity and helps to explain variations in yield between soils. |
Soil Moisture Tool 1. Capacitance Probe
| Name of test | Frequency Domain Reflectometry (FDR) or Capacitance Probe |
Description | Capacitance probes come in a variety of forms from different manufacturers. They are all electronic devices that measure the dielectric constant of the surrounding soil. The dielectric constant varies with soil moisture so the probes provide an indirect measure of how much water (volume fraction) is in the soil. The sphere of influence of soil on the probe sensor is 5-10 cm radius, depending on instrument and moisture content. Options are for permanent installation of probes in access tubes in the soil, or use of a portable probe to record data from several access tubes. Electronic dataloggers and remote telemetry are standard options with capacitance probes. Permanently installed probes with loggers provide continuous data on soil moisture, the portable probe only provides data when the site is visited and data collected. Soil moisture can be monitored for different depth intervals in the soil, depending on the depth of installation (usually 1.0 m) of the access tube. |
| Method reference | Charlesworth (2005) |
| Complexity | Moderately complex – familiarity with data collection system and interpretation is necessary, but only a little training is needed to use this equipment. |
| Technology | Technology is very user friendly. |
| Cost and time | Access tubes are low cost (PVC pipe); probes vary from several hundred dollars to 1-3 thousand depending on configuration. Cheapest option is for one portable probe and logger to serve several sites, but this is more time consuming and provides data only as often as sites can be visited. In situ probes with loggers and remote telemetry are the most time efficient but also the most costly. |
| Interpretation | Probe should be calibrated for a site. Data collected by the probe is usually ‘translated’ by proprietary software into volumetric moisture content. Knowledge of soil water relations for the rooting depth of the soil profile, in particular Crop Lower Limit (CLL) or Permanent Wilting Point (PWP) and bulk density of soil, is needed to interpret available water from the probe readings. |
| Decision | Can be used to determine irrigation scheduling, water availability. |
| Value | High value measurement when related to soil water holding properties. |
Soil Moisture Tool 2. Tensiometer
| Name of test | Tensiometer |
Description | Tensiometers measure the soil water potential or the pressure or suction required to remove water from the soil. A porous cup tensiometer consists of a ceramic cup attached to the bottom of a sealed tube partially filled with water. It is installed so that the cup is in close contact with soil at the depth of interest. The partial vacuum of the air space at the top of the tube is equivalent to the pressure or suction that the soil is exerting through the ceramic cup. This pressure is either recorded from a pressure gauge attached to the top of the tube or via a portable pressure sensor inserted into a rubber septum at the top of the tensiometer. The tensiometer only provides data when the site is visited and data collected. The tensiometer functions only over the wetter range of soil potential from 0 to -100 kPa. Tensiometers are usually installed at different depths at monitoring locations but a portable version of the tool is also available. |
| Method reference | Charlesworth (2005) |
| Complexity | Not complex. Installation and use is simple but checking for functional integrity is important as the tensiometers cease to function in dry soil and may need to be re-installed once the soil is wetter. |
| Technology | Technology is simple and can be reproduced in a workshop. Porous ceramic cups can be purchased separately and tensiometers can be customised to provide different depths. |
| Cost and time | Low cost. |
| Interpretation | Direct reading of the pressure gauge provides an immediate indication of how much work plants have to do to obtain water at the measured depth. |
| Decision | Can be used to determine irrigation scheduling, water availability. |
| Value | High value measurement that enables optimum irrigation of crops. |
Soil Moisture Tool 3. Resistance Blocks (Gypsum Blocks)
| Name of test | Gypsum Blocks |
Description | Resistance blocks (usually gypsum) consist of two electrodes embedded in a block of porous material (usually gypsum) that is buried in the soil. Gypsum blocks are used to measure the soil water potential or the pressure or suction required to remove water from the soil. Gypsum blocks function only over the drier range of soil potential from -100 to -1500 kPa and therefore are a useful addition to tensiometers. Blocks are usually installed as an array at different depths. The blocks absorb moisture from the soil until the block and soil moisture contents are at equal suction. The electrical resistance of the block is inversely proportional to water content and this can be converted to soil water potential if the electrical and moisture characteristic of the block material is known. Additionally if the soil moisture characteristic and bulk density of the soil are known then this can be converted to volumetric soil water content. |
| Method reference | Charlesworth (2005) |
| Complexity | Achieving good contact with the soil is important and calibration is crucial. |
| Technology | Technology is simple and can be reproduced in a workshop by someone competent with electronics. However, there are commercial suppliers and, for consistency of instrumentation, these are preferred. |
| Cost and time | Moderately low cost. |
| Interpretation | The electrical resistance of the blocks is an indirect measure of the amount of water in them. This needs to be correlated with soil water potential and with volumetric water content. |
| Decision | Can be used to determine irrigation scheduling, water availability. |
| Value | High value measurement that enables optimum irrigation of crops. |
Soil Moisture Tool 4. Neutron Moisture Meter
| Name of test | Neutron Moisture Meter / Neutron Probe / NMM |
Description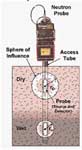 | The neutron moderation technique counts the number of neutrons that collide with the hydrogen in water. Water is the only form of hydrogen that will change in soil from measurement to measurement, so any change in the counts is due to a change in water content. Measurements are taken by lowering the neutron moisture meter (NMM) probe into aluminium access tubes inserted into the soil to the required depth. The count of slow neutrons for a 16 or 32 second period is recorded by hand and logged. The measurement sphere is 10 to 15 cm radius around the sensor. The NMM only provides data when the site is visited and data collected. |
| Method reference | Greacen et al. (1981) |
| Complexity | Moderately complex – familiarity with data collection system and interpretation is necessary, but only a little training is needed to use this equipment. Strict protocols for radiation training and safety are mandatory. |
| Technology | High technology that uses a radioactive source and is subject to registration for equipment, users, and use. |
| Cost and time | Access tubes are low cost (Aluminium tubing); probes vary from ten to twenty thousand dollars. |
| Interpretation | Probe should be calibrated for a site. Data collected by the probe is usually ‘translated’ by proprietary software into volumetric moisture content. Knowledge of soil water relations, in particular Crop Lower Limit (CLL) or Permanent Wilting Point (PWP) and bulk density of soil, is needed to interpret available water from the probe readings. |
| Decision | Can be used to determine irrigation scheduling, water availability. |
| Value | High value measurement when related to soil water holding properties. |
Test kit 3. Aggregate stability in water -field kit (USDA, SQI)
| Name of test | Field office or simple laboratory-based wet-sieving |
Description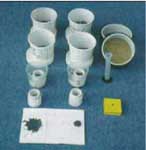 | A simple wet-sieving test that can be performed in a field office or in a simple laboratory. Measurements are made on air-dry aggregates (1-2 mm size range) that are placed in a small PVC container with a fine screen at its base. The container is placed in distilled water and after a period of time is removed from the water and contents allowed to dry. Contents are then removed and visually examined for breakdown from original aggregate size. |
| Method reference | USDA (1999a) |
| Complexity | A simple on-site test that can be carried out by anyone. |
| Technology | Does require specific items of equipment to be made. Basic materials (PVC pipe and mesh). |
| Cost and time | Relatively time consuming compared to other related methods. |
| Interpretation | Materials with the least change have greatest aggregate stability. |
| Decision | Comparison of impacts of treatments may reinforce a particular choice for soil management. |
| Value | Questionable value considering the extra effort – does it give repeatable quantifiable results? If not then a simpler method may be better and standard quantitative methods conducted in the laboratory if needed. |
Test kit 4. Aggregate stability kit
| Name of test | Field office or simple laboratory-based wet-sieving |
Description | A stability kit that can be inexpensively and easily assembled with minimal tools. It permits up to 18 samples to be evaluated in less than 10 minutes. The kit contains 21 x 10.5 x 3.5 cm plastic boxes divided into eighteen 3.5 x 3.5 cm sections, eighteen 2.5 cm diameter sieves with 1.5 mm aperture. Soil samples are rated on a scale from 1-6 based on a combination of observations of slaking during the first 5 minutes following immersion in distilled water, and the % remaining on a 1.5 mm sieve after 5 dipping cycles at the end of the 5 minute period. |
| Method reference | Herrick et al. (2001) |
| Complexity | A simple on-site test that can be carried out by anyone. |
| Technology | Does require specific items of equipment to be made. Basic materials (PVC pipe and mesh). |
| Cost and time | Relatively time consuming compared to other related methods and has a laboratory component. |
| Interpretation | A laboratory comparison by Herrick et al. (2001) yielded a correlation between the stability class and % aggregate stability based on oven-dry weight remaining after treatment using a mechanical sieve. They have applied the methodology to a wide variety of agricultural and natural ecosystems throughout western North America and found that it is highly sensitive to differences in management and plant community composition. |
| Decision | Comparison of impacts of treatments may reinforce a particular choice for soil management. |
| Value | Questionable value considering the extra effort – does it give repeatable quantifiable results? If not then a simpler method may be better and standard quantitative methods conducted in the laboratory if needed. |
Test 11. Aggregate stability in water – slaking and dispersion
| Name of test | Field assessment of aggregate stability in water |
Description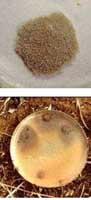 | Emerson (1967) rates slaking and dispersion into 8 classes – a method best suited to a laboratory. Loveday and Pyle (1973) modified the Emerson test to provide a relatively rapid assessment of susceptibility to dispersion that is assessed semi-quantitatively (rating between 0-16 – with measurements taken at 2 and 20 hours). Results have been related to key soil properties affecting crop production (e.g. hydraulic conductivity). A useful method that rates dispersion for intact aggregates as well as for remoulded soil – but best suited to a laboratory. Daniells and Larsen (1991) modified the Loveday and Pyle test for use in the field. They shortened the experimental time to a maximum of 2 hours. A bolus from soil texture measurement was used to provide a remoulded score. Air-dry aggregates are placed in a Petri dish containing rainwater. At 10 min and 2 hours, a visual judgement is made of the degree of dispersion, and an overall score between 0-4 assigned. A score of 0 indicates no dispersion within 2 hours a score of 1 is slight dispersion within 2 hours; a score of 2 is slight dispersion within 10 minutes or strong dispersion within 2 hours; and a score of 4 is complete dispersion within 10 min. For those aggregates that scored 0, dispersion after remoulding was determined (where soil was mixed with rainwater to a plastic consistency and remoulded with a knife for 1 minute – small balls of soil were formed and placed in a Petri dish with rainwater – degree of dispersion then assessed as for dispersion on wetting, but with letter ‘R’ appended to the score – giving a range of scores between 0R and 4R). Field et al. (1997) combined attractive features of the Loveday and Pyle (1973) and Daniells and Larsen (1991) dispersion tests to produce a new ‘aggregate stability in water’ test (‘ASWAT’). This method is a simple procedure that can be easily compared with the Loveday and Pyle test, but is faster and requires no specialised equipment. A similar technique is currently used at many ‘Healthy Soils’ training workshops and field days. For the ASWAT test, air-dry aggregates and remoulded samples (as for soil texture determination at a water content just above its plastic limit) are placed in a dish with distilled water. A visual assessment of the degree of dispersion is made either at 10 minutes and 2 hours (with a scoring range from 0-16) or after 10 minutes only in an attempt to speed up the procedure (with a scoring range from 0 to 8). |
| Method reference | Daniells and Larsen (1991) and Field et al. (1997). |
| Complexity | A simple on-site test that can be carried out by anyone. |
| Technology | Low – only Petri dish and distilled water required. Adapted from laboratory test that requires additional observation after 20 hours. |
| Cost and time | Very low cost. Requires only a few minutes to set up but at least 30 minutes duration (2 hours duration for full assessment). |
| Interpretation | A good indication of high ESP and low OM |
| Decision | Useful for in paddock decisions on determining “sodic” zones |
| Value | A very useful tool for determining the most economic use of gypsum with or without VRT ability. |
Test 12. Aggregate stability in water -field-based wet sieving test (Cornell)
| Name of test | Cornell raindrop simulator wet-sieving |
Description | A wet-sieving test that uses a portable raindrop simulator and measures the extent to which soil aggregates resist falling apart when wetted and hit by rain drops. It is measured using a rain simulation sprinkler that steadily rains on a sieve containing known weight of soil aggregates between 0.5 mm and 2.0 mm. The unstable aggregates slake (fall apart) and pass through the sieve. The fraction of soil that remains on the sieve is used to calculate the percent aggregate stability.  |
| Method reference | Cornell University Soil Health Team (2005). |
| Complexity | A relatively straight forward test carried out in the lab if you had the relevant equipment. |
| Technology | Medium/High – need specialised equipment (rainfall simulator, 2.0 mm and 0.25 mm sieves, electronic shaker). |
| Cost and time | Quite a timely method; air drying soil, shaking, placement of soil evenly on sieves, rainfall simulation for 5 mins, soil samples collected, dried and weighed and finally calculations. Sieves approximately $75 each, rainfall simulator approximately $600, Coarse Sieve Shaker. |
| Interpretation | Scoring function is available for interpretation of aggregate stability for silt, sand and clay textured soils. The coloured shading reflects the colour coding used for the ratings in the Soil Health Report. |
| Decision | Could be used to guide improvements in traffic management or tillage or remedial soil management. |
| Value | Depends on any other uses for the equipment as they may make this test economically un-viable. Could be a good monitoring tool for crop and pasture situations. |
Test 13. Aggregate size sorting
| Name of test | Aggregate size sorting |
Description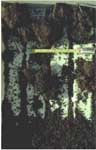 | A 20 cm by 20 cm by 10 cm deep sample of surface soil is placed in a large tray or on a board or tarpaulin. Gentle force is used to separate the soil mass into natural aggregates. Three size fractions are separated: >60 mm; 20-60 mm; <20 mm Photograph should be taken for reference in future monitoring. Aggregate stability in water test is a good complementary test to perform on the same soil. If all material falls into <20 mm size classes then a further examination for material <2.0 mm should be made to assess vulnerability to wind and water erosion. Method could be modified to accommodate natural size ranges of aggregates observed at a particular site (e.g. for soil health management monitoring on farm) to refine this as a monitoring tool. |
| Method reference | New Zealand agronomist, personal communication |
| Complexity | A simple on-site test that can be carried out by anyone. |
| Technology | Nil special skills or equipment required. Could be sensitive to moisture conditions. Best performed when soil is in a friable state (not too wet, not too dry). Could use two coarse sieves (60 mm and 20 mm mesh) but disruption of the soil mass needs to be done with low energy input. |
| Cost and time | $0 ; 5-10 minutes |
| Interpretation | High proportion of soil material falling into >60 mm fraction is an indicator of cloddiness, poor physical condition. All material falling into <20 mm an indicator of soil with potentially weak macro-aggregation. Good technique for comparing differences between paddocks or areas within a paddock. May relate to soil aeration and infiltration. |
| Decision | Could be used to guide improvements in traffic management or tillage or remedial soil management. |
| Value | Relevant to cropping and to pasture situations. High value for effort. Good monitoring tool. |
Test 14. Aggregate sieving for wind erosion risk
| Name of test | Aggregate sieving for wind erosion risk |
Description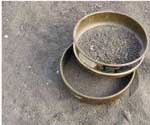 | Place a known amount of soil in a 200 mm diameter sieve with 2 mm mesh and gently shake into a catcher. The soil that passes through the sieve is the soil that is at high risk of erosion by wind if groundcover is inadequate, less than 50% of anchored groundcover. |
| Method reference | John Leys, NSW Department Land and Water Conservation, personal communication. |
| Complexity | A simple on-site test that can be carried out by anyone. |
| Technology | Anyone can do it and it is quick to do a number of tests across a paddock, especially if there is soil variation. |
| Cost and time | The cost of the sieve that can be purchased at most hardware stores and a little time in the paddock. |
| Interpretation | If more than 20% of the soil passes through the sieve at a number of sites in the paddock then it is at risk of serious wind erosion. |
| Decision | Is groundcover adequate? More than 50% of anchored groundcover particularly in light soils. |
| Value | Valuable in determining erosion risk and preventative/ protection action. |
Test 15. Soil strength – penetrometer resistance
| Name of test | Penetrometers – measuring soil strength |
Description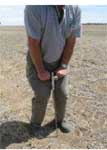 | A penetrometer, preferably with a gauge, is pushed into the soil at a constant rate and readings observed as it moves down the soil profile. Penetrometers are one of the most widely used methods of estimating resistance to root growth in soil, and may also be used for detecting layers of different soil strength. Useful to demonstrate impact of management practices on soil compaction e.g. hard pans, high traffic areas etc.  |
| Method reference | Operating instruction sheet supplied with the penetrometer, or instructions as given in SOILpak (New South Wales Department of Primary Industries 2005a). |
| Complexity | A simple on-site test that can be carried out by anyone. However, need to understand the importance of exerting a constant pressure on the penetrometer when pushing it down the profile and impact of soil moisture on penetration resistance. |
| Technology | Need specialist equipment, preferably a penetrometer with a gauge. |
| Cost and time | $348 from www.themeterman.com.au A large number of readings can be collected across a paddock in a short period of time (20 mins). |
| Interpretation | Colour coding on the gauge (green, yellow and red) provides a broad indication of restrictions to root growth. Operating instructions and interpretation sheet is supplied with the penetrometer. |
| Decision | General decisions on compaction can be made but need to understand the soil type and how best to manage it. |
| Value | Penetrometers are widely used to measure soil resistance to penetration. Is a useful tool to start discussion and to get a visual reference. It can also be used measure depth of friable topsoil with a large number of readings at zero resistance across a paddock. |
Test 16. Field-based infiltration
| Name of test | Cornell raindrop simulator infiltrometer |
Description | Soil infiltration rate is an important soil quality indicator, as it has important agricultural and environmental implications and is strongly affected by land management practices. Measurement of soil infiltration rate is generally determined by ponded ring infiltration or simulated rainfall, each having specific advantages and disadvantages. The Cornell Sprinkle Infiltrometer (Ogdenet al., 1997) was designed to combine the advantages of both. It also allows for easy and rapid measurement of soil infiltration, as this is essential to adequately estimate spatially and temporally-variable infiltration behaviour (van Es, 1993). The Cornell Sprinkle Infiltrometer system consists of a portable rainfall simulator that is placed onto a single 241-mm (9 1/2") inner diameter infiltration ring and allows for application of simulated rainfall at a wide range of predetermined rates. The apparatus permits the determination of several important soil hydrological properties: time-to-runoff, sorptivity, and field-saturated infiltration rate. 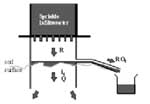 |
| Method reference | Cornell University Soil Health Team (2005). |
| Complexity | Operating the equipment is quite simple; the setting up may be a little bit fiddly. |
| Technology | The sprinklers are required to be calibrated, as they are designed to simulate a wide range of rainfall events. Medium rating as calibration required, ring insertion, field work and then data analysis. |
| Cost and time | The raindrop simulator costs about $1000. If you can build your own it will be a relatively small cost. Can be operated by one person. Rain simulation, once calibration completed, the process to collect all data may take up to one hour. |
| Interpretation | No ready reckoner with this method, Believe it is based on individual measurements of rainfall, runoff and infiltration rates. These can be used for comparison with different soil types and management practices. |
| Decision | Could be used for in-paddock decisions. |
| Value | As reported, the equipment can be used for other measurements of soil physical behaviour. This increases the value of the equipment. It is quite portable so useful for showing soil hydrological properties to informed grower groups, on different soil types. |
Test 17. HSSF Healthy Soils Test Kit -Infiltration
| Name of test | Infiltration |
| Description | The infiltration test can be used as an indicator of soil structure and compaction. A 200 mm PVC tube is inserted into the ground and a known volume of water is applied to the soil. The time taken for the water to infiltrate is recorded and infiltration rate is calculated. Soils with a healthy structure will generally have higher infiltration rates, higher water holding capacities and higher plant available water. |
| Method reference | Grace and Weier (2007) |
| Complexity | A relatively simple method. |
| Technology | No complex equipment required, only PVC pipe, measuring cylinder and stopwatch – all provided in the Soil Health test kit. |
| Cost and time | Inexpensive and fairly rapid (30 mins – 4 hours) method, depending on antecedent soil moisture. Infiltration should not be measured in dry soil and may be necessary to pre-wet which can take time. If the soil is saturated, need to wait 1-2 days to allow for the soil to approach field capacity. Recommended that tests are undertaken at least in triplicate, which takes time unless additional PVC pipes are purchased. |
| Interpretation | Kit includes an easy to understand ready reckoner, infiltration rate and class interpretation tables. |
| Decision | Could be used for in-paddock decisions. |
| Value | A useful and relatively simple test to demonstrate the impact of compaction on soil structure. |
Test 18. Paint percolation test
| Name of test | Paint Percolation Test |
Description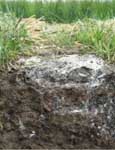 | The paint percolation test provides a visual assessment of soil structure, particularly on cracking clay soils. An open-ended steel frame or 30 cm steel ring is inserted 5 cm into the soil and diluted white acrylic paint (approx 1:7 paint:water by volume) is poured carefully into frame or ring, using an object under the flowing paint to prevent direct disturbance of the soil surface. The paint is then left overnight or for 24 to 48 hours to infiltrate into the soil. Once the paint has infiltrated, the frames are lifted and the soil is excavated with a spade or mattock to expose the depth of paint percolation. |
| Method reference | New South Wales Department of Primary Industries (1998). The SOILpak for Cotton Growers procedure was based on methods developed by The University of Sydney and CSIRO Land and Water, Canberra. |
| Complexity | An easy test for field staff to demonstrate. |
| Technology | Steel frames or rings need to be manufactured. Alternatively large diameter PVC rings (>200 mm) could be used if easily sourced. |
| Cost and time | Cost of manufacture of steel frames or rings ($50/each) plus 2 litres of acrylic paint per frame. Time consuming as need to wait 12-48 hours for the paint to infiltrate into the soil. |
| Interpretation | None. The greater the amount of paint infiltrated down the soil profile, the better the interconnection of soil pores and better soil structure. |
| Decision | Can be used to help make in-paddock decisions regarding management practices. |
| Value | A very useful method to demonstrate the impact of management practices on soil structure (e.g. comparison of random traffic vs. controlled traffic). |
Test 19. HSSF Healthy Soils Test Kit -bulk density and soil moisture
| Name of test | Bulk density and soil moisture |
| Description | Bulk density is a measure of soil compaction; the greater the density, the less pore space for water movement, root growth & penetration and seedling germination. Bulk density is assessed by driving a metal ring into the soil then removing it with a spade. The soil within the ring is extracted, dried then weighed. Soil moisture can be obtained from the same soil sample. |
| Method reference | Grace and Weier (2007) |
| Complexity | A relatively simple method once growers have been trained. Calculations may be a little difficult for untrained operators. Depending on skills of operator, bulk density results can be highly variable, especially in cracking clay soils. |
| Technology | No specialist equipment required. Some issues with the accuracy of the dimensions of the metal ring in the Soil Health test kit. |
| Cost and time | Inexpensive. Time required to weigh, dry and re-weigh samples and some experience required when drying heavy clay soils. |
| Interpretation | General relationship of impact of bulk density on root growth is well established. |
| Decision | Not recommended for in-paddock decision-making. |
| Value | Bulk density is an important measure of soil structure, but depending on the skills of the user and concerns about the accuracy of the metal ring, results can be highly variable, especially in cracking clay soils. |
Test 20. HSSF Healthy Soils Test Kit -soil stability
| Name of test | Soil stability (slaking & dispersion) test |
| Description | The slaking and dispersion test measures the stability of soil when exposed to rapid wetting. The test is qualitative and should be measured on air-dried soil aggregates after returning from the field. Aggregates are placed into a Petri dish containing distilled water, and the amount of slaking and dispersion is observed. |
| Method reference | Grace and Weier (2007) |
| Complexity | A simple test that can be carried out by untrained users. |
| Technology | No specialist equipment required. |
| Cost and time | Inexpensive. Can be time consuming as procedure suggests that soil should be air dried. Samples should be left for 24 hours before checking for dispersion. |
| Interpretation | Clear benchmarks widely accepted. |
| Decision | Can be used to help make in-paddock decisions regarding management practices (e.g. gypsum application, management of organic matter). |
| Value | A valuable and relatively easy test to assist in in-paddock decision making. |
Test 18. Water Repellence Test (laboratory method)
| Name of test | Molarity of Ethanol Drop (MED) test |
| Description | Water repellent soils tend to have water bead on the surface, repelling water after rainfall. Water does not evenly infiltrate a water repellent soil until there is a continuous film of water on the soil particles – even then uneven wetting patterns are still obvious. Water repellence is caused by a series of long-chain polymethylene waxes attached to the sand grains. This can lead to reduced crop and pasture production and ultimately bare soil surfaces. Laboratory testing is the most reliable test to determine the degree of water repellence. The MED test measures the molarity of ethanol drops that are absorbed into the soil within 10 seconds. The higher the concentration of ethanol needed, the more water repellent the soil. |
| Method reference | King (1981) |
| Complexity | A simple test that can be carried out by untrained users. Can be conducted at any time of the year; however for consistency air or oven dried samples are required. |
| Technology | Minimal equipment required – timer, a range of methanol solutions, Petri dishes. The aqueous ethanol solutions are prepared at 0.2M intervals from 0 (wettable) to 5M (very severe water repellence). |
| Cost and time | Inexpensive. Can be a little time consuming as procedure suggests that soil should be air dried. |
| Interpretation | Very easy interpretation. Under lab conditions the measurements should be made at 20ºC so the results can be corrected to 20ºC by the relationship table (King, 1981). |
| Decision | This is a reliable test, relatively quick test and only small samples are required. Is used to determine the presence of or severity of water repellence. |
| Value | Of value for areas of lighter textured soils to determine whether water repellence is an issue. This method has value as it can highlight soil issues and trigger discussion amongst growers |
Test 19. Water Repellence Test (field method)
| Name of test | Water Repellence Field Test |
| Description | Water repellent soils tend to have water bead on the surface, repelling water after rainfall. Water does not evenly infiltrate a water repellent soil until there is a continuous film of water on the soil particles – even then uneven wetting patterns are still obvious. Water repellence is caused by a series of long-chain polymethylene waxes attached to the sand grains. This can lead to reduced crop and pasture production and ultimately bare soil surfaces. Field testing method is simple and based on the lab test; however an abbreviated form is used. |
| Method reference | McDonald et al. (1990) |
| Complexity | A simple test that can be carried out by untrained users. |
| Technology | Minimal equipment required – timer, water and two concentrations of ethanol solutions, Petri dishes. |
| Cost and time | Inexpensive, very quick test. |
| Interpretation | Very easy interpretation. Degree of repellence is assessed by determining the concentration of ethanol required to wet the sand in 10 seconds. As described in the yellow book, the soil is not repellent, repellent or severely repellent dependent on whether water or 2M ethanol soaks into the soil within 10 seconds. |
| Decision | This is a reliable test, relatively quick test and only small samples are required. Is used to determine the presence of or severity of water repellence. |
| Value | Of value for areas of lighter textured soils to determine whether water repellence is an issue. This method has value as it can highlight soil issues and trigger discussion amongst growers |
Appendix 2. Soil chemical tests
Test 21. HSSF Healthy Soils Test Kit -electrical conductivity
| Name of test | Electrical Conductivity (EC) |
| Description | EC indicates the amount of salts present in the soil, an excess will affect plant growth. Soil samples are collected from the 0 to 7 cm depth and EC estimated from a 1:5 (soil/water) solution, then converted to 1:1 for ease of interpretation. |
| Method reference | Grace and Weier (2007) |
| Complexity | A fairly easy test for trained growers. Some of the procedural text in the manual (version 1) is a little confusing. |
| Technology | Requires a relatively inexpensive EC meter, calibration solution and scales – all provided in Soil Health test kit. |
| Cost and time | Rapid assessment (5-15 mins). May need to replenish calibration solution every few months, depending on number of samples tested. |
| Interpretation | Different EC units and conversion factors can be confusing for growers. Interpretation provides indication of crop and microbial responses to different salinity levels. |
| Decision | Very useful for in-paddock decision making. |
| Value | A rapid and useful test to indicate if salinity is impacting on crop production. |
Test 22. HSSF Healthy Soils Test Kit -soil pH
| Name of test | Soil pH test |
| Description | pH is an indicator of acidity or alkalinity of soil. It effects plant growth, microbial activity and solubility of soil minerals. A measure of soil acidity or alkalinity a pH range of 6 -7.5 is considered suitable for plant growth. Based on a 1:5 (soil/water) method for the estimation of pH. |
| Method reference | Grace and Weier (2007) |
| Complexity | An easy test for trained growers. Uses same procedures for sample preparation as per EC test. Some of the procedural text in the manual (version 1) is a little confusing. |
| Technology | Requires a relatively inexpensive pH meter, buffer solution and scales – all provided in Soil Health test kit. |
| Cost and time | Rapid assessment (5-15 mins). May need to replenish buffer solution every few months, depending on number of samples tested. |
| Interpretation | Limited interpretation in manual – recommended to consult local adviser for specialist information. |
| Decision | Very useful for in-paddock decision making. |
| Value | A rapid and useful test to indicate the pH status of the soil. However, growers prefer the barium sulphate, pH dye indicator and colour card test kits (e.g. Manutec) as they require no calibration and are readily accessible from hardware stores. |
Test 23. Field assessment of soil pH
| Name of test | Soil pH Test kit |
Description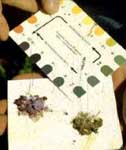 | The pH test kit uses universal indicator and a colour chart to measure the pH of the soil in the field. Soil samples can be collected whilst digging a shallow hole with a spade, augering a hole to depth or by excavating a soil pit. pH is an indicator of acidity or alkalinity of soil. It effects plant growth, microbial activity and solubility of soil minerals. A measure of soil acidity or alkalinity; a pH range of 6-7.5 is considered suitable for plant growth |
| Method reference | As per field pH kit instructions. |
| Complexity | An easy test for growers, little or no training would be required to undertake the visual assessment. |
| Technology | No specialised equipment required. |
| Cost and time | Field pH kits are available from agricultural re-sellers for $25-$30. |
| Interpretation | Limited interpretation – recommended to consult a local adviser for specialist information. |
| Decision | Very useful for in-paddock decision making if many tests are undertaken. |
| Value | A rapid and useful test to indicate the pH status of the soil. This test is preferable to the pH meter as no calibration is required and they are readily accessible. Growers should be made aware that these results are estimates only, and equate to approximately half a unit of a laboratory water pH test. |
Test 24. HSSF Healthy Soils Test Kit – soil nitrate
| Name of test | Soil Nitrate test (NO3) |
| Description | The amount of nitrate in the soil is the balance between decomposition of organic matter, losses and plant uptake. Soil nitrate is the form of N readily available to plants and excess amounts may indicate overfertilisation. Nitrate test strips are used to estimate the amount of nitrate in a soil solution. |
| Method reference | Grace and Weier (2007) |
| Complexity | Uses same procedures for sample preparation as per EC and pH tests. Use of nitrate test strips is relatively easy for untrained growers. Nitrate test strips are very sensitive to light and heat. |
| Technology | Requires relatively inexpensive nitrate test strips and other equipment provided in Soil Health test kit. |
| Cost and time | Relatively inexpensive and rapid (5-15 mins) test |
| Interpretation | No benchmarks. Nitrate-N is constantly in flux, so it is difficult to interpret the nitrate-N content in terms of how much and when N will be available to meet crop needs. Interpretation required from trained local advisers. |
| Decision | Can be used to help make in-paddock decisions, but only with careful interpretation and advice from local advisers. |
| Value | Not recommended for growers unless they receive careful interpretation and advice from local advisers. |
Test 25. Potentially mineralisable nitrogen
| Name of test | Potentially mineralisable nitrogen |
| Description | Potentially mineralisable nitrogen (PMN) is an indicator of the capacity of the soil microbial community to convert (mineralise) nitrogen tied up in complex organic residues into the plant available form of ammonium. Soil samples are incubated for 7 days and the amount of ammonium produced in that period reflects the capacity for nitrogen mineralisation. The PMN test provides an indication of the capacity of the soil (the soil microbes) to recycle organic nitrogen into the plant available forms. Soils with high levels of nitrogen-rich organic matter (e.g., soils where legumes are in rotation) tend to have the highest populations of microbes involved in nitrogen mineralisation and the highest PMN rates. |
| Method reference | Gugino et al.(2007) |
| Complexity | Method is straightforward -any technician could carry it out – some specialist knowledge required. |
| Technology | Requires some specialist equipment/facilities. |
| Cost and time | Relatively inexpensive and quick. |
| Interpretation | No benchmarks widely accepted. Measure could range between 2.5 and 13 gN/g dry soil/week but will vary considerably with soil type and climate as well as management. |
| Decision | Can be used (with careful interpretation and advice) to help make in paddock decisions regarding management practices. Low levels may indicate a need to use legume rotations or use management practices to increase organic matter. |
Test 26. HSSF Healthy Soils Test Kit -mineralisable nitrogen
| Name of test | Mineralisable Nitrogen (N) |
| Description | The mineralisable N test provides an indication of the nitrogen supplying capacity of the topsoil. Soil samples are incubated in-situ for 7 days, then nitrate test strips used to estimate nitrate in soil solution as per soil nitrate test. |
| Method reference | Grace and Weier (2007) |
| Complexity | Although not a complex procedure, it is recommended that it should only be undertaken by trained advisers. |
| Technology | Requires a relatively inexpensive nitrate test strips and other equipment provided in Soil Health test kit. |
| Cost and time | Relatively inexpensive and but test cannot be completed on the same day as other tests, as it requires a minimum of 7 days for moist soil to incubate in the field. |
| Interpretation | No benchmarks. Interpretation required from trained local advisers. |
| Decision | Can be used to help make in-paddock decisions, but only with careful interpretation and advice from local advisers. |
| Value | Not recommended for growers unless they receive careful interpretation and advice from local advisers. |
Appendix 3. Models and calculators for soil carbon
Model 4. Carbon Calculator
| Tool | Carbon calculator |
| Simple description and purpose | The Carbon calculator estimates the plant residue input that enters the soil based on various crop rotations |
| Input variables | The input variables for the for the Carbon calculator are (i) crop rotation, (ii) average yield and (iii) harvest index. |
| Output variables | The spreadsheet returns values plant carbon input to soil |
| Verifications | Verified for limited sites in Victoria |
| Complexity | Method is straightforward – anybody could carry it out –moderate knowledge about various crop management systems is required (rating 0) |
| Technology | Requires no special equipment/ facilities. However, a computer with Microsoft excel is required |
| Cost ($ and time) | Software is free. Easy to run the program at paddock level |
| Available from | Peter Fisher, DPI Tatura, Victoria, email: peter.fisher@depi.vic.gov.au |
| Interpretation | Simple comparison of plant material input to soil due to changes in crop management systems |
| Decision | Useful for in-paddock decision making |
Model 5. SOCRATES model
| Tool | SOCRATES model |
| Simple description and purpose | A simple model for predicting long-term changes in topsoil soil organic carbon in terrestrial ecosystems, which requires minimal data inputs and specifically designed to examine the impact of land use and land use change on soil carbon storage. |
| Input variables | The main considerations in the development of SOCRATES were that it be based on generic concepts of carbon cycling and biogeochemistry, as well as being easy to use and widely applicable. It would also not require detailed fractionations of carbon pools as inputs. SOCRATES uses a weekly time step and the minimum input variables are: (i) annual precipitation, (ii) mean annual temperature, (iii) soil clay content (iv) CEC, (v) initial soil organic C, and (vi) and bulk density. |
| Output variables | It predicts long-term changes in topsoil soil organic carbon in terrestrial ecosystems. |
| Verifications | SOCRATES was successful in predicting SOC change at eighteen long-term crop, pasture and forestry trials from North America, Europe and Australia. These trials ranged from 8 to 86 years in duration, over a wide range of climates and soil types with annual changes in SOC ranging from -3.0 to 4.2%. It was reported in the literature that the accuracy of SOCRATES in simulating changes in SOC in agro-ecosystems found to be superior to both the CENTURY and RothC-26.3 |
| Complexity | Method is relatively simple compared to the process based models available. Anybody would be able to use it. However specialist knowledge is required (rating 3). |
| Technology | Requires no special equipment/ facilities. However, a computer with Microsoft excel is required |
| Cost ($ and time) | Software is free. Easy to run the program at paddock level |
| Available from | Grace et al. (2006 a,b) |
| Interpretation | Peter R. Grace, School of Natural Resource Sciences, Queensland University of Technology, Brisbane, Qld 4060, Australia. |
| Decision | Simple comparison can be made for various crop management system |
| Useful for in-paddock decision making |
Index 1. Soil Conditioning Index
| Tool | Soil Conditioning Index (SCI) |
| Simple description and purpose | The SCI estimates trends in soil organic matter in the top 10 cm of the soil. The SCI combines the effect of three determinants of organic matter as follows. SCI = OM + FO + ER where: OM is the organic material or biomass factor. This component accounts for the effect of biomass returned to the soil, including material from plant or animal sources, and material either imported to the site or grown and retained on the site. FO is the field operations factor. This component accounts for the effect of field operations that stimulate organic matter breakdown. ER is the erosion factor. This component accounts for the effect of removal and sorting of surface soil organic matter by sheet, rill, or wind erosion processes as predicted by water and wind erosion models. It does not account for the effects of concentrated flow erosion, such as ephemeral or classic gullies. |
| Input variables | The input variables for the for the SCI are (i) location (to determine climate data), (ii) soil texture, (iii) all crops in the crop rotation, (iv) typical yield for each crop, (iv) applications of additional organic matter (e.g. manure or compost), (v) all field operations (including tillage, applications of fertilizer and manure, and harvesting), and (vi) rate of wind and water erosion. |
| Output variables | The spreadsheet returns values for each component—OM, FO, and ER—as well as the overall SCI. The results from SCI cannot be used to predict the amount of organic matter or t he rate of change. Higher values only indicate more confidence that a trend in soil organic matter will be significant. For example, consider a cropping scenario with an SCI value of 0.4 compared to a second scenario with an SCI of 0.2. Carbon and organic matter levels will increase under both systems, and a significant increase is more likely under the first scenario |
| Verifications | Verified north in American conditions. Not tested for Victorian conditions. |
| Complexity | Method is straightforward – anybody could carry it out –knowledge moderate specialist knowledge is required (rating 2). |
| Technology | Requires no special equipment/ facilities. However, a computer with Microsoft excel is required |
| Cost ($ and time) | Software is free. Easy to run the program at paddock level |
| Available from | USDA (2002) |
| Interpretation | Simple comparison can be made for various crop management system |
| Decision | Useful for in-paddock decision making |
Model 6. Rothamsted Carbon Model
| Tool | Rothamsted Carbon Model (RothC-26.3) |
| Simple description and purpose | The RothC model allows calculating the effect of organic matter management on the development of soil organic carbon in non-waterlogged topsoils over a period ranging from a few years to a few centuries. It takes thereby into account the quality and quantity of the organic matter added, soil type, temperature, moisture content and plant cover on the turn over process. This will be used to provide estimates for the National Carbon Accounting System (NCAS). In this model, soil carbon is partitioned into 5 pools. There are four active pools: a decomposable plant material pool (DPM), a resistant plant material pool (RPM), a microbial biomass pool (BIO) and a humified organic matter pool (HUM). A fifth pool is included to account for inert carbon (IOM). |
| Input variables | The input variables for this model are: (i) monthly rainfall, (ii) monthly open pan evaporation, (iii) average monthly mean air temperature, (iv) clay content of the soil, (v) an estimate of the decomposability of the incoming plant material -the DPM/RPM ratio, (vi) soil cover, (vii) monthly input of plant residues, (viii) monthly input of farmyard manure and (ix) depth of soil layer sampled. |
| Output variables | The model simulates at a monthly time step for a period of several decades (i) total organic C content in the top soil, (ii) microbial bio mass C content in the top soil and (iii) radiocarbon age of the soil. |
| Verifications | This model has been optimized for Australian conditions by adjusting the decomposition rate variables for the five pools used by the model, including four active pools: a decomposable plant material pool (DPM); a resistant plant material pool (RPM); a microbial biomass pool (BIO); and a humified organic matter pool (HUM), and a fifth inert carbon (IOM) pool consisting mostly of charcoal. Much of the data for the study was obtained from a Brigalow site in Queensland and from the Waite Institute in South Australia. These data were augmented with long-term detailed climate, soil and crop data from Wagga Wagga (NSW), Merredin (WA) and Tarlee (SA). |
| Complexity (rating 0-10) | The Roth-C Ver. 26.3 is a written in Excel. However,specialist skill, knowledge and training is required to run this model (rating 5) |
| Technology | The Roth-C model was adapted to run in Excel by the Australian Greenhouse Office (AGO). This has several advantages over the previous DOS version: (i) the output can be graphed in the same package; (ii) it is relatively simple to use actual weather and yield data rather than long-term averages; and (iii) it allows add-ons such as @Risk? to enable Monte Carlo simulation to be performed. |
| Cost ($ and time) | Software is free. Easy to run the program at paddock level |
| Reference | Coleman and Jenkinson (1999) |
| Available from | K. Coleman, IACR, Rothamsted, United Kingdom. Email: coleman@bbsrc.ac.uk |
| Interpretation | Comparison of changes in C, N, through a time scale of an annual cycle to several decades can be made for various crop management systems. |
| Decision | Useful for paddock and farm level decision making |
Model 7. CENTURY model
| Tool | CENTURY model |
| Simple description and purpose | The CENTURY model is a multi-compartmental ecosystem models (designed for local-scale studies) was developed by Colorado State University and USDAARS. The Century model Version 4.0 embodies understanding to date of the biogeochemistry of Carbon, Nitrogen, Phosphorus, and Sulphur. The primary purposes of the model are to provide a tool for ecosystem analysis, to test the consistency of data and to evaluate the effects of changes in management and climate on ecosystems. |
| Input variables | The input variables for the CENTURY model are: (i) soil texture, (ii) monthly average maximum and minimum air temperature, (iii) monthly precipitation, (iv) lignin content of plant material, (v) plant tissue C N ratio and initial soil C and N and (vi) soil N inputs through fertilisation and atmospheric decomposition. |
| Output variables | The model simulates the long-term (at a time scale from annual cycle to centuries to millennium).dynamics of Carbon, Nitrogen, Phosphorus and Sulphur (S) for different Plant-Soil Systems. The model can simulate the dynamics of grassland systems, agricultural crop systems, forest systems, and savannah systems. |
| Verifications | The model has been successfully applied to various ecosystems and various locations around the world. However, not verified for Victorian conditions. |
| Complexity (rating 0-10) | Model in written in FORTAN language. Specialist skill, knowledge and training is required (rating 7) |
| Technology | The model is available on either the PC or UNIX platforms. |
| Cost ($ and time) | Software is free. Easy to run the program at paddock level |
| Reference | Parton et al. (1987); Bandaranayake et al. (2003) |
| Interpretation | Comparison of changes in C, N, P, and S through a time scale of an annual cycle to centuries and millennia can be made for various crop management systems. |
| Decision | Useful for paddock and farm level decision making. |
Appendix 4. Soil biological tests
Test 27. Earthworm counting
| Name of test | Earthworm counts numbers and species diversity (native versus introduced species) |
| Description | A simple method whereby earthworm numbers and species types are counted from paddock sample sites at varying depths. Not useful in areas where rainfall is below 600 mm. Also, seasonality is a factor as earthworms tend to be dormant (deep underground) in hot dry months. Therefore best to sample in wetter periods. Is considered a general indicator of soil health, particularly soil structure and carbon levels. |
| Method reference | Mele and Hollier (1995) |
| Complexity | A very simple on-site test that can be carried out by anyone. |
| Technology | No specialist equipment needed. Some reference to identify species types required. |
| Cost and time | Inexpensive and quick. |
| Interpretation | No clear benchmarks – however, numbers respond to changes in moisture levels and pH. |
| Decision | Would not use for in paddock decisions however could be used as a general indicator of organic matter as a soil biology food source. |
Test 28.HSSF HealthySoilsTest Kit:earthwormcounting
| Name of test | Earthworm counts |
| Description | A simple method whereby earthworm numbers are counted from a 30 cm deep hole dug with a spade. |
| Method reference | Grace and Weier (2007) |
| Complexity | A very simple on-site test that can be carried out by anyone. |
| Technology | No specialist equipment needed, only a spade and a plastic sheet. |
| Cost and time | Inexpensive and quick (5-10 mins) |
| Interpretation | No clear benchmarks as numbers are highly dependent on seasonal conditions. Numbers respond to changes in moisture levels and pH. |
| Decision | Not recommended for in-paddock decision-making |
| Value | Not useful in areas where rainfall is below 600 mm. Also, seasonality is a factor as earthworms tend to be dormant (deep underground) in hot dry months. Therefore best to sample in wetter periods (spring and autumn). Is considered a general indicator of soil health, particularly soil structure and carbon levels. |
Test 29. Cotton Strip Assay
| Name of test | Cotton strip assay |
| Description | A cotton strip is buried in the field or into a soil sample and left for a period of time after which the fibre tensile strength decreases. Unbleached calico cloth can be used as a substitute for Shirley Burial Cloth. Better if standardised with soil samples at an even matric potential (-10 to -50 kPa), in controlled environment cabinet at temperature for consistent time. Relative loss of tensile strength gives a general indication of the cellulose decomposer potential of the soil. |
| Method reference | Latter and Walton (1988) |
| Complexity | A simple method |
| Technology | Expensive equipment required to measure tensile strength (www.instron.com) (external link). Controlled environment cabinet for incubating soil and cloth. |
| Cost and time | Consumables are inexpensive. Weeks required for decomposer activity to occur. |
| Interpretation | No clear benchmarks however could be used for comparison of decomposition potential in different soils or under different management. |
| Decision | Would not use for in paddock decisions |
Test 30. In situ cellulose decomposition (toilet roll)
| Name of test | Biological activity monitoring |
Description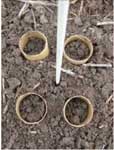 | A simple and economical method to see if there is any microbial activity in a paddock and/or to compare the effect on biological populations of different management or treatments between paddocks. Around August as we approach Spring when biological activity is expected to be at its peak, insert a cluster of 4 cardboard rolls “similar to toilet roll centres” making sure they are all the same type of cardboard, into the soil with about 20 mm protruding above the surface, insert a highly visible marker such as a fibreglass rod and flag or a steel post. Replicate this 5 times across the paddock/s about 100 m apart. After 5-6 weeks remove one roll from each cluster and measure how much of the roll has decomposed. Repeat this process at 4 weekly intervals and record measurements until all rolls have been removed. |
| Method reference | No published source |
| Complexity | A simple on-site test that can be carried out by anyone. |
| Technology | Anyone can do it and it is quick to a number of tests across a paddock. |
| Cost and time | No $$ required if you save the toilet roll centres, cardboard rolls can be purchased though. About an hour in the paddock to set up then a few minutes each collection time. |
| Interpretation | If the roll is decomposing it indicates some cellulose decomposers are present which is what you want for stubble breakdown. |
| Decision | Is the paddock management encouraging soil biological activity? |
| Value | Valuable in comparing management practices for crop residues. |
Test 31. Fungi:bacteria ratio
| Name of test | Fungi:bacteria ratio |
| Description | Some management practices can change the relative abundance of fungi and bacteria in the soil so this ratio can be used as an indicator to assess the effects of management strategies. There are several ways to measure this – 1) direct count method -Fungi and bacteria can be directly assessed by plate counts and the ratio of their abundance calculated; 2) Phospholipid fatty acid analysis (PLFA) -this method uses biochemical tests of fungi and bacteria (fatty acid analysis) as a basis for estimating the proportion of fungi and bacteria in soil; 3) substrate induced respiration (SIR) -this method assesses the ratio of fungi and bacteria in soil based on response to addition of carbon substrates. It is based on inhibition of fungi and bacteria in separate assays and inhibition of all biological activity as a control which is difficult to achieve across different soils. Gives a general indication of soil health. |
| Method reference | Abbott (2004) |
| Complexity | Plate count method is straightforward -any technician could carry it out. PLFA and SIR are more complex – some specialist knowledge required. |
| Technology | Plate count method requires some specialist equipment/facilities while PLFA and SIR require specialist equipment. |
| Cost and time | These techniques are moderately expensive and require some time to carry out. |
| Interpretation | There are no benchmarks so data are difficult to interpret – many would question validity of this measure. It has been suggested that a higher ratio might indicate a more stable undisturbed system. |
| Decision | Would not use for in paddock decisions |
Test 32. Active (labile) carbon
| Name of test | Active (labile) carbon |
Description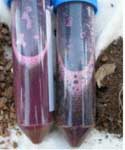 | Active carbon is an indicator of the fraction of soil organic matter that is readily available as a carbon and energy source for the soil microbial community (i.e., food for the soil food web). The soil is mixed with potassium permanganate (deep purple in colour) and as it oxidises the active carbon the colour changes (becomes less purple), which can be observed visually, but is very accurately measured with a spectrophotometer. See reference below for information about specific methodology. Active carbon is positively correlated with percent organic matter, aggregate stability, and with measures of biological activity such as soil respiration rate. Research has shown that active carbon is a good “leading indicator” of soil health response to changes in crop and soil management, usually responding to management much sooner (often, years sooner) than total organic matter percent. Thus, monitoring the changes in active carbon can be particularly useful to farmers who are changing practices to try to build up soil organic matter (e.g., reducing tillage, using new cover crops, adding new composts or manures). |
| Method reference | Gugino et al. (2007) |
| Complexity | Method is straightforward -anybody could carry it out – little specialist knowledge required. |
| Technology | Requires no specialist equipment/facilities other than access to a spectrophotometer for more complex version of the test. |
| Cost and time | Inexpensive and quick. |
| Interpretation | No benchmarks widely accepted, however useful for comparison between management treatments – simple comparison can be carried out in the paddock if visible colour change is obvious otherwise spectrophotometer measure are required. |
| Decision | Useful for in paddock decision making regarding management practices influencing organic C content. |
Test 33. Microbial activity
| Name of test | Microbial activity |
| Description | This measure can give an indication of the activity of soil organisms. This may be more relevant than the abundance of organisms for some purposes; however it is beneficial to measure both abundance and activity of soil organisms. The most common methods measure basal CO2 respiration (C released as microorganism utilise C as an energy source from soil OM) either in situ (e.g. Dreager tube apparatus) or off site in sealed containers. CO2 measures can be obtained directly with a gas analyser or indirectly by titration. This method is a potential indicator of the biological state of soil however there is no indication of which organisms are responsible for the activity and there may be issues relating to microbial stress response affecting results. |
| Method reference | Robertson et al. (1995) |
| Complexity | Methods are very straightforward - any technician could carry them out. |
| Technology | Requires only some specialist equipment/facilities for direct measure of CO2. |
| Cost and time | Relatively inexpensive however time consuming and laborious for multiple samples. |
| Interpretation | No benchmarks widely accepted. |
| Decision | Measures vary greatly with space and time so is probably best suited to compare management practises between similar paddocks. Microbial Biomass is probably a better option as microbial activity measures can be greatly influenced by stress on soil organisms. |
Test 34. Microbial respiration
| Name of test | Microbial respiration |
| Description | An estimate of the microbial activity in a soil can be made by measuring the CO2 produced by respiration. CO2 produced by respiration in a moist soil is trapped by absorption in NaOH solution. Titration for residual NaOH against HCL is used to calculate CO2 evolved from known mass of soil over a measured time period. |
| Method reference | Rowell (1994) |
| Complexity | Straightforward. Requires minimal training and access to common laboratory glassware. |
| Technology | Moderate. A simple respirometer can be constructed from a conical flask with a bung prepared to allow a small vial to hang within the flask air space. Standard solutions HCl and NaOH. |
| Cost and time | Relatively inexpensive to set up multiple sets of apparatus. Incubation of 50 g soil for a few days. |
| Interpretation | No benchmarks but a widely accepted method. |
| Decision | Difficult to use the results as a basis for any decision making. Results are affected by temperature and soil moisture content. |
| Value | There is no indication of which organisms are responsible for the activity and there may be issues relating to microbial stress response affecting results. |
Test 35. HSSF Soil Health Test Kit -soil respiration test
| Name of test | Soil respiration test |
| Description | CO2 evolution is measured as a potential indicator of the current level of biological activity in the soil. If the soil is moist, measurements are made after a 30 min incubation period. |
| Method reference | Grace and Weier (2007) |
| Complexity | Requires some training to setup the equipment in-situ. |
| Technology | All equipment in the Soil Health test kit. Some OH&S issues with the use of the glass Draeger tubes and needles. |
| Cost and time | Relatively inexpensive however time consuming and laborious for multiple samples. If the soil is dry, measurements should be made at least 6 hours after the infiltration test or wetting of dry soil. Replacement Draeger tubes approximately $14/each. |
| Interpretation | No benchmarks but a widely accepted method. |
| Decision | Can be used (with careful interpretation and advice) to help make in-paddock decisions regarding management practices. |
| Value | A useful education tool to demonstrate biological activity in soil, but of limited value for decision making purposes. There is no indication of which organisms are responsible for the activity and there may be issues relating to microbial stress response affecting results. |
Test 36. Microbial biomass
| Name of test | Microbial biomass C and N (& P & S) |
| Description | Microbial biomass measures give an indication of the total potential weight of microorganisms in soil. This methodology gives an estimation of the amount of C, N, P and S in living soil organic matter. Microbial biomass in soil can be measured by fumigation-incubation, fumigation-extraction and substrate-induced respiration methods. Fumigation methods involve killing the microbial biomass then extracting released nutrients such as nitrogen. Methodological problems associated with applying these methods to different soil types and at different times of the year have been extensively researched and the practical aspects are well understood. The identity of individuals making up the microbial biomass is not determined by these methods and this may be seen as a potential limitation. |
| Method reference | Amato and Ladd (1988) |
| Complexity | Method is straightforward -any technician could carry it out – some specialist knowledge required. |
| Technology | Requires some specialist equipment/facilities. |
| Cost and time | Relatively inexpensive however very time consuming and laborious. |
| Interpretation | No benchmarks widely accepted, however generally MBC between 150 and 200 ug/g dry cropping soil and between 200 and 400 ug/g dry pasture soil is normal in Victorian soils. Consideration should be given to problems associated with applying different methods to different soil types and at different times of the year. |
| Decision | Can be used (with careful interpretation and advice) to help make in paddock decisions regarding management practices. In SE Australia, Spring samples with average rainfall generally show data where biomass carbon ranges from 100-150 ug/g dry soil in a cropping system and between 200-500 ug/g dry soil in a pasture system. Numbers below this may reflect climatic, spatial or temporal variation. Adopting management to increase organic matter might be considered. |
Test 37. Microbial enzyme activity
| Name of test | Microbial enzyme activity |
| Description | Specific microbial enzyme activities can be measured to give an indication of specific microbial processes carried out in the soil. Various biochemical assays exist for a range of enzymes including cellulose, lignose, etc. Such assays can be used as general indicators of soil microbial health or more likely may be used to address more specific questions about microbial processes. |
| Method reference | Ross et al. (1984) |
| Complexity | Methods are generally straightforward -any technician could carry them out – some specialist knowledge required. |
| Technology | Requires some specialist equipment/facilities. |
| Cost and time | Relatively inexpensive and generally quick. |
| Interpretation | No general benchmarks widely accepted for soil health, however more likely to be used to answer specific questions regarding enzyme activity and the breakdown of particular compounds for example cellulose activity on cellulose or phosphatase activity breaking down organic phosphate sources. |
| Decision | Not useful for general in paddock management decisions but could help address specific questions such as those examples in the interpretation section. |
Test 38. Biolog plates
| Name of test | Biolog plates |
Description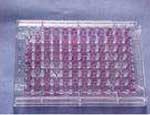 | The Biolog Plate test represents a sensitive and rapid method for assessing the potential metabolic diversity of microbial soil communities. Furthermore, the ecological relevance of certain contaminants such as herbicides, pesticides and metals to soil bacterial communities can also be assessed. The test involves inoculating samples into microplates that contain different carbon sources in addition to a tetrazolium dye. The utilization of any carbon source by the microbial community results in the respiration-dependent reduction of the dye and purple colour formation that can be quantified and monitored over time. |
| Method reference | Campbell et al. (1997) |
| Complexity | Method is straightforward -anybody could carry it out – some specialist knowledge required. |
| Technology | Requires no specialist equipment/facilities other than access to the Biolog plates. Two commercially available plates are the GN Biolog plates and Eco Biolog Plates. |
| Cost and time | Relatively inexpensive and quick – simple comparison can be carried out in the paddock. |
| Interpretation | No benchmarks widely accepted. Gives a simplified view of metabolic/functional diversity in soil microbial populations. |
| Decision | Not overly useful for paddock decision making. |
Test 39. Direct plate count/measurement of specific soil organism groups
| Name of test | Assessment of specific soil organism groups – direct plate counts/measurements. |
Description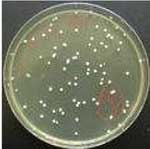 | Measurement of length of fungal hyphae (or scoring root colonisation) is possible but it is not usually possible to identify the fungi present. Soil microorganisms can be isolated from the soil environment and grown on artificial media. Different media encourage the growth of different types of microorganisms through the use of inhibitors and specialised growth substrates. The numbers of organisms capable of growth on a specific media are referred to as "colony forming units" (CFU) but this represents only 1-5% of the total population so has obvious limitations. Rhizobia (N fixing bacteria) can also be isolated and identification is possible from nodules on field plants. |
| Method reference | Janssen et al. (2002) |
| Complexity | Method is straightforward – any technician could carry it out – some specialist knowledge required for identification. |
| Technology | Requires some moderately specialist equipment/facilities for isolation/culturing. |
| Cost and time | Relatively inexpensive and reasonably quick – allow time for culture growth. |
| Interpretation | No benchmarks widely accepted – massive underestimations from culture data regarding taxonomic and functional diversity. |
| Decision | Limited use for in paddock decision making as only a small percentage of soil microbes can be cultivated – DNA technology a better option and likely to be research based. |
Test 40. Target specific genes
| Name of test | Target specific genes |
| Description | Individual specific taxonomic or functional groups of soil microorganisms can be targeted by direct DNA extraction from soil. Molecular techniques (e.g. qPCR) can be used note presence/absence or quantify the number of organisms present giving very useful information depending on what questions are being asked. A good example of this method is the Predicta B test (SARDI) that can be used to target and quantify groups such as plant pathogens (e.g. Rhizoctonia) (Pest test 3). Can give a very acuate measure of potential population sizes within the soil or potential activities relating to soil processes if a functional gene is targeted. |
| Method reference | Sharma et al. (2007) |
| Complexity | Complex techniques -specialist knowledge required to carry out molecular techniques. |
| Technology | Requires specialist equipment/facilities. |
| Cost and time | Moderate expense and reasonably quick. |
| Interpretation | No benchmarks in place to relate specific numbers to soil health – however very good for paddock to paddock or within paddock comparisons and can be used to give a regional perspective – also useful for trials. |
| Decision | Useful for in paddock decision making such as N fixing and mycorrhizal amendments or tests for pathogens and pests. |
Test 41. Community profiling
| Name of test | Community profiling |
Description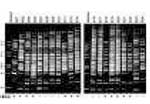 | Taxonomic or functional groups of soil microorganisms can be targeted by direct DNA extraction from soil. Molecular techniques such as denaturing gradient gel electrophoresis (DGGE) or terminal restriction fragment length polymorphism (TRFLP) analysis can be used to generate a community profile or “fingerprint” for an entire specific microbial population or community in the soil. Useful to compare soil microbes at the semi-quantitative community level in response to management practices. |
| Method reference | Kennedy et al. (2004) |
| Complexity | Complex techniques -specialist knowledge required to carry out molecular techniques. Knowledge of statistical tools essential. |
| Technology | Requires specialist equipment/facilities. |
| Cost and time | Moderate expense and reasonably quick – some time spent on data analysis. |
| Interpretation | No benchmarks in place to relate community changes to soil health – however very good for paddock to paddock or within paddock comparisons and can be used to give a regional perspective – also useful for trials. |
| Decision | Potential to be used for in paddock decision making but probably still a little too expensive for general use as a soil health indicator. Will become cheaper sooner rather than later. |
Test 42. Microarrays
| Name of test | Microarrays |
Description | Using microarrays the entire suite of taxonomic and/or functional variation within microorganism communities from soil can be targeted. Useful for determining differential gene expression and as such can be used to determine if particular genes (representing taxonomic groups or functional processes) are up or down regulated between management practices, soil types, climatic regions etc. |
| Method reference | Sessitsch et al. (2006) |
| Complexity | Very complex techniques -specialist knowledge required. |
| Technology | Requires specialist equipment/facilities and computer software for data analysis. |
| Cost and time | Expensive but reasonably quick. Data analysis is time consuming. |
| Interpretation | No benchmarks in place to relate differential gene expression to soil health – however very good for paddock to paddock or within paddock comparisons and can be used to give a regional perspective. |
| Decision | Offers great potential to be useful for in paddock decision making but a research tool at this stage. At this point too expensive for use as soil health indicator. Will become cheaper with time. |
Appendix 5. Testing for soil-borne pests and diseases
Pest test 1. PreDicta B/Plant bioassay tests and management response for Take All
| Disease | Take All |
| Crops affected | Wheat, barley, oats |
| Assessment methods | PreDicta B is a commercially available assessment method and cost between $250.00 and $300.00. Plant bioassay is another form of commercial assessment method used and can vary in price depending on numbers and time required to do the test. Inspection of crops during the growing season is also advised (refer Pest test 5). |
| Easy or complexity of assessment method | PreDicta B -Moderately Complex: a straight forward commercial test and the sampling can be taken by anyone but it is mainly done by the agent providing the service who will then send if off to the laboratory. Because of the cost it is mainly used on paddocks that are to be sown to high value crops or paddocks that are already suspected of the disease to confirm these observations. Plant bioassay -Moderately Complex: for growers the only complexity in plant bioassay is correct sampling and handling of the soil sample. For the company it can be time consuming and if not conducted correctly can provide false results. Issues are things such as temperature control, soil moisture levels, soil sampling procedure and a large enough sample size to represent the population. Therefore it needs to be done by professionals. |
| Threshold | Acceptable yield loss levels will depend on individuals but it has been noted that up 25% yield loss can occur without white heads (dead head) being observed. White heads are when the plant produces a dead seed head with no grain and are white coloured. Low level in one season can easily increase to high infection levels in the next year if susceptible plants are allowed to grow over the summer/autumn period. |
| Treatment | Rotation with pulses or oilseeds and the removal in these crops of volunteer cereal crop and grasses as well in the summer months will decrease the build up of disease. Some seed dressing will assist. Good plant nutrition particularly for trace elements and more directly zinc will help plants grow through the disease zone. Early sowing of known infected paddocks encourages the best growing conditions for the plant root system. Cultivation a few weeks before sowing will break up the disease mass and decrease it to a level that may not have a visual impact on the crop. |
| Implication of treatment | In low rainfall areas the use of pulse crops or oilseeds may not be viable as they may not produce a commercial yield except in good rainfall years. The use of less susceptible cereals such as oats along with good nutrition may be a better commercial option. A complete cultivation to break up the fungi may decrease the disease but it will also remove beneficial soil biota including those that may feed on the fungi or protect the plant roots. It has been noted that beneficial biota take longer to build up to levels that have an affect on the disease. A narrow deep cultivation with the seeding boot combined with good nutrition will hold the disease at bay and allow build up of more beneficial biota. |
| Comments | In direct drilled paddocks; weed control, good nutrition, and some in row disturbance at sowing will help to control Take All. For growers that use precision agriculture seeders the sowing of the new crop in between the rows of last year’s crop will put the seed in to soil with less disease burden. Take All is an issue in crops that have poor growth which can be due to nutrition or soil temperature. Soil pH influence Take All levels and in acid soils the application of lime to increase soil pH may increase the incidents of Take All. |
| Availability | Commercial test services available from the South Australian Research and Development Institute (2009). |
Pest test 2. PreDicta B/Plant bioassay tests and response for Cereal Cyst Nematodes (CCN)
| Disease | Cereal Cyst Nematodes (CCN) |
| Crops affected | Wheat, barley, oats |
| Assessment methods | PreDicta B is a commercially available assessment method and cost between $250.00 and $300.00. Plant bioassay is another form of commercial assessment method used and can vary in price depending on numbers and time required to do the test. Inspection of crops during the growing season is also advised (refer Pest test 5). |
| Easy or complexity of assessment method | PreDicta B -Moderately Complex: a straight forward commercial test and the sampling can be taken by anyone but it is manly done by the agent providing the service who will then send if off to the laboratory. Because of the cost it is mainly used on paddocks that are to be sown to high value crops or paddocks that are already suspected of the disease to confirm these observations. Plant bioassay -Moderately Complex: for growers the only complexity in plant bioassay is correct sampling and handling of the soil sample. For the company it can be time consuming and if not conducted correctly can provide false results. Issues are things such as temperature control, soil moisture levels, soil sampling procedure and a large enough sample size to represent the population. Therefore it needs to be done by professionals. |
| Threshold | An overall paddock plant infection that cause 5% or high yield loss would make any action that keeps the impact below this level cost affective in most cases. |
| Treatment | The most cost affective treatment is to use resistant cereal varieties. Rotation with pulses or oilseeds and removal of volunteer cereal and grasses that build up levels over summer months. Cultivation of the paddock is also recommended. Early sowing of the crop with good nutrition will allow the crop to get roots down below the affected areas before eggs hatch. |
| Implication of treatment | In low rainfall areas the use of pulse crops or oilseeds may not be viable due to low yield in low rainfall years but the use of resistant cereals will help break the cycle. Cultivation will control host plants but will only spread the egg sacks and damage other soil biota. |
| Comments | In direct drilled paddocks; weed control, the use of resistant variety and some in row disturbance at sowing will help with CCN. For the growers with precision agriculture seeders the sowing of the new crop in between the rows of last years crop will put the seed in to soil with less disease burden. CCN is less of an issue than it was in the 80’s and 90’s because of the varieties used and better weed control that exist now. |
| Availability | Commercial test services available from the South Australian Research and Development Institute (2009). |
Pest test 3. PreDicta B/Plant bioassay tests and response for Rhizoctonia
| Disease | Rhizoctonia |
| Crops affected | Wheat, barley, oats, triticale, canola, faba bean, lentils, lupins |
| Assessment methods | PreDicta B is a commercially available assessment method and cost between $250.00 and $300.00. Plant bioassay is another form of commercial assessment method used and can vary in price depending on numbers and time required to do the test. Inspection of crops during the growing season is also advised (refer Pest test 5). |
| Easy or complexity of assessment method | PreDicta B -Moderately Complex: a straight forward commercial test and the sampling can be taken by anyone but it is manly done by the agent providing the service who will then send if off to the laboratory. Because of the cost it is mainly used on paddocks that are to be sown to high value crops or paddocks that are already suspected of the disease to confirm these observations. Plant bioassay -Moderately Complex: for growers the only complexity in plant bioassay is correct sampling and handling of the soil sample. For the company it can be time consuming and if not conducted correctly can provide false results. Issues are things such as temperature control, soil moisture levels, soil sampling procedure and a large enough sample size to represent the population. Therefore it needs to be done by professionals |
| Threshold | This is what ever level has an economics impact on the crop, 5% or above would start to have an impact. Farmers need to be aware that low levels in one season can be very high in the next if no steps are taken. |
| Treatment | Soil disturbance through the disease layer a few weeks after the autumn break and few weeks before sowing. Good nutrition, the application of zinc at sowing, the control of all green material before sowing and avoid using sulfonylurea herbicides, as it is know to slow crop root growth giving Rhizoctonia more time to attack. Early sowing in to infected paddocks to allow best conditions for growth of the plants root system. |
| Implication of treatment | A complete cultivation to break up the fungi may decrease the disease but it will also remove beneficial soil biota including those that may feed on the fungi or protect the plant roots. It has been noted that beneficial biota take longer to build up to levels that have an affect on the disease. A narrow deep cultivation with the seeding boot combined with good nutrition will hold the disease at bay and allow build up of more beneficial biota. |
| Comments | It has been observed that where soil biota is able to build up to a good level, control of Rhizoctonia. For the growers with precision agriculture seeders the sowing of the new crop in between last years rows will put the seed in to soil with less disease burden. |
| Availability | Commercial test services available from the South Australian Research and Development Institute (2009). |
Pest test 4. PreDicta B/Plant bioassay tests and response for Crown Rot
| Disease | Crown Rot |
| Crops affected | Wheat, barley, triticale |
| Assessment methods | PreDicta B is a commercially available assessment method and cost between $250.00 and $300.00. Plant bioassay is another form of commercial assessment method used and can vary in price depending on numbers and time required to do the test. Inspection of crops during the growing season is also advised (refer Pest test 5). |
| Easy or complexity of assessment method | PreDicta B -Moderately Complex: a straight forward commercial test and the sampling can be taken by anyone but it is manly done by the agent providing the service who will then send if off to the laboratory. Because of the cost it is mainly used on paddocks that are to be sown to high value crops or paddocks that are already suspected of the disease to confirm these observations. Plant bioassay -Moderately Complex: for growers the only complexity in plant bioassay is correct sampling and handling of the soil sample. For the company it can be time consuming and if not conducted correctly can provide false results. Issues are things such as temperature control, soil moisture levels, soil sampling procedure and a large enough sample size to represent the population. Therefore it needs to be done by professionals. |
| Threshold | This is what ever level that has an economic impact on the crop, 5% or above would start to have an impact. |
| Treatment | Rotation with Oats, pulses, oilseeds or wheat that have some level of resistance. Removal of volunteer crop and grasses that build up levels over seasons. Removal of the stubble by burning or burial to help break down infected stubble (burial may just spread the infected straw over more of the paddock). |
| Implication of treatment | The removal of stubble by burning would impact on the food supply for soil biota and cultivation would kill off biota as well. This decrees in biota would lower the potential number of predators and competitors for the crown rot. |
| Comments | In direct drilled paddocks; weed control, the rotation with Oats, pulses or Oilseeds. For the growers with precision agriculture seeders the sowing of the new crop in between last years rows will put the seed in to soil with less disease burden. |
| Availability | Commercial test services available from the South Australian Research and Development Institute (2009). |
Pest test 5. Field inspection for Take All, Cereal Cyst Nematodes, Rhizoctonia and Crown Rot
| Disease | Take All, Cereal Cyst Nematodes (CCN), Rhizoctonia and Crown Rot (Fusarium spp.) |
| Crops affected | Take All – wheat, barley, oats CCN – wheat, barley, oats Rhizoctonia – wheat, barley, oats, triticale, canola, faba bean, lentils, lupins Crown Rot – wheat, barley, triticale. A particularly chronic disease in wheat in Australia. |
| Assessment methods | Inspection of crops during the growing season with inspection of both the above and below ground material for impact from the disease. This is best conducted with knowledge of the life cycle and the triggers which may increase populations. |
| Easy or complexity of assessment method | Easy: aim is to look for abnormal plants during growing season. The plants taken for inspection must not be damaged in a way that removes the affected areas e.g. damaging the roots. Having the correct diagnosis of the disease is important and is best done by someone who is experienced. |
| Threshold | Refer to Pest Test 1, 2, 3 and 4 for further information regarding the Thresholds for Take All, CCN, Rhizoctonia and Crown Rot. |
| Treatment | Refer to Pest Test 1, 2, 3 and 4 for further information regarding the Treatments for Take All, CCN, Rhizoctonia and Crown Rot. |
| Reference | Department of Primary Industries Victoria (2009b); Wallwork (2000) |
Pest test 6. Field collection of Armyworms and Cutworms
| Disease | Common armyworm, Common Cutworm (Bogong moth) and Brown Cutworm |
| Crops affected | All crops and pastures are impacted to some degree by these insects |
| Assessment methods | Sweep net Plant and ground search Shaking of plants over tarp or tray Insect traps |
| Easy or complexity of assessment method | The first three practices can be conducted by untrained persons. The issue is making sure that a good representation of the crop is inspected and it is done at the most suitable time of the day. In the heat of the day some insects will leave the plant to hide in the soil or condition may not be suitable for hatching to have occurred. Identification can use carried out using guides or books on the topic or through professional services. The insect traps can also be set up by anyone if they have access to them. Some organisations will run a group of traps in an area to provide the region with information as to numbers of insects flying in. The traps on report what adults are in an area and lying eggs, knowing when these eggs will hatch and therefore when to commence monitoring is the key. |
| Threshold | Common Army worm two large caterpillars per meter square and 2 per ½ meter squire for the other two. The stage that the crop is at must also be taken into count. |
| Treatment | Most common control is insecticides. |
| Implication of treatment | Good contact with the target insect is need or re-infestation will occur. Most insecticides will have a withholding period and deaths of off target insect may occur which may include those that are feeding on these or other pest. |
| Comments | Areas that have large clods or trash cover provide good protection for these insects. Predatory insects in the soil will have a impact on them. |
| Reference | Henry and Bellati (2008). |
Pest test 7. Field inspection for Cockchafers
| Disease | Black headed (BH) pasture cockchafer, Redheaded(RH) pasture cockchafer |
| Crops affected | Cereals and pastures |
| Assessment methods | Pre-sowing and after autumn break inspection of 1 shovel of soil to the depth of 10 cm over 5 to 10 sites |
| Easy or complexity of assessment method | Simple anyone can do it. The use of a sieve to remove the soil would help. More expert advice is needed here as BH and RH pasture cockchafters are very different in terms of assessment and control. |
| Threshold | 150-200 BH larvae per square meter and none for the RH |
| Treatment | Insecticides will work on the BH but are ineffective on the RH as it does not come to the surface to feed. The most common control for RH and BH is cultivation which destroys tunnels and exposes the cockchafer to predators. Planting to non susceptible crops will decrease numbers |
| Implication of treatment | As the pasture cockchafers most commonly occur in heavier soil and medium to high rainfall any cultivation needs to occur when there is less likelihood of soil compact occurring. |
| Comments | The RH occurs more commonly in areas where rainfall is greater than 500mm. Population numbers are usually high before they are detected. Both RH and BH are not very common in the northern Mallee sand soils. They are most common in cereals following a pasture phase. Farms that still have a pasture phase are more likely to have occurrences of this insect. Predatory insects in the soil will have an impact on them |
| Reference | Henry and Bellati (2008) |
Pest test 8. Field inspection for Pasture Webworm
| Disease | Pasture webworm |
| Crops affected | Cereals and pastures |
| Assessment methods | Inspect seedling in a 1 square meter area in 5 to 10 locations in the paddock. Timing is important early morning and late afternoon are best, never on bright sun days |
| Easy or complexity of assessment method | Inspection is not hard as long as the person can get down to the ground and is skilled at identifying the insect. |
| Threshold | 10 damaged plants per square meter in Victoria |
| Treatment | The removal of grasses will make the area less attractive to egg laying females. Insecticides can be used. Grow oats in affected paddocks as they are unaffected by the insect. |
| Implication of treatment | Insecticides may affect beneficial insect living in the soil |
| Comments | Farms that still have a pasture phase are more likely to have occurrences of this insect. Predatory insects in the soil will have a impact on them |
| Reference | Henry and Bellati (2008) |
Pest test 9. Field trapping and inspection for Slug infestation
| Disease | Slug |
| Crops affected | Canola and pasture |
| Assessment methods | Shelter traps such as a hessian bag laid on the soil or other material |
| Easy or complexity of assessment method | Simple as long as the trap excludes all light and are placed around sufficient locations in the paddock |
| Threshold | Non recommended but early control will prevent damage to growing crops |
| Treatment | Baiting and the removal of ground cover over summer. |
| Implication of treatment | Removal of ground cover may mean the loss of organic matter. Baits have to be used in accordance with the recommendations and regulations` for use of these baits |
| Comments | Slugs are more of an issue in the medium to high rainfall areas of Victoria |
| Reference | Micic and Henry (2007) |
© State of Victoria (Agriculture Victoria) 1996 - 2025.

This work, Victorian Resources Online, is licensed under a Creative Commons Attribution 4.0 licence. You are free to re-use the work under that licence, on the condition that you credit the State of Victoria (Agriculture Victoria) as author, indicate if changes were made and comply with the other licence terms.
The licence does not apply to ‘branding’ or some ‘images or photographs’ that may be owned by third parties. We ask you to seek prior approval to use images using the VRO feedback form. Access to higher quality images can also be provided on request.
This page was last updated on 23/03/2020.