
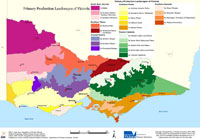
Primary Production Landscapes of Victoria
Land Use, Soils and Climate | Understanding Regional Differences | Victoria's Changing Climate | Geomorphology Land Use and Victoria's Bioregions | What Impacts Will The Project Have? | Contact | Publications

Land Use, Soils and Climate
| The Victorian landscape exhibits a rich variety of terrestrial ecosystems. This variety is a result of diverse terrain (from the mountains to the plains), climate (alpine to semi-arid), geology and soils. Over the last fifty years land use practices have become relatively finely-tuned to this diversity of climate and soil. Although climate over that period has been highly variable with respect to droughts, good years and wet years, models of the future climate are showing a general shift to drier and hotter conditions. |
There are many important questions for the future of Victorian agriculture and its adaptation to changing climatic conditions. For example:
- How might this predicted climate change affect the current distribution of land use?
- Will practices within a particular land use have to change?
- Will some land uses become less competitive or unprofitable?
- How will soils and soil management be affected?
Understanding regional differences
Because farming systems, practices and productivity are different in different parts of the state, answers to these questions will differ according to the land use and where it is placed in Victoria. A regional approach to analysis of these different situations is needed. This will assist in providing regionally relevant scenarios and advice. Soil and landscape data, land use maps, the climatic record, and regional experience of agronomists and land managers have been used to define Victoria’s major ‘Primary Production Landscapes’ (PPL). Past approaches to mapping Victoria’s landscapes include land systems and the Victorian Geomorphology Framework (VGF). Regional location, physiographic divisions (incorporating terrain and geomorphology) and major soil types were used to delineate PPLs. These PPLs were characterised for dominant soil types and associated inherent management issues. PPLs were also described by major agricultural industries and practices that occur within them. Statewide maps for key climatic variables including temperature, rainfall and growing season rainfall were used to provide context for predicted changes in climate across the PPLs. Mapped PPLs and descriptions were reviewed by regional industry experts (grazing – meat and wool, cropping, dairy and forestry) and primary producers to gather information on:
- The dominant land use practices specific to the PPLs.
- Pressures on the industry or practices within the last ten drier years.
- Competition to particular enterprises from alternative land uses.
- Prognosis for the industry under the predicted climate scenarios
Victoria’s Changing Climate
The key climatic variables considered are: annual average temperature, annual average rainfall, and cumulative rainfall minus evaporation. All historical data is part of the SILO climate data sourced from the Department of Natural Resources and Mines Queensland.
Projected values for 2050 are based on those derived for the DPI Victoria Climate Change Adaptation Program Project. These are based on the global Greenhouse Gases (GHG) emissions scenarios, as reported in the IPCC Special Report on Emissions Scenarios – SRES (Nakicenovic and Swart. 2000).
In the SRES notation, "A" and "B" represent little and high commitment to sustainable development while "1" and "2" represent regional integration and segregation. The A1FI scenario model represents a rapid economic growth scenario with little commitment to sustainable development (A1) with the technological change in the energy system with an emphasis on fossil fuels (FI).
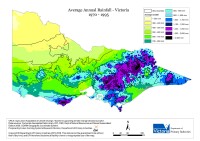
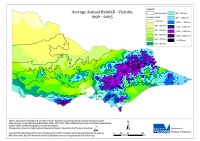
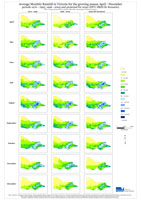
Rainfall
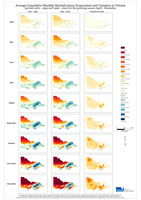
The average annual rainfall, in millimetres (mm), has been derived from the average daily rainfall for each month for the period 1957 - 2005. This daily rainfall has been multiplied by the total number of days for that month, with the figure of 28.3 used for the month of February, thus incorporating three leap years. The rainfall figures for the 12 months are added together to obtain the total average rainfall volume for that period. The average annual rainfall periods derived include 1970-1995, 1996-2005 and the 2050 predicted values.
2050 A1FI Prediction 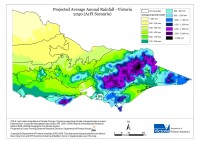 Projected Average Annual Rainfall - Victoria 2050 (A1FI Scenario) |
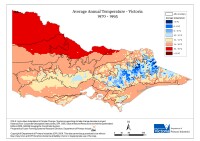
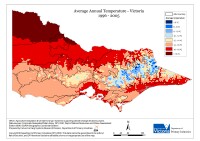
Temperature
The average annual temperature, in degree Celcius (ºC), has been derived from the monthly minimum and maximum temperatures for the period 1970 - 2005. For each month the minimum and maximum temperature range has been measured. By adding these together and dividing them by 24 (there are 12 minimum and 12 maximum levels), the average annual temperature can be calculated. The average annual temperature periods derived include 1970-1995, 1996-2005 and the 2050 predicted values.
2050 A1FI Prediction 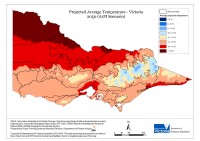 Projected Average Temperature - Victoria 2050 (A1FI) |
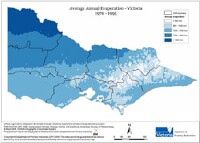
Evaporation
The average annual evaporation has been derived from the average daily evaporation for that period. This daily evaporation has been multiplied by the total number of days for that month, with the figure of 28.3 used for the month of February, thus incorporating three leap years. The 12 resulting figures are added together to get the average annual evaporation for the period. The average annual evaporation periods derived include 1970-1995, 1996-2005 and the 2050 predicted values.
1996 - 2005 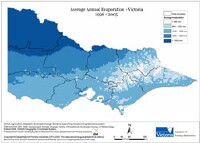 Annual Evaporation - Victoria 1996 - 2005 |
Rainfall Evaporation
The average cumulative rainfall for April to December has been derived from the average monthly rainfall for the period 1957 – 2005, minus the average cumulative evaporation for April to December from the average monthly rainfall for the period 1957 – 2005. The average cumulative rainfall minus evaporation periods derived include 1970-1995 and 1996-2005.
1970-1995 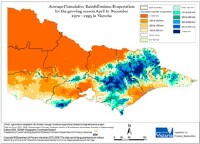 Annual Rainfall Evaporation 1970 -1995 | 1996 - 2005 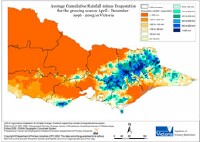 Average Rainfall Evaporation 1996 - 2005 |
Geomorphology, Land Use and Victoria's Bioregions
The map provided shows the Geomorphology of Victoria classified in 8 categories (zones), each comprising various geomorphological units. The units provide a framework that helps us to understand the vegetation type distribution as well as the soil type distribution and hence has some bearing on natural habitat distribution for fauna and flora. Further details are provided in Geomorphology Framework of Victoria on VRO. .
Landuse in Victoria
Geomorphology
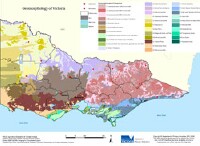
Geomorphology of Victoria
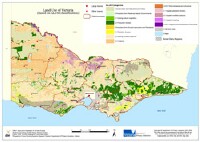
Land Use
The land use map for Victoria is based on the Australian Land Use and Management (ALUM) Classification. Five primary levels of land use are distinguished in order of increasing levels of intervention or potential impact on natural landscape systems. Water is also included in the classification as a sixth primary class because of its importance for natural resources management. The classification has a three-tiered hierarchical structure. Secondary classes represented include land management or practice variants.
Soils
Victoria’s Primary Production Landscapes have been described and characterised for dominant soil types (classified according to Isbell (2002) and Northcote (1979)) and distribution within the PPL. Soil descriptions are also provided with key physical properties identified. Landform descriptions have been collated for these descriptions from those of the VGF. Management issues (constraints) have been assessed for potential impact upon production capacity using a traffic light approach:
- Red = significant management constraint limiting production capacity.
- Amber = a management constraint that may limit production capacity.
- Green = not considered a serious soil constraint to production.
Representative soil reference sites have been identified for many of the PPLs and can be accessed via clicking links located on the map.
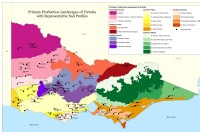
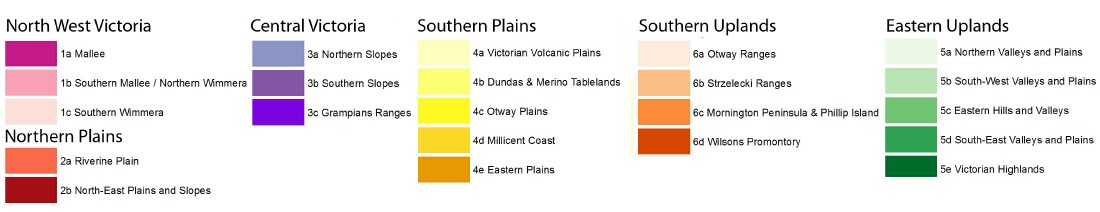
Primary Production Landscapes of Victoria with representative Soil Profiles
Primary Production Landscapes of Victoria - Soils
- North West Victoria soils
- Northern Plains soils
- Central Victoria soils
- Southern Plains soils
- Eastern Uplands soils
- Southern Uplands soils
What Impacts Will The Project Have?
This project has developed an approach that is unique to Victoria and Australia that encapsulates information on landforms, soils, farming systems, management practices and future climate predictions. Understanding the agricultural capability for production as well as potential impacts on the displacement and redundancy of infrastructure for land-uses remains a challenge for NRM managers, planners and policy makers. This spatial hierarchy defines a regional platform for targeted investment to explore climate change and variability impacts upon agricultural industries.
Contact
Further information can be obtained using the VRO Feedback form.
Publications
To view the information PDF requires the use of a PDF reader. This can be installed for free from the Adobe website (external link).
 | (PDF 204KB) |
 | (PDF 226KB) |
Access to spatial data
A spatial dataset of Primary Production Landscapes (PPL) of Victoria (DOI 10.4226/92/58e72567b7d51) is freely available through the DataVic website.
© State of Victoria (Agriculture Victoria) 1996 - 2025.

This work, Victorian Resources Online, is licensed under a Creative Commons Attribution 4.0 licence. You are free to re-use the work under that licence, on the condition that you credit the State of Victoria (Agriculture Victoria) as author, indicate if changes were made and comply with the other licence terms.
The licence does not apply to ‘branding’ or some ‘images or photographs’ that may be owned by third parties. We ask you to seek prior approval to use images using the VRO feedback form. Access to higher quality images can also be provided on request.
This page was last updated on 23/03/2020.