
Mapping soil salinity using hyperspectral imagery
| Despite considerable expenditure of public and private funds (the Victorian Auditor General estimated $1.8 billion over the period 1990-2001 ) we still do not have a reliable measure of the outcome of our salinity management program. The location, size and intensity of soil salinity has been accepted as a significant environmental indicator at Federal level and would also provide a valuable tool for reporting against Victorian Government Outcomes such as Matters for Targets, Growing Victoria Together (GVT), the Environemntal Sustainable Framework (ESF) and Department of Sustainability and Environment (DSE) (external links) outcomes. Current field based methods are considered to be too expensive and labour intensive to implement at a state wide level. | 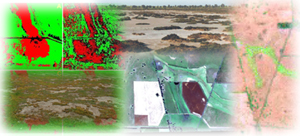 |
| Airborne and satellite based multi-spectral sensors have been advocated as technologies for reducing the cost of field based measurement of soil salinity. However, they are limited spectrally and spatially (Landsat 7 for example has 6 bands in the visible to mid-infrared region ranging from 60 to 250 nm wide with 30 metre pixels). and it is unlikely that such data will ever successfully map vegetation down to a genera or species level. Instead, methodologies using multi-spectral data tend to rely on surrogate indicators of soil salinity such as mapping areas of consistently poor growth. This approach works well in some environments, but is likely to be limited in moderately and slightly saline areas where salt tolerant species can still thrive and maintain good ground cover. | |
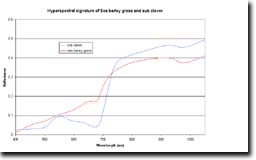 Hyperspectral signature of Sea Barley Grass and Sub-clover (PDF 20KB) To view the information PDF requires the use of a PDF reader. This can be installed for free from the Adobe website (external link). | In contrast, hyperspectral sensors with over 100 spectral bands have a much greater ability to differentiate vegetation down to genera and in some cases species level. The Australian designed HyMap sensor has 126 bands in the region between 450 nm to 2500 nm width band width varying between 15 and 20 nm and 3 metre pixels. These sensors have the potential to significantly reduce the cost of mapping and monitoring the extent and severity of soil salinity based on the presence of salt tolerant species while maintaining the accuracy of the current field based method. The National Action Plan (NAP) (external link) funded a project to investigate whether it was possible to discriminate between salt-tolerant and salt-sensitive species based on their reflectance spectra. An ASD FieldSpec handheld spectrometer was used to measure reflectance in the visible and near-infrared part of the spectrum. Plant samples from around 16 species were collected three times through the summer and taken back to a laboratory where reflectance measurements were made under controlled lighting. Results were promising, with the ability to correctly identify the target species ranging from 88% to 95% accuracy. |
Following this preliminary research, Agriculture Development and DSE co-funded a project to investigate whether this approach could be scaled up to use data collected from an airborne hyperspectral scanner where reflectance is attenuated by atmospheric affects and each pixel is likely to contain a mixture of targets. Hymap data was collected over salt affected sites on the basalt plains north of Hamilton in mid December 2004 and field data was collected on the ground in Spring 2005.
A variety of reference spectra for soils and salt-tolerant and salt-sensitive vegetation were developed from both image data and laboratory spectral measurements and tested in combination with whole pixel and sub-pixel classification algorithms. Image data was resampled to simulate differing spatial resolutions and assess the effect this spatially degraded data had on classification accuracy. Significant results were achieved, with several techniques producing accuracies around 80% for mapping the extent of salt affected soil. The best algorithm using the original HyMap data with 3 metre pixels produced an accuracy of 85% for mapping saline soil, 92% for non-saline soil with an overall accuracy of 89%.
A report has been produced documenting the accuracy attained by each combination of classification algorithm, reference spectra and different spatial resolutions for the hyperspectral image data. It discusses the strengths and weaknesses of the various classification algorithms and methods for generating reference spectra and goes on to document a preferred methodology for mapping the extent of soil salinity using hyperspectral data. It also comments on current limitations of hyperspectral data and associated analytical techniques, the appropriate spatial resolution for mapping soil salinity and other potential applications for this technology.
In the course of this project, several issues that currently limit the implementation of this technology at a larger scale were identified, the prime impediment being the ability to calibrate individual airborne hyperspectral swathes to allow mosaicing of multiple swathes into a single coherent image. This step is essential for landscape scale applications while hyperspectral imagery is captured from an airborne rather than satellite platform and it is the next question that needs to be resolved.
This work is being carried out by scientists from PIRVic based in Bendigo and Tatura.
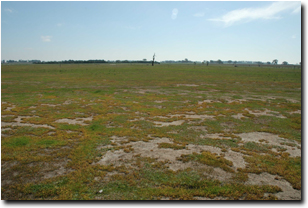 Salinity typical in our project area near Hamilton. The point being that it is more diffivcult to map the salinity in the Hamilton area because the contrast between saline and non-saline is not nearly so dramatic. |  | 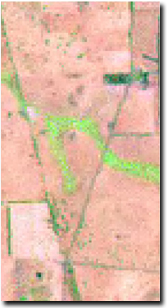 |
Same part of the Hamilton site. The aim here is to highlight the difference in spatial resolution. Landsat has 25 m pixels and hymap has 3 m pixels. | ||
© State of Victoria (Agriculture Victoria) 1996 - .

This work, Victorian Resources Online, is licensed under a Creative Commons Attribution 4.0 licence. You are free to re-use the work under that licence, on the condition that you credit the State of Victoria (Agriculture Victoria) as author, indicate if changes were made and comply with the other licence terms.
The licence does not apply to ‘branding’ or some ‘images or photographs’ that may be owned by third parties. We ask you to seek prior approval to use images using the VRO feedback form. Access to higher quality images can also be provided on request.
This page was last updated on .