
IrriGate newsletter, Issue 3 autumn 2010
Download the PDF version of this document: Irrigate Newsletter - Issue 3 - Autumn 2010 (PDF 270 KB)
To view the information PDF requires the use of a PDF reader. This can be installed for free from the Adobe website (external link).
Sustainable Irrigated Landscapes - North East - Mid and Upper Goulburn Broken

Welcome to the autumn issue of IrriGate
Inside this issue
Irrigation efficiency performance - Drip | Australian Irrigation Conference | Sustainable Irrigated Landscapes Rebates | Irrigation efficiency performance - Travelling Irrigator | WTC 2010 Irrigation Expo | On-farm Efficiency Program Update | Contact Details
We are updating our address database - RMB numbers are no longer satisfactory and where properties have changed hands we do not have current or the correct information, so please check your envelope details and contact me with any changes.
Wendy Paglia - Editor
Telephone (03) 5731 1206 or wendy.paglia@dpi.vic.gov.au .
Vineyard irrigation efficiency performance
Checking the performance of your vineyard’s irrigation system can provide some useful insights or provide you some peace of mind. If you want to make your irrigation work for you it is important to confirm it is performing at an adequate level. An irrigation meter can indicate four megalitres per hectare (ML/ha) was applied, but doesn't indicate it was applied uniformly across the vineyard. Some vines could be getting fed by drippers supplying 10 litres per hour while others are only get two litres per hour, resulting in some plants becoming waterlogged, while other plants in the same vineyard are moisture stressed.
This can be checked by measuring the flow rate of emitters at a number of locations across the vineyard and checking the ‘distribution’ or ‘dripper uniformity’. The example below (Figure 1) is where we measured this on a seven hectare (Ha) north east Victoria vineyard, irrigated with inline drippers. The flow rate of 64 drippers was measured across the block with the following results.
The distribution uniformity was measured at 86 per cent, which is above the 75 per cent level considered adequate, a new system should be operating at 85 per cent or greater. The dripper uniformity in this case provides confidence to the vineyard manager that the vast majority of the vines are getting the same amount of water. In this example the measurements were taken one step further by noting where in the vineyard the measurements were taken, so the map in Figure 2 can be produced to identify where across the vineyard the high or low water application is likely to occur. This allows the vineyard manager to map where the water is being applied and it can also be used to ensure soil moisture monitoring equipment is installed in a representative area of the vineyard. If you are interested in analysing your system or would like more information please contact a team member, contact details are on the back of the newsletter. |  Figure 1: Dripper flow rates from lowest to highest  Figure 2: Dripper uniformity contour map, showing areas likely to get higher or lower amounts of water |
One water many futures Australian Irrigation Conference and Exhibition
One water many futures Australian Irrigation Conference and Exhibition is being help between 8 -10 June 2010 at the Sydney Exhibition Centre
Further information on the website http://www.irrigationaustralia.com.au (external link).
Sustainable Irrigated Landscapes Rebates
Sustainable Irrigated Landscapes (SIL) in North East Victoria have rebates available to landholders for the purchase of soil moisture monitoring equipment or improved farm irrigation plans. The rebates include a 50 per cent return of costs up to a maximum of $4,000. Soil moisture equipment is gaining in popularity for its ability to fine tune and monitor irrigation programs. For further information please contact a SIL team member, contact details are on the back page.
| Producers that have benefited from the rebate and installed some soil moisture monitoring equipment to improve their irrigation management include Rostrevor Hop Gardens, Chestnut, strawberry runner growers and several beef and dairy producers. TAFCO Rural Supplies have also used the rebates on behalf of North East Catchment landholders to recently purchase six weather stations. One each located at Kiewa, King and Beechworth and three in the Ovens region. The weather stations monitor conditions such as: evaporation; rainfall; wind speed and direction; humidity and frost. This information will be provided on the internet providing information for all landholders in the area. | 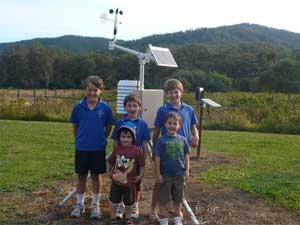 The weather station on the Caponecchia property at Buffalo River. Back left: Connor, Damian and Fletcher. Front: Luca and Nathan. |
Calculating the distribution uniformity of a travelling irrigator
A poor distribution uniformity can result in reduced pasture yields or the need for high applications of water.
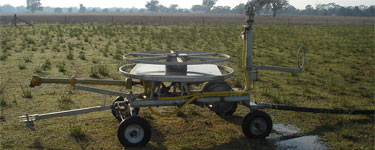
Figure 4: The travelling irrigator assessed
| The distribution pattern of the travelling irrigator shown in Figure 4 was assessed under minimal wind conditions. It throws water to a radius of 37.5 metres (m) applying an average application rate of 15 millilitres (mm), with a distribution pattern shown in Figure 5. A distribution uniformity (DU) to aim for is greater than 75 per cent. This travelling irrigator is operating at a distribution uniformity level of 62 per cent without any `overlap. To improve this distribution uniformity some overlap should occur. |  Figure 5: The distribution pattern of the system DU 62 per cent |
| Current operation:This travelling irrigation system is currently operated by two runs down a paddock creating a 22 m overlap in the middle and none on the edges as shown in Figure 6. This increased the average application rate to 18 millilitres, but only increased the distribution uniformity to 64 per cent. |  Figure 6: The current operation with an overlap of 22 m in the middle DU 64 per cent |
| An improved operation: A better option to improve the distribution uniformity of this travelling irrigator is to introduce a third run. In this case, to keep within the paddock boundaries a half throw could be run along the edges of the paddock and then a run straight up the middle, providing an overlap of 12.5 m. This maintains the average application at 18 mm but increases the distribution uniformity to a very respectable 84 per cent. (Figure 7). It should be noted this set up will increase the labour required by adding an extra shift. If you are interested in analysing your system contact one of the team members on the back of the newsletter. |  Figure 7: The current operation with an overlap of 12.5 m DU 84 per cent |
| Affect of wind: A frequent comment with travelling irrigators is the affect of wind and how this really changes the distribution uniformity. This same travelling irrigator (Figure 1) was tested during windy conditions. The average wind speed during this assessment was 20 kilometres an hour (km/hr), classified as moderate breeze, with average gusts up to 32 km/hr. The affect of the wind dropped the distribution uniformity to 20 per cent. The average application rate on the down wind side was 17 mm, while up wind the average was eight mm (Figure 8). |  Figure 8: The affect of a 20 km/hr wind on the distribution uniformity of a travelling irrigator |
WTC 2010 Irrigation Expo
A Water Technology Cluster event to showcase irrigation industry innovation to industry and landholders being held at Echuca Racecourse between 10am to 4pm on 19 and 20 May, 2010
Further information may be obtained by visiting their website http://watertechnologycluster.com.au (external link) or contact Wendy Buck, Expo Chairperson 0438 052 630, email: expo@misg.com.au
Is your flood irrigation in need of upgrading?
The Goulburn Broken Catchment Management Authority has gained funding through the Federal government On Farm Irrigation Efficiency Program, see table below, this is available to irrigators in this region.
The funding available is for improvements to flood irrigation through activities such as laser levelling, installing re-use dams etc. The funding is not available for converting flood irrigation to spray irrigation.
Irrigators need to be on a regulated river and there is a requirement to give up some of the savings achieved.
For further information please contact Dennis Watson
Federal Government update: On Farm Irrigation Efficiency Program
| Successful Applicants that received in-principle approval to proceed to stage 2 under the On-Farm Irrigation Efficiency Program – Round 1. | State | Potential number of Irrigator sub-projects | Funding ($) |
| Australian Processing Tomato Research Council Inc. | VIC/NSW | 22 | $11,710,000 |
| South Australian Murray-Darling Basin Natural Resource Management Board | SA | 21 | $1,659,000 |
| Lachlan Catchment Management Authority | NSW | 46 | $3,846,000 |
| Ricegrowers Association of Australia Inc. | NSW | 52 | $24,179,000 |
| Murray Irrigation Limited | NSW | 124 | $32,786,000 |
| Goulburn Broken Catchment Management Authority | VIC | 291 | $25,820,000 |
Contact Us
| Dennis Watson Irrigation specialist DPI Rutherglen Centre (02) 6030 4567 0429 304 567 dennis.watson@dpi.vic.gov.au |  Dennis Watson |
| Ian Gamble Catchment Management Officer DPI Wangaratta Centre (03) 5723 8671 0437 362 620 ian.gamble@dpi.vic.gov.au |  Ian Gamble |
| John Hunter Catchment Management Officer DPI Benalla Centre (03) 5761 1664 0419 363 572 john.hunter@dpi.vic.gov.au |  John Hunter |
| Wendy Paglia Project Support Officer DPI Ovens Centre (03) 5731 1206 wendy.paglia@dpi.vic.gov.au |  Wendy Paglia |
If you would like to receive this information/publication in an accessible format (such as large print or audio) please call the Customer Service Centre on: 136 186, TTY: 1800 122 969, or email customer.service@dpi.vic.gov.au
Published by the Department of Primary Industries,
Sustainable Irrigated Landscapes, April 2010,
© The State of Victoria, 2010
This publication is copyright. No part may be reproduced by any process except in accordance with the provisions of the Copyright Act 1968.
Authorised by the Victorian Government, 1 Spring Street, Melbourne 3000
Disclaimer:
This publication may be of assistance to you but the State of Victoria and its employees do not guarantee that the publication is without flaw of any kind or is wholly appropriate for your particular purposes and therefore disclaims all liability for any error, loss or other consequence which may arise from you relying on any information in this publication.
For more information about DPI go to www.dpi.vic.gov.au or call the Customer Call Centre on 136 186.
© State of Victoria (Agriculture Victoria) 1996 - .

This work, Victorian Resources Online, is licensed under a Creative Commons Attribution 4.0 licence. You are free to re-use the work under that licence, on the condition that you credit the State of Victoria (Agriculture Victoria) as author, indicate if changes were made and comply with the other licence terms.
The licence does not apply to ‘branding’ or some ‘images or photographs’ that may be owned by third parties. We ask you to seek prior approval to use images using the VRO feedback form. Access to higher quality images can also be provided on request.
This page was last updated on .