
Appendix C: A Soil Biological Perspective on Soil Health - Pauline Mele
Back to: Soil health for Victoria's agriculture - context, terminology and concepts
Background
The current renaissance of soil health as a key issue for regional and rural communities has been driven by a number of key socio–political and environmental factors that have simultaneously aligned. These factors include a market driven demand for clean and green produce, a growing land stewardship ethos driven in part by generational succession and demographic transition, the State Government response to the Environment and Natural Resources Committee Inquiry on the Impact and Trends in Soil Acidity (ENRC 2004) that highlighted the broader problems associated with soil health decline and in turn provided the impetus for the development of a DPI Soil Health Policy framework for Victoria (2006) and individual CMA soil health strategies. Most recently the release of the ‘Action Agenda on Climate Change and Greenhouse’ (DPI Science Policy Unit 2006) and specifically the abatement strategy related to ‘extra carbon sequestration via agricultural soils’ has further added impetus for soil health BMP.
It has been claimed by consultants, extension specialists and landcare coordinators that ‘soil biology is fuelling the interest in soil health’. This specific interest in soil biology as an important component of soil health can be attributed to many factors including the increased influx of ‘alternative’ products such as soil conditioners and biofertilisers, the 20–30% growth in organic certification since 2003, a general heightened awareness of soil biology in farming systems driven by a Grains Research and Development Corporation (GRDC)– led soil biology initiative (AJSR special edition volume 44, 2006), land–holder driven demand for regionally relevant information and monitoring tools and the rapid expansion in new detection, data integration and visualization technologies. The focus provided by the alignment of these factors has also exposed the limitations in soil health databases in terms of accessibility and quality of data and in the case of soil biology the general paucity of data.
Victoria’s Soil Infrastructure.
The concept of soil as infrastructure is based on the principle that soil represents the natural capital that underpins all terrestrial ecosystems by providing ‘essential’ ecosystem services such as water quality, nutrient supply and storage and plant and ecosystem health. These services have both amenity and production value. An inventory of the soil infrastructure is therefore critical in order to:
1. assess the quality and sustainability of existing services and therefore the extent and scope of land management impacts, and
2. to extend the knowledge of ‘new’ or ‘yet to be defined’ services. Collectively this knowledge will provide science based evidence for agri–environmental policy development and for practice change.
The Soil Health Trilogy.
Soil health assessment and monitoring requires collection of physical, chemical and biological data. The geomorphology and spatial extent of the major Victorian soils have been relatively well classified ( www.dpi.vic.gov.au/vro) and supplemented with physico–chemical data collected at GPS referenced sites throughout the state. The physico–chemical datasets are being further augmented with Mid–infrared spectral (MIRS) analyses of archived Victorian soils to develop predictive calibration set for a number of soil parameters as part of a State Government and industry investment (ORL initiative and GRDC funded project work). The GRDC rapid soil testing project incorporating MIRS work is being undertaken by the State Chemistry Laboratory (SCL–DPI) with a timeline for completion of 2007.
In relative terms, soil biology databases are far more rudimentary. An international review of soil monitoring programs or environmental monitoring systems highlighted that only 29% of the 52 programs surveyed collected biological data (Winder, 2003).
More locally, a survey of the soil biological data collected in Victoria over the last 26 years has highlighted the relative paucity of data and the fragmented, localized and the point–in–time or ‘snap–shot’ nature of collection activities. Furthermore, the data generated is limited in its utility to comparing long–established treatments (at least 5 years) and for comparing broad land–use categories within soil type and climatic boundaries, the latter of which has not been attempted.
Improvements in soil health monitoring will require consideration of the trilogy of components that constitutes soil health. The dynamic nature of these elements and ecological concepts such as ‘soil resilience’ and ‘soil resistance’ must be incorporated into tool design.
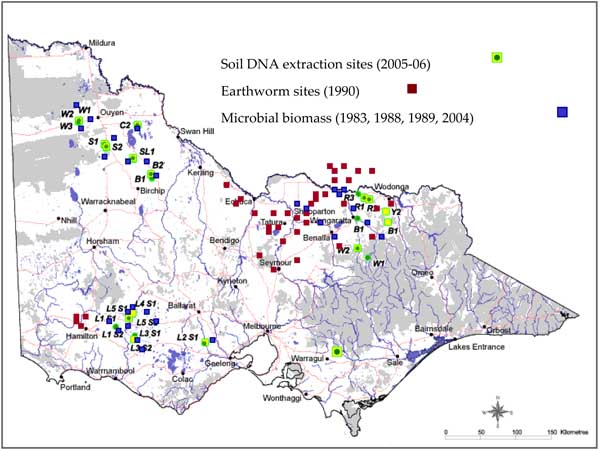
Figure 5. Location of sites where soil biological data has been collected (1980 - present).
Soil Health. The function algorithm.
The consensus definition for soil health is provided by Doran et al 1996 (refer to Introduction by Richard MacEwan), and this together with many variants of this definition feature a recurrent theme ‘the capacity of soil to function’. Soil functions relate closely and indeed may be interchangeable with the concept of ‘ecosystem services’. A high proportion of the significant functions that underpin soil health are directly attributable to the living entity of soil, or the ‘soil biota’ (Table 3).
Table 3. Specific soil biological functions and ecosystem service provided
Biota | Function | Ecosystem service |
| Ants | Infiltration, OM mixing | Increased plant nutrients, seed dispersal |
| Earthworms | Infiltration, Plant residue breakdown and redistribution | Increased plant nutrients, reduced surface runoff |
| Dungbeetles | Organic matter burial | Increased plant available nutrients |
Bacteria | Nitrogen fixation | Increased plant available N |
| Nitrogen mineralisation | Increased plant available mineral N (NH4+ and NO3- forms) | |
| Phosphorus (P), Sulphur (S), mineralisation | Improved plant P and S availability | |
| Communication system (Quorum sensing molecules e.g. Homoserolactone) | Regulates number of disease organisms | |
| Antiboiotic or probiotic production | Disease protection by supression of soil-borne root diseases | |
| Plant hormone production | Improved root growth (for water and nutrient uptake) | |
| Pesticide degradation | Reduced accumulation in ecosystem (plant & animal toxicities) | |
| Fe and Zn chelation | Enhanced plant Fe and Zn nutrition | |
| Polysaccaride production | Improved structure + moisture retention (reduced erosion) | |
| Fungi | Hyphal (filamentous) growth from | Improved structure + aeration (reduced erosion) |
| Glomalin protein production (mycorrhizal fungi) | Imrpvoed structure + moisture retention (reduced erosion) | |
| Bacteria and Fungi | Cellulose and lignin decomposition | Decomposition and C transfer |
The soil biota are represented by a vast array of organisms that collectively constitute the most diverse ecosystem on the planet. These organisms range from simple, single–celled organisms to more complex, multicellular forms and from the microscopic (μm) eg bacteria, viruses, protozoa, fungi, algae and microfauna through to the macroscopic (mm) fauna eg springtails, mites, ants, earthworms.
Functional attributes have been assigned with a high degree of accuracy for the macro–meso and microfauna but with more limited precision to the microflora. In fact, attributing function to soil biota becomes exponentially more difficult as organisms within a soil community decrease in size and increase in abundance and diversity. For example, at the macroscopic scale, it is well accepted that earthworms mix plant residues in the profile thereby accelerating decomposition and nutrient transfer and improving water infiltration through burrow formation (Carter et al 1994).
At the microscopic scale, estimates of bacterial abundance range from 103 to 109 colony forming units per gram of soil, or in terms of biomass from 225 to 2625 kg ha–1 (0–10 cm depth) with most communities comprising hundreds to thousands of species in a gram of soil with more than 16,000 species now listed (National Centre for Biotechnology Information 2005). Functional attributes have been ascribed with confidence to only a relatively minute subset of microbes such as the Nfixing root nodule bacteria (presence of nodules on leguminous plants), the P–scavenging mycorrhizal fungi (presence on and inside plants) and pathogens (presence of disease on plants) with the vast majority of knowledge related to how microorganisms contribute to ecosystem function being based on whether those organisms can be cultured on artificial media. Whilst
improvements have been made in media development (Davis et al 2004) it is still estimated that between 1 and 10% of soil bacteria are cultivable, indicating, as a worst case scenario, that up to 99% are, as yet uncultivated and therefore largely uncharacterized.
With the advent of approaches that involve direct extraction of DNA from soil, the ‘need to cultivate’ microbes will be largely circumvented and will result in a significant knowledge generation–phase related to the nature and extent of existing and novel soil microbial functions. In fact, it is estimated that there are more than 1.5 M novel genes that may contribute to functions that are as yet undescribed (Daniel 2005, Tringe 2005, Tyson 2004, Venter 2004). Metagenomic approaches that rely on DNA sequencing of a whole range of microbial genomes in soil (the metagenome) will therefore offer enormous scope for developing monitoring tools for existing functions and for uncovering novel agroecosystem functions. Building a comprehensive ‘catalogue’ of soil microbial functions will enable refinement of soil health tools for regional applications.
Soil Health. The ‘resilience’ algorithm.
Quantitative measures of both biological structure and function that reflect basic ecological concepts are becoming increasingly important in describing soil biological quality. Some attempts have been made to develop indices that combine microbial parameters to account for the ‘dynamic’ component that is soil health (Table 4). These attempts however do not come close to describing terms such as community stability, species richness, biodiversity (structural and functional) and functional redundancy.
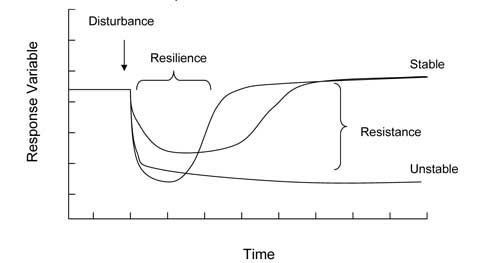
Figure 6. Response patterns and parameters used to describe dynamics in soil biological properties following disturbance
Microbial community stability is comprised of two components; resistance or the relative amount of change in a community structure, and resilience, the amount of time required for recovery to predisturbance levels (Figure 6). While a simple stability algorithm has great utility in quantifying the capacity of soil to recover after perturbation, only a limited number of microbial parameters have been tested.
Biological diversity and species richness are important indicators of stability and resilience of soils. Methods that allow detection and measurement of different taxa and species will provide valuable data on the capacity of soils to resist and recover from disturbance. Generally, the higher the species richness and diversity, the more stable and resilient and community is. Furthermore many notable overseas studies have demonstrated a positive relationship between above and below ground biodiversity in that the more diverse the plant species, the more diverse the soil microbial communities. Indeed our knowledge of the importance of symbiotic associations between microbes and plants (eg root nodule bacteria and legumes and orchids and mycorrhizal fungi) and the connection with dietary requirements of certain Australian marsupials (Claridge 2002) illustrates the important connection between above and below ground communities.
Table 4 Soil quality indices that reflect, to varying degrees of complexity, the dynamics of the soil ecosystem.
[/p>]Soil Quality Index | Index formula | Index Method |
| Stability Resistance | Uses formulas yielding values between –1 and +1 that can be applied to any particular measure of a microbial community function or characteristic. | |
| Resilience | ||
| Sensitivity – resistance | Ratio of metal tolerant to metal sensitive bacteria | Enumeration of sensitive and resistant bacteria, fungi, and actinomycetes capable of growth in media containing Cd, Zn,and other metals. |
| Nematode feeding groups and biodiversity | Ratio of bacteriovores to fungivores | Requires species level identification of nematodes for assignment to functional groups. |
| Nematode maturity index | Proportion of persistent (Kstrategists) and colonizers (r strategists) in nematode populations. | |
| Earthworm abundance | Species abundance per m2 , % maturity stage/ total population | Earthworm abundance and biomass at temporal and spatial scales to determine dominance hierarchies. |
| Ecophysiological index | Ratio of r and K bacteria | Population size of r and K organisms by plate count methods. |
| Biovolumes ratio | TA/AFB | Ratio of total to active (TA) fungal plus bacterial biovolumes, divided by the ratio of the active fungal to bacterial biovolume (AFB):yields total/active/active fungal/bacterial (TA/AFB) biovolumes ratio. |
| Metabolic quotient | qCO2 | Respiration per unit o fmicrobial biomass |
| Microbial biomass | Ecological marker for carbon, nitrogen, phosphorus and sulfur use efficiency. Estimates proportion of total organic pools contained in biomass. | |
| Heterotrophic evenness | SubstrateevennessbySimpson–Yuleindex | |
| Catabolic diversity | Shannon diversity index | Catabolic diversity based utilization BIOLOG® Microtiter ecoplates |
Knowledge of the inherent capacity of soils to resist and recover based on the soil microbial diversity will be a major advancement in soil , plant and animal health monitoring. The most successful example of species data collection and application in assessment of resilience has been in the Natural Environment Research Council (NERC) Soil Biodiversity program at Sourhope in the UK (Irvine et al. 2006).
Soil Health Monitoring.
The paradigm shift that has occurred in the last decade related to soil health monitoring approaches and particularly biological monitoring can be ascribed to a shift from a ‘one size fits all’ to a ‘purpose and place’ approach. In general, soil health monitoring is becoming more sophisticated with the application of both ecological and integrative approaches in tool design.
These factors together with the rapid advancement in biotechnologies for discovery and measurement of the microflora will herald in a new era in tool development.
There are two categories of soil bioindicator. Those that can be used in a practical field based monitoring program and those that require passage through a laboratory due to the reliance on complex analytical equipment. A summary of tests currently utilised are provided in Table 5 with a more comprehensive review of microbial indicators of soil health provided by Nielson and Winding 2002. In the new paradigm, there is likely to be a convergence in these bioindicators as infrastructure becomes more portable and knowledge acquisition more instantaneous.
Table 5. Summary of some key soil bioindicators currently available or under development.
| Test | Soil Health Information |
| Cotton strip assay | Decomposer potential |
| Fungi/bacterial ratio | Ecosystem health (overall) |
| Microbial biomass C, N & P | C, N & P turnover |
| CO2 respiration | Soil mocrobial activity (aerobic) |
| Earthworms (abundance and species richness) | C availability and soil structure (pore continuity) |
| Dung beetles | C availability, topsoil depth, structure |
| Functional groups (e.g. cellulose degraders) | Specific microbial processes |
| Microbial enzymes | Specific microbial processes |
| BIOLOGTM | Microbial diversity and richness |
| Molecular profiles (e.g. DGGE, T-RFLP, PFLA) | Microbial community structure and function |
| Bacterial genes | Specific microbial functions and structures |
| Microarrays | Multiple microbial functions and community structures |
Tool design principles.
A review by Herrick et al (2002) outlined four guidelines for applying soil quality in a range of ecosystems, including agro–ecosystems. The guidelines include:
1. identifying a suite of indicators that are consistently correlated with the functional status of one or more critical ecosystem processes, including those related to soil stability, soil water infiltration, and the capacity of the ecosystem to recover following disturbance;
2. basing indicator selection on inherent soil and site characteristics, and on site or project specific resource concerns such as erosion or species invasion;
3. using spatial variability in developing and interpreting indicators to make them more representative of ecological processes; and
4. interpreting indicators in the context of an understanding of dynamic, non–linear ecological processes defined by thresholds.
Integrative approaches.
Despite the vast and growing range of parameters that are promoted for soil health assessment, soil scientists have not been able to reach a consensus on which of these parameters best reflect the health status of soils. This difficulty not only reflects the great challenge in transcending a hierarchy of scales that for example, links genetic diversity to organismal diversity and soil ecosystem properties but also the need to consider soil physico–chemical indices. Attempts to solve this problem and understand these linkages has led to the emerging discipline of ecoinformatics, which is the application of computer modelling and statistical approaches to examine relationships between disparate types of environmental data at different scales that can be used to describe and manage ecosystems. One approach that is being pioneered for this purpose is distance based redundancy analysis (Legendre, 1999). Another powerful approach is the application of artificial neural networks (ANN) that are being used for integrated environmental assessment and visualization of complex multidimensional environmental data at multiple scales (Tran, 2003; Schultz, 1997; De la Rosa, 2004). With ANN, multidimensional data can be reduced in dimensionality by a combination of self–organizing maps (SOM) which are a type of neural network, and principle components analysis. Results generated from this approach provide a 2 or 3–dimensional map of clusters that reflect relationships between variables and site locations. The maps can be used to explore the influence of environmental variables on biological parameters (Lentzsh, 2005; Kampichler, 2000; Noble, 2000). This information can be used to identify key variables and can be used for forecasting changes in response variables over time. Most importantly the data generated can be presented visually in a way that provides for easy interpretation of complicated datasets.
Self organizing maps employ an unsupervised artificial neural network program to recognize patterns and associations at all levels of complexity within ecosystems from genes to ecological networks (Recknagel, 2003 ). Figure 7 illustrates conceptually how neural networks generate selforganising maps using computational methods. The model consists of two layers comprising an input layer that has nodes representing each input variable, and an output layer (Kohonen map) that is a 2–dimensional array of nodes. The input and output layers are linked by mathematical functions between every node in each layer. The computational model uses randomly selected input data (sample units) and calculates the distance between the input data and every node in the output layer. The program uses an ordering phase and a tuning phase to group all the input variables that vary similarly. The resulting Kohonen map contains color coded or shaded hexagons that summarize all of the component planes that represent individual abiotic and biotic variables, site locations, and other input information. The summary diagram is displayed as a “Umatrix” or unified matrix. Each of the component planes can be displayed separately and compared visually to examine their clustering relationships with all of the other variables.
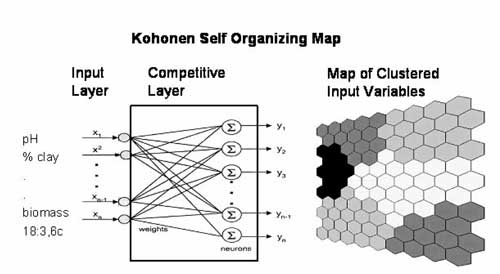
Figure 7. A Kohonen Self–Organizing Map illustrating the 3 key components; an input layer where the inputs refer to the soil quality variables, a competitive layer that weights and matches similar variables, and a map of clustered variables (Figure adapted from the 2004 ISIE workshop lecture by Recknagel).
Adoption of tools.
The first wave of interest in tools to assess soil health in the 90’s in Australia gave rise to general consensus for single parameters or at least a ‘minimum dataset’. A major failing of 90’s efforts was the lack of attention to the interpretation of data that was generated from the tests which lead to poor uptake of these tools. Since then, we have seen the emergence of Environmental Management Systems (EMS) which engenders a whole new approach to implementation of monitoring tools based on the need for regionally relevant tools and for information, to flow back to the land manager to assist management choices (Carruthers and Tinning, 2003).
Land–holders will continue to demand simple tools for monitoring soil health, including biological health (Lobry–de Bruyn 1993). The growing acceptance that soil health is complex by virtue of its soil biological community, will justify investment in developing more sophisticated tools to satisfy more complex questions associated with land–use management and climate impacts. Despite the enormous interest in soil health in Victoria, there are no tools available that provide robust information to support practice change.
References
Claridge AW, Cork SJ (1994) Nutritional–Value of Hypogeal Fungal Sporocarps for the Long–Nosed Potoroo (Potorous–Tridactylus), a Forest–Dwelling Mycophagous Marsupial. Australian Journal of Zoology 42, 701–710.
Carruthers G , Tinning G (2003) Where, and how, do monitoring and sustainability indicators fit into environmental management systems? Australian Journal of Experimental Agriculture 43, 307–323.
Davis KER, Joseph SJ, Janssen PH, (2005) Effects of growth medium, inoculum size, and incubation time on culturability and isolation of soil bacteria. Applied and Environmental Microbiology 71, 826–834.
Daniel R, (2005) The metagenomics of soil. Nature Reviews Microbiology 3, 470–478.
De la Rosa D, Mayol F, Diaz–Pereira E, Fernandez M, de la Rosa D, (2004) A land evaluation decision support system (MicroLEIS DSS) for agricultural soil protection. Environmental Modeling & Software 19, 929–942.
Doran JW, Parkin TB, (1994) Defining and assessing soil quality. In Doran JW, Coleman DF, Bezdicek DF, Stewart BA (eds.) Defining Soil Quality for a Sustainable Environment. SSSA Spec. Pub. No. 35, Soil Science Society of America, Madison, WI., pp. 3–21
Herrick JE, Brown JR, Tugel AJ, Shaver PL, Havstad KM, (2002) Application of soil quality to monitoring and management: Paradigms from rangeland ecology. Agronomy Journal 94, 3–11.
Kampichler C, Dzeroski S, Wieland R, (2000) Application of machine learning techniques to the analysis of soil ecological data bases: relationships between habitat features and Collembolan community characteristics. Soil Biology & Biochemistry 32, 197–209.
Legendre P, Anderson MJ, (1999) Distance–based redundancy analysis: Testing multispecies responses in multifactorial ecological experiments. Ecological Monographs 69, 512–512.
Lentzsh P, Wieland R, Wirth S, (2005) Application of multiple regression and neural network approaches for landscape–scale assessment of soil microbial biomass. Soil Biology and Biochemistry 37, 1577–1580.
Lobry de Bruyn L A, Abbey JA (2003) Characterisation of farmers’ soil sense and the implications for on–farm monitoring of soil health. Australian Journal of Experimental Agriculture 43, 285– 305.
Murphy DV, Kirkegaard JA, Mele PM (eds) (2006) Soil Biology in Australian Farming Systems Special edition, Australian Journal of Soil Research 44 154pp.
Neilson MN, Winding A, (2002) Microorganisms as indicators of soil health. National Environmental Research Institute, Denmark. 83pp.
Noble PA, Almeida JS, Lovell CR, (2000) Application of neural computing methods for interpreting phospholipid fatty acid profiles of natural microbial communities. Applied and Environmental Microbiology 66, 694–699.
Recknagel F, (2006) Ecological Informatics: Scope, Techniques and Applications. Springer, Berlin. 496pp.
Schultz A, Wieland R, (1997) The use of neural networks in agroecological modelling. Computers and Electronics in Agriculture 18, 73–90.
© State of Victoria (Agriculture Victoria) 1996 - 2025.

This work, Victorian Resources Online, is licensed under a Creative Commons Attribution 4.0 licence. You are free to re-use the work under that licence, on the condition that you credit the State of Victoria (Agriculture Victoria) as author, indicate if changes were made and comply with the other licence terms.
The licence does not apply to ‘branding’ or some ‘images or photographs’ that may be owned by third parties. We ask you to seek prior approval to use images using the VRO feedback form. Access to higher quality images can also be provided on request.
This page was last updated on 23/03/2020.