
Profile Number 67
| Laboratory number: | 0946 | 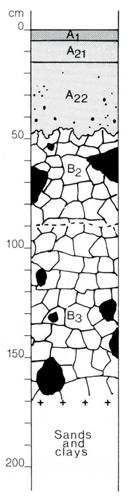 | Profile Description | ||
| Site number: | 393 | A1 | 0-5 cm | Very dark greyish brown (10YR 3/2) sandy loam; weak coarse (10 mm) crumb structure; rough-ped fabric; slightly hard when dry; abundant roots; pH 5.5; abrupt smooth boundary | |
| Classification: | Northcote (1979) – Dy3.42 Stace et al (1972) - Soloth | A21 | 5-15 cm | Light yellowish brown (10YR 6/4) fine sandy loam; common faint yellowish brown (5-15 mm) mottles; apedal; earthy fabric; very hard when dry; common roots; pH 5.8; clear smooth boundary | |
| Location: | Traralgon 8221, grid ref. 655868 2 km W of Toongabbie, 23 km NW of Rosedale | B2 | 47-90 cm | Yellowish brown (10YR 5/8) medium clay; common distinct reddish brown (<5 mm) mottles; moderate coarse (20 mm) angular blocky structure; smooth-ped fabric; common roots; 2% (5 mm) mottles; common roots; 2% red chert fragments up to 300 mm; pH 6.0%; gradual wavy boundary | |
| Land system, component: | Westbury, 1 | B3 | 90-170+ cm | Yellowish brown (10YR 5/8) heavy clay; common distinct grey (5-15 mm) and reddish brown (<5 mm) mottles; moderate coarse (25 mm) angular blocky structure; smooth-ped fabric; very hard when dry; few roots; 2% quartz gravel up to 200 mm; pH 7.0 | |
| Topography: | 4% slope on low rise | ||||
| Elevation: | 80 m | ||||
| Drainage: | Poor | ||||
| Parent material: | Tertiary unconsolidated material of mixed texture | ||||
| Vegetation: | Open forest II: Eucalyptus globoidea, E. sideroxylon, E. mellioroda and E. goniocalyx | ||||
| LABORATORY ANALYSES 946 | |||||||||||||||||||
Horizon | Sample Depth cm | Lab. texture | Particle size distribution | Atterberg limits | 1:5 soil water suspension | Clay mineralogy by x-ray diffraction | |||||||||||||
Gravel % | Coarse sand % f.e. | fine sand % f.e. | Silt % f.e. | Clay % f.e. | liquid limit % | plastic limit % | plasticity index % | linear shrinkage % | pH | EC 25°C µS/cm | Cl- % | Depth cm | Composition % | ||||||
A1 | 0-5 | L | 0 | 10 | 33 | 23 | 15 | 4.6 | 110 | 0.011 | |||||||||
A21 | 10-15 | L | 1 | 24 | 40 | 23 | 13 | 4.4 | 50 | 0.006 | |||||||||
A22 | 30-47 | L | 4 | 26 | 33 | 23 | 17 | 5.0 | 55 | 0.005 | |||||||||
B2 | 47-60 | CL | 5 | 14 | 24 | 22 | 38 | 42 | 13 | 29 | 13 | 5.5 | 190 | 0.026 | |||||
B3 | 90-120 | C | 1 | 10 | 21 | 19 | 49 | 6.2 | 50 | 0.063 | |||||||||
Horizon | Sample Depth cm | Org. C % | Total N % | 1.3C N | Free Fe2O3 % | Available | HCl extract | Exchangeable cations | |||||||||||
P ppm | K ppm | P % | K % | Ca | Mg | K | Na | CEC | Ca % of CEC | Mg | K | Na | H | ||||||
Milliequivalents/100g | |||||||||||||||||||
A1 | 0-5 | 12.2 | 0.59 | 27 | 0.5 | 23 | 160 | 0.023 | 0.11 | 5.4 | 2.9 | 0.6 | 0.4 | 42.2 | 13 | 7 | 1 | 1 | 78 |
A21 | 10-15 | 0.74 | 0.036 | 27 | 0.6 | 10 | 30 | 0.029 | 0.029 | 0.3 | 0.4 | 0.1 | 0.2 | 7.6 | 4 | 5 | 1 | 3 | 87 |
A22 | 30-47 | 1.9 | 0.004 | 0.097 | 0.2 | 1.3 | 0.1 | 0.4 | 9.4 | 2 | 14 | 1 | 4 | 79 | |||||
B2 | 47-60 | 2.4 | 0.004 | 0.15 | 0.2 | 6.8 | 0.2 | 2.5 | 21.5 | 1 | 32 | 1 | 12 | 54 | |||||
B3 | 90-120 | 2.7 | 0.004 | 0.21 | 0.2 | 9.1 | 0.1 | 5.3 | 19.3 | 1 | 47 | 1 | 27 | 24 | |||||
© State of Victoria (Agriculture Victoria) 1996 - 2025.

This work, Victorian Resources Online, is licensed under a Creative Commons Attribution 4.0 licence. You are free to re-use the work under that licence, on the condition that you credit the State of Victoria (Agriculture Victoria) as author, indicate if changes were made and comply with the other licence terms.
The licence does not apply to ‘branding’ or some ‘images or photographs’ that may be owned by third parties. We ask you to seek prior approval to use images using the VRO feedback form. Access to higher quality images can also be provided on request.
This page was last updated on 23/03/2020.