HDLN Soil and Water Dairy Action Program - Soil Characterisation
|
Project Introduction | 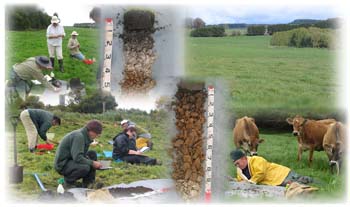 |
Table 1. Soil health benchmarks.
| Soil Health Parameter | Optimum | Moderate | Too High or Too Low |
| Bulk density (Mg/m3) | 1.1–1.3 | 1.3–1.4 | > 1.4 or < 1.1 |
| Air-filled porosity (%) (at 10 kPa) | > 15 | 10–15 | < 10 |
| Olsen P (mg/kg) | 16–25 | 11–15 or 26–30 | <11 or >30 |
| Total carbon (%) | >3.1 | 2–3.1 | <2 |
| pHCa | 4.7–6.5 | 4.3–4.7 or 6.5–7.6 | <4.3 or >7.6 |
| ECe (dS/m) | <1.8 | 1.8–3.8 | >3.8 |
| ESP (%) | <6 | >6 | |
| Skene K (mg/kg) | 150–200 | 100–150 or 200–250 | <100 or >250 |
| CPC S (mg/kg) | 9–12 | 4–8 or 13–20 | <4 or >20 |
| Exchangeable Al (mg/kg) | 0–10 | 10–20 | >20 |
Soil Profile Description
As well as the characterisation of the surface soil (0-10 cm), soil profiles were examined to the top of the subsoil in Year 1 and to a depth of approximately 1 metre in Years 2 and 3. This report contains the descriptions of soil profiles complete with landscape and profile photos where relevant
| Year | Sties |
| 2005 | 1 - 71 |
| 2006 | 72 - 114 |
| 2007 | 115 - 158 |
Method
In each paddock three profiles were described; to the upper subsoil in Year 1 and to a depth of approximately 100 cm (1 metre) in Years 2 and 3. These sites were associated with where the surface samples were taken.
The profiles were dug by first removing a square surface sod by spade and then augering to about 100cm.
Each auger-full was laid out in sequence according to the measured depth of the hole and laid out on a ground sheet, thereby creating an approximation of a soil profile.
Standard morphological descriptions were carried out as per standard texts such as the Australian Soil Classification (Isbell et al), The Factual Key for describing Australian soils (Northcote) and the Australian Soil and Land Field Handbook (National Committee on Soils and Terrain). There have been some updates in these reference books since the field descriptions were carried out.
Acknowledgements
The authors would like to thank the following people:
- Andrew McLennan, Shari McConachy and Doug Crawford for their assistance in the field;
- Becky McCain and the Heystesbury Landcare Network committee;
- Austin Brown and Nerissa Lovric for their support and advice; and,
- The land holders for allowing us onto their properties.
© State of Victoria (Agriculture Victoria) 1996 - 2025.

This work, Victorian Resources Online, is licensed under a Creative Commons Attribution 4.0 licence. You are free to re-use the work under that licence, on the condition that you credit the State of Victoria (Agriculture Victoria) as author, indicate if changes were made and comply with the other licence terms.
The licence does not apply to ‘branding’ or some ‘images or photographs’ that may be owned by third parties. We ask you to seek prior approval to use images using the VRO feedback form. Access to higher quality images can also be provided on request.
This page was last updated on 20/10/2021.