
Thomson (Th)
|
Geology |  |  |
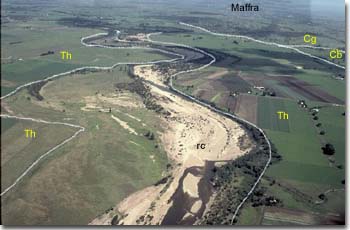 This photo shows the coarse sediments from the Avon River [recent coarse river sediments (rc) map unit] flanked by the finer textured sediments from the Avon River [Thomson (Th) map unit]. The road in the right middle ground is Pearces Lane. Maffra is in the right background. | 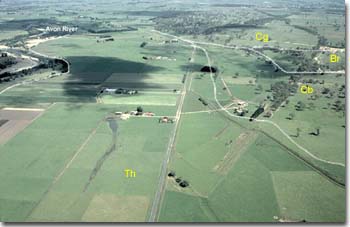 This photo shows an abandoned former channel of the Avon River. Most of the foreground is the Thomson map unit. The Clydebank map unit (right middle ground) is an earlier river terrace. The right background has been mapped as the Coongulla map unit and the Briagolong map unit. These are Tertiary sediments and an old river terrace respectively. |
Landform Flood plain. Numerous abandoned river channels flanked by natural levees are a feature of this map unit. Original Vegetation The original vegetation has been described as riverine scrubs and swamps as well as treeless grasslands (Lunt, 1997). A few remnant forest red gum (Eucalyptus tereticornis) remain. Previous Maps and Reports Skene and Walbran (1948, 1949) classified the soils of this map unit into Thomson silty clay and Thomson silty clay loam. Aldrick et al. (1992) mapped the area as Maffra 1 Land System which includes the Thomson and Newry map units of this report. | 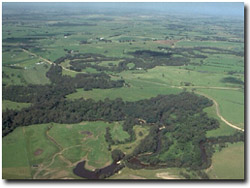 Myrtlebank Road crossing the Thomson River. |
These soils lack texture contrast. Apart from the abandoned channels, the surface soils are deep very dark brownish grey (10YR 3/1 and 3/2) silty clay loams to silty light clays. The subsoils are similar in texture but although dark in colour, tend to be browner (e.g. 10YR 3/3). The upper soil profile is generally moderately acidic and the subsoils are non-sodic. The Thomson map unit is arbitrarily separated from the Newry map unit because of the fewer number of abandoned channels and its apparent heavier soil texture overall. The soils are generally classified as Black Dermosols using the Australian Soil Classification.
Chemical and Physical Analysis
Analytical results are provided for the soil pit sites GP62, GP64, GP75 and GP76 which are located on this map unit. In common with the similar Newry map unit, the pH of the surface soil is between 5.5 and 6.0 and becomes slightly alkaline with depth.
Analytical results for a further six sites are provided, four from Skene and Walbran (1948, 1949) and two from Aldrick et al. (1992).
GP62. Soil Pit Site (Sargeant and Imhof, 2000)
Depth cm | Texture | pH | EC dS/m | Ca meq% | Mg meq% | K meq% | Na meq% | H meq% | ESP % | Coarse sand % | Fine sand % | Silt % | Clay % | LAT % |
0-25 | FSL | 5.7 | 0.22 | 10.0 | 2.9 | 0.2 | 0.3 | 11.0 | 1 | 2 | 52 | 19 | 18 | 3 |
25-40 | FSCL | 6.4 | 0.09 | 8.3 | 4.4 | 0.1 | 0.3 | 8.7 | 1 | 2 | 41 | 25 | 25 | 2 |
40-60 | LC | 5.9 | 0.09 | 5.7 | 6.1 | 0.1 | 0.4 | 11.0 | 2 | 2 | 17 | 36 | 39 | 2 |
60-100 | ZLC | 5.8 | 0.08 | 4.1 | 6.1 | 0.1 | 0.4 | 3.4 | 3 | 2 | 18 | 38 | 38 | 1 |
100-120 | ZLC | 6.6 | 0.10 |
GP64. Soil Pit Site (Sargeant and Imhof, 2000)
Depth cm | Texture | pH | EC dS/m | Cl % | Nitrogen % | Carbon % | Ca meq% | Mg meq% | K meq% | Na meq% | H meq% | ESP % | Coarse sand % | Fine sand % | Silt % | Clay % | LAT % |
0-10 | FSCL+ | 5.6 | 0.27 | <.02 | 0.47 | 4.7 | 10 | 5.5 | 0.4 | 0.3 | 16.0 | 1 | 3 | 19 | 34 | 33 | 3 |
10-30 | FSCL+ | 5.9 | 0.09 | 0.22 | 2.6 | 6.1 | 5.3 | 0.3 | 0.5 | 11.0 | 2 | 3 | 27 | 29 | 35 | 2 | |
30-60 | ZCL | 6.0 | 0.14 | 3.7 | 5.6 | 0.2 | 0.7 | 1.9 | 6 | 4 | 37 | 28 | 29 | 1 | |||
60-90 | FSCL | 6.5 | 0.56 | 0.08 | 2.2 | 5.6 | 0.1 | 1.1 | 13 | 2 | 49 | 25 | 24 | 1 | |||
90+ | FSCL | 8.7 | 0.49 | 0.06 | 1.5 | 4.1 | 0.1 | 1.1 | 36 |
GP75. Soil Pit Site (Sargeant and Imhof, 2000)
Depth cm | Texture | pH | EC dS/m | Cl % | Nitrogen % | Carbon % | Ca meq% | Mg meq% | K meq% | Na meq% | H meq% | ESP % | Coarse sand % | Fine sand % | Silt % | Clay % | LAT % |
0- 30 | CL | 5.4 | 0.45 | 0.40 | 5.0 | 16.0 | 4.8 | 2.2 | 0.2 | 4 | 21 | 36 | 30 | 3 | |||
30-50 | CL | 6.0 | 0.35 | 0.14 | 2.7 | 14.0 | 5.0 | 1.7 | 0.2 | 8.1 | 2 | 22 | 37 | 33 | 4 | ||
50-90 | CL | 7.5 | 0.45 | 5.4 | 2.1 | 1.7 | 0.3 | 4 | 11 | 41 | 28 | 20 | 1 | ||||
90+ | FSCL | 8.3 | 0.81 | 4.7 | 4.6 | 0.3 | 1.6 | 15 | 1 | 41 | 33 | 25 | 1 |
GP76. Soil Pit Site (Sargeant and Imhof, 2000)
Depth cm | Texture | pH | EC dS/m | Nitrogen % | Carbon % | Ca meq% | Mg meq% | K meq% | Na meq% | H meq% | ESP % | Coarse sand % | Fine sand % | Silt % | Clay % | LAT % |
0-30 | FSCL | 5.9 | 0.12 | 0.38 | 4.0 | 10.0 | 2.9 | 0.9 | 0.2 | 4 | 44 | 24 | 21 | 2 | ||
30-50 | CL | 6.3 | <0.05 | 0.10 | 2.4 | 10.0 | 2.8 | 0.3 | 0.2 | 8.6 | 1 | 2 | 51 | 23 | 20 | 2 |
50-90 | CL | 6.8 | <0.05 | 10.0 | 3.2 | 0.2 | 0.2 | 2 | 2 | 52 | 22 | 19 | 2 | |||
90+ | FSCL | 7.1 | <0.05 | 7.3 | 4.1 | 0.1 | 0.2 | 2 |
Thomson silty clay loam, (Skene and Walbran, 1948)
Depth cm | Texture | pH | EC dS/m | Cl % | Nitrogen % | Carbon % | Coarse sand % | Fine sand % | Silt % | Clay % | LAT % |
0-18 | ZCL | 6.5 | 0.13 | .006 | 0.358 | 4.84 | 2 | 12 | 36 | 39 | 2 |
18-38 | ZLC | 6.3 | 0.08 | .006 | 2 | 11 | 35 | 43 | 2 | ||
38-64 | ZC | 6.9 | 0.12 | .017 | 2 | 12 | 35 | 45 | 2 | ||
64-114 | ZC | 8.6 | 0.23 | .030 | 1 | 13 | 41 | 41 | 1 | ||
114-165 | ZC | 8.7 | 0.37 | .060 | 1 | 13 | 42 | 42 | 2 | ||
165-236 | ZC | 8.5 | 0.44 | .072 | 2 | 15 | 36 | 41 | 2 |
Thomson silty clay loam, (Skene and Walbran, 1948)
Depth cm | Texture | pH | EC dS/m | Cl % | Nitrogen % | Carbon % | Coarse sand % | Fine sand % | Silt % | Clay % | LAT % |
0-15 | ZCL | 5.4 | 0.28 | .016 | 0.196 | 4.84 | 1 | 5 | 33 | 44 | 2 |
15-28 | ZCL | 5.5 | 0.17 | .008 | 1 | 5 | 33 | 48 | 2 | ||
28-38 | ZLC | 5.8 | 0.14 | .16 | 2 | 8 | 32 | 48 | 2 | ||
38-71 | ZC | 5.8 | 0.17 | .022 | 2 | 7 | 35 | 49 | 2 |
Thomson silty clay, (Skene and Walbran, 1948)
Depth cm | Texture | pH | EC dS/m | Cl % | Nitrogen % | Carbon % | Coarse sand % | Fine sand % | Silt % | Clay % | LAT % |
0-15 | ZLC | 5.9 | 0.15 | .019 | .158 | 4.23 | 2 | 18 | 35 | 42 | 3 |
15-36 | ZLC | 6.1 | 0.13 | .018 | 2 | 18 | 29 | 45 | 2 | ||
36-66 | ZC | 5.8 | 0.22 | .038 | 1 | 16 | 29 | 49 | 1 | ||
66-173 | ZC | 7.1 | 0.39 | .060 | 1 | 13 | 34 | 49 | 1 |
Thomson silty clay, (Skene and Walbran, 1949)
Depth cm | Texture | pH | EC dS/m | Cl % | Nitrogen % | Carbon % | Coarse sand % | Fine sand % | Silt % | Clay % | LAT % |
0-10 | ZCL | 5.7 | 0.16 | .012 | 0.583 | 7.72 | 3 | 9 | 33 | 37 | 2 |
10-25 | ZLC | 5.7 | 0.09 | .009 | 2 | 10 | 36 | 41 | 1 | ||
25-84 | ZMC | 6.4 | 0.48 | .087 | 1 | 10 | 37 | 44 | 1 | ||
84-152 | ZMC | 8.4 | 0.54 | .096 | 3 | 11 | 39 | 44 | 1 | ||
183-213 | LC | 8.4 | 0.19 | .027 | 5 | 36 | 37 | 28 | 1 | ||
213-244 | FSC | 8.1 | 0.11 | .014 | 6 | 41 | 30 | 22 | <1 |
Profile 26, Maffra1, 2, (Aldrick et al., 1992)
Depth cm | Texture | pH | EC dS/m | Cl % | Nitrogen % | Carbon % | Ca meq% | Mg meq% | K meq% | Na meq% | H meq% | ESP % | Gravel % | Coarse sand % | Fine sand % | Silt % | Clay % |
0-10 | CL | 5.4 | 0.12 | .011 | 0.46 | 6.96 | 5.5 | 4.7 | 0.7 | 0.7 | 20.9 | 2 | 3 | 4 | 21 | 30 | 35 |
20-30 | MC | 5.6 | 0.06 | .005 | 0.26 | 2.85 | 5.8 | 4.4 | 0.2 | 0.8 | 18.7 | 3 | 3 | 17 | 31 | 45 | |
60-90 | HC | 8.0 | 0.39 | .045 | 5.0 | 7.2 | 0.1 | 4.3 | 0.8 | 25 | 1 | 26 | 37 | 37 | |||
95-120 | SC | 8.8 | 0.44 | .054 | 1.9 | 4.1 | 0.2 | 3.2 | 0 | 34 | <1 | 58 | 21 | 20 |
Profile 27, Maffra1, 1, (Aldrick et al., 1992)
Depth cm | Texture | pH | EC dS/m | Cl % | Nitrogen % | Carbon % | Ca meq% | Mg meq% | K meq% | Na meq% | H meq% | ESP % | Gravel % | Coarse sand % | Fine sand % | Silt % | Clay % |
0-10 | LC | 5.7 | 0.043 | .005 | 0.27 | 4.76 | 8.7 | 2.9 | 0.5 | 0.3 | 15.2 | 1 | 4 | 4 | 31 | 27 | 31 |
20-30 | MC | 6.2 | 0.031 | .003 | 0.15 | 1.79 | 10.1 | 3.3 | 0.3 | 0.3 | 9.0 | 1 | 1 | 36 | 30 | 30 | |
35-60 | SC | 6.7 | 0.023 | .002 | 6.8 | 2.8 | 0.2 | 0.3 | 4.0 | 2 | 3 | 45 | 27 | 23 | |||
90-120 | LSC | 7.3 | 0.035 | .002 | 5.3 | 3.4 | 0.2 | 0.6 | 3.3 | 5 | 1 | 44 | 32 | 24 |
The following abbreviations are used to describe field texture: S - sand; LS - loamy sand; ClS - clayey sand; SL - sandy loam; L - loam; CL - clay loam; SCL - sandy clay loam; SC - sandy clay; FSCL - fine sandy clay loam; FSC - fine sandy clay; LC - light clay; MC - medium clay; HC - heavy clay; GR - gravel; ZL - silty loam; ZCL - silty clay loam; ZLC - silty light clay; ZMC - silty medium clay.
Particle size distribution data given for Skene and Walbran (1948, 1949) does not include the water content of the soil. As a result the coarse sand, fine sand, silt, clay and loss on acid treatment (LAT) may not add up to 100%. Aldrick et al. (1992) does not provide LAT data.
Other symbols include: pH - analysed in water; EC - electrical conductivity; Cl - chloride; Ca - exchangeable calcium; Mg - exchangeable magnesium, K - exchangeable potassium; Na - exchangeable sodium; H - exchangeable hydrogen; ESP - exchangeable sodium percentage.
For Soil Pit Sites (Sargeant and Imhof, 2000) exchangeable cations have been determined using Gilman method (where pH >7) and Tucker method (pH <7). Exchangeable Sodium % (ESP) has been calculated here as the percentage of sodium in relation to the sum of the exchangeable basic cations.
Land Use
The soils have a favourable soil structure, are very permeable and highly suited to irrigation. When irrigated, spray irrigation is the usual method. Because they are so permeable, some of the water applied during flood irrigation may penetrate below the root zone. This water is then unavailable to plants and may add to the regional watertable. For these reasons, spray irrigation may be the best way of irrigating these soils.
Most of the soils are used for pasture production but some lucerne and row crops (including asparagus) are grown. The likelihood of flooding could be a problem for vegetable cropping.
Flood Risk
About 1 in 10 years.
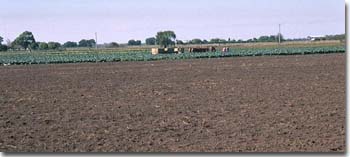 Intensive cropping in the Avon River flats near Boisdale. |
© State of Victoria (Agriculture Victoria) 1996 - .

This work, Victorian Resources Online, is licensed under a Creative Commons Attribution 4.0 licence. You are free to re-use the work under that licence, on the condition that you credit the State of Victoria (Agriculture Victoria) as author, indicate if changes were made and comply with the other licence terms.
The licence does not apply to ‘branding’ or some ‘images or photographs’ that may be owned by third parties. We ask you to seek prior approval to use images using the VRO feedback form. Access to higher quality images can also be provided on request.
This page was last updated on .