
Mallee Soil Erosion and Land Management Survey Post Sowing 2012
 | Purpose of Report | Trend Summary | Post Sowing 2012 Report | Recommendations | References Mallee Soil Erosion and Land Management Survey - Post Sowing 2012 (PDF 616KB) Mallee Soil Erosion and Land Management Survey - Post Sowing 2012 (DOC 3899KB) To view the information PDF requires the use of a PDF reader. This can be installed for free from the Adobe website (external link). |
This report provides the results of the ‘Mallee soil erosion and land management survey’. The report is divided into two parts. The first part of the report provides a summary of trends over time in soil erosion risk and land management practices for the Mallee sites surveyed. The second part of the report provides the results from the Post Sowing 2012 survey.
Trend Summary
Background
Wind erosion occurs naturally in the landscape and is an important part of soil genesis; many soils in the Mallee have formed by aeolian processes. However wind erosion also causes adverse effects through the removal of large amounts of fine soil particles that result in a direct loss of nutrients from agricultural land as well as sandblasting emerging crops (Armbrust 1984 as cited in Leys et al 2007). Wind erosion also has considerable off-site impact, the airborne particulate matter can cause adverse health effects, and reduced visibility and the deposition of soil can smother native vegetation, bury or undermine infrastructure and increase nutrient loads in waterways (Clune, 2005).
Wind erosion has been a recognised issue in the Mallee since at least 1945 (Thomas as cited in Clune 2005) and as such has been a priority of Natural Resource Management organisations for many years. This has resulted in extensive promotion and research of agricultural practices that minimise the risk of erosion.
In 1978 the Mallee fallow survey commenced after wind erosion became severe and widespread, particularly in areas with light soils (Boucher 2005a). The objective of this original survey was to assess actual erosion and land use practices in the Mallee region of Victoria. The survey has continued using a number of different methods (Wakefield 2008b).
In 2005-2006 the survey underwent a review and redesign. The results reported in the main component of this report are from the current methods which have been implemented since 2007.
The current survey is conducted three times annually, during late summer (February - March), post sowing (June - July) and spring (October). In-paddock assessments are completed at 157 sites, from across six land systems (Central Mallee, Millewa, Tempy, Hopetoun, Culgoa and Boigbeat) within the Mallee region. Refer to methods section in main report.
The Department of Primary Industries (DPI) Farm Services Victoria (FSV) in partnership with the Mallee Catchment Management Authority (Mallee CMA) conducts the Mallee Soil Erosion and Land Management Survey and manages the Soils and Land Management database with funding provided through the Victorian State Government.
The second part of this report documents the methods used in the surveys as well as analyses of the result of the post sowing 2012 survey. The survey records, soil dry aggregate and vegetation cover and height (risk of wind erosion), and land management practices.
The following graphs illustrate trends over time for the land management practices and vegetation coverage at the sites surveyed.
The post sowing 2012 survey was completed between the 18th June and 30th July 2012; this survey was spread out over this period due to an ongoing rain event delaying in paddock assessment. This may have implications on the results due to the extended period of time from results being collected and weather influencing change in management phase.
Risk of erosion
Over the past three years for the post sowing period (Figure 3b) of sites surveyed 85% were assessed to be at a low risk of erosion. Erosion risk was unable to be calculated for 37% of the sites during the post sowing 2012 survey as the soil samples were too wet to measure soil dry aggregate. However of the sites where assessments could be taken, 90% were determined to have a low risk of erosion.
Figure 3b: Risk of erosion recorded from the post sowing 2012 Mallee soil erosion and land management survey. Erosion risk was unable to be calculated for 37% of sites as the dry aggregate could not be collected due to wet soil. |
Conclusion
Results from the survey indicate cropping has slightly increased during the post sowing sampling period from 71.4% of sites recorded as in crop in 2007 to 75.1% of sites in 2012. Pasture has slightly declined over the same six years period. Conventional and chemical fallow has increased during the post sowing survey period from results reported in the period from 2007-2010, to the previous two years with 8.3% of sites in fallow (chemical and conventional) in 2012. It is unknown why fallow has increased; this may be due to issues such as weed resistance (pest plant, animal or diseases), increased stubble retention or financial decisions or this may also reflect rainfall patterns during these years.
Vegetation coverage recorded at sites has increased from 2008 post sowing survey when 75.3% of sites recorded less than 10% vegetation coverage in comparison to 1.9% in 2012. Vegetation coverage of greater than 50% to 70% (indicating low risk of erosion) was recorded at 16.8% of sites in 2008 compared with 73.8% in 2012 post sowing survey.
Post Sowing 2012 Report
Background | Objectives | Methods | Results and discussion | Conclusion
Background
The Department of Primary Industries (DPI) Farm Services Victoria (FSV) in partnership with the Mallee Catchment Management Authority (Mallee CMA) conducts the Mallee Soil Erosion and Land Management Survey.
In 1978 the Mallee fallow survey commenced after wind erosion became severe and widespread, particularly in areas with light soils (Boucher 2005a). The objective of this original survey was to assess actual erosion and land use practices in the Mallee region of Victoria.
In 2005-2006 the survey underwent a review (Boucher, 2005a) and was redesign using recommendations from the review (Wakefield 2008b). The focus of the survey now is on assessing risk of erosion and recording land management practices. The redesigned survey was first trialled in the summer of 2007. The survey is conducted three times annually during late summer, post sowing and spring.
The post sowing 2012 survey of soil erosion and land management was conducted during June 18th and completed July 30th of 2012. This survey was spread out over this period due to an ongoing rain event delaying in paddock assessment. This may have implications on the results due to the extended period of time from results being collected and weather influencing change in management phase.
This report documents the methods used in the surveys as well as analysis of the result of the surveys.
Objectives
The objectives of this project (2012/13) were to:
- · Undertake, analyse and report on the “Mallee Soil Erosion and Land Management Survey” three times annually (post sowing 2012, spring 2012, and late summer 2013).
· Deliver targeted communication activities to increase landholder awareness of erosion risk and management tools to mitigate both incidence and impact of wind erosion.
Survey Transects and Sampling Locations
From across six land systems within the Mallee region approximately 160 sites were selected randomly for continuous in-paddock assessments three times a year, late summer (February/March), post sowing (June/July) and spring (October). For the post sowing survey 2012, 157 sites were surveyed.
Site selection was stratified based on land system. The proportion of sites from each land system was equivalent to the representation of the land system within the major agricultural regions of the Mallee (the area of the survey), for example the Central Mallee land system occupies 50 percent of the survey area (agricultural region of the Mallee), so 50 percent of the 160 sites were located within this land system. Within each land system the sites were also stratified based on land forms (hummock, plain and dune). Again the number of sites on each land form was based on the percent of area covered by that land form within the land system. The data on land systems area and land form area was based on the Rowan & Downes, 1963 report.
| Site Locations The following is a list of the land systems and transects within each land system where the soil erosion monitoring occurs (See Figure 4). Central Mallee
|  Figure 4: Map of the 157 sites where the soil erosion monitoring is being conducted. |
At each site a one hectare area was used for collecting data, this was located 100 m along the roadside fence line from the start of the paddock and 50 m into the paddock (away from the roadside). At each site the following was recorded:
- Vegetation cover and height measurements.
- Soil dry aggregate measurements.
- The current management phase (i.e. conventional fallow, chemical fallow, crop, pasture).
- The current management practice (i.e. conventional farming or no-till/minimal till).
- The presence/ absence of livestock.
- The presence of standing stubble reported during summer and post sowing surveys.
- Soil detachment rating
| Vegetation Cover and Height Measurements Vegetation cover was measured using the levy point sampler (Levy & Madden, 1993) (refer to Figure 5). 20 random sites in the one hectare area were sampled to record vegetation cover and vegetation height (200 points). The sampler was placed on the ground (i.e. without looking) 20 times within the 1 hectare sampling area. Five paces south/north then five paces east/west were taken, then recordings taken, and repeated until 20 samples were completed. Vegetation height measurement was recorded by a 40cm ruler attached to the side of the levy point sampler. The height of the closest piece of vegetation (live or dead) to the ruler was measured in centimetres (rounding off to whole number). Vegetation measurements were achieved by counting dead or live vegetation touching the prongs on the levy point sampler. | 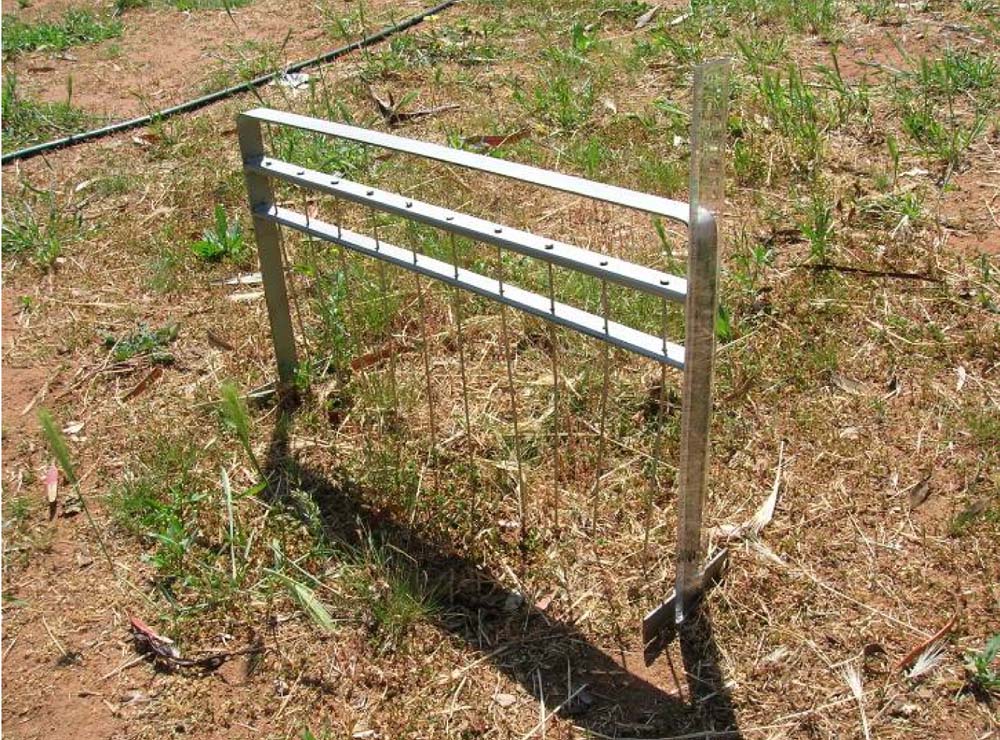 Figure 5: Levy point sampler used for assessing vegetation cover |
From within the one hectare sampling area at each site, 3 points were randomly located for collection of soil samples. Each soil sample was collected using a square nosed hand shovel (or hearth shovel). Approximately 2 kg of soil was collected down to a depth of 10 cm. It was important to ensure that minimal disturbance was made to the soil, and that the soil was dry when sampling. The soil sample was then placed in an 850 μm hand sieve and gently shaken over a baking tray. Both the coarse and fine samples were then weighed and the proportion of coarse aggregates was calculated. This provided an indication of the protection dry aggregates provide against wind erosion (Leys et al 2002).
Land Management Phase
Table 1: Management Phase Descriptions
| Chemical Fallow | Land kept free of live vegetation with the use of herbicides with no mechanical disturbance |
| Conventional Fallow | Land kept free of live vegetation with the use of mechanical cultivation. Visual of up turned earth. |
| Pasture -Volunteer | Land dominated by random grasses/cereal for grazing |
| Pasture - Improved | Land dominated by annual broadleaf and/or legume (i.e. clover/ vetch/ medic) used for grazing or green and brown manuring. |
| Hay | Pasture that has been prepared for hay by evidence of cutting, windrowing or baling. Obvious cut stems on vegetation or evidence of raked vegetation on ground. |
| Cereal Crop | Wheat, Barley, Oats, Triticale etc |
| Legume Crop | Field peas, Vetch, Lupins, Beans etc |
| Oilseed Crop | Canola, Mustard etc |
| Other | Saltbush etc |
Land Management Practice
Table 2: Management Practices Descriptions
| Conventional Farming | A system of multiple cultivation control. Passes before sowing for weed and/or seedbed preparation |
| No-Till/ Minimal Till | Sowing system aimed at minimising soil disturbance and retaining crop residues |
Livestock Present
Livestock including sheep, cattle, horses and goats were recorded as present or absent within the site. They are determined to be present if visual evidence of stock, recent scats or hoof marks could be seen i.e. scats were soft, fresh or dark in colour; stock trails could often be seen throughout the area and around fence lines where stock had walked; and/or evidence of footprints and scats around watering points.
Soil Stability Assessment
Table 3 is used as a guide to determine soil surface stability. Each site was assigned a detachment rating based on a visual assessment of soil disturbance. This was a method developed by the South Australian Department of Water, Land and Biodiversity Conservation and used as part of their soil erosion monitoring program (McCord 2008).
Table 3: Soil Detachment Rating (McCord, 2008).
Detachment Rating | Stability | Description |
1 | Stable | No significant disturbance |
2 | Slightly to moderately unstable | Partial soil surface disturbance by:
|
Includes any land which has been cultivated at least once:
| ||
Also includes land with new crop, up until late tillering:
| ||
| Also includes crops beyond tillering stage | ||
| ||
3 | Very unstable | Complete soil disturbance by cultivation or heavy grazing (or both).
|
| Such disturbance by grazing alone would normally occur only on sand |
Personnel
To ensure timely completion of the sampling during each survey period a number of teams were setup to complete field work in specified areas. Six teams of two people (Table 4) were assembled and completed all measurements and observations at allocated sites. Most teams completed field work in two days.
Table 4: Allocation of transects to teams.
Team | Day | Transect | No of sites |
1 | 1 2 | Ouyen Piangil Ouyen Piangil | 12 13 |
2 | 1 2 | Torrita Ouyen Piangil | 13 13 |
3 | 1 2 | Tutye Murrayville | 13 14 |
4 | 1 2 | Millewa Millewa | 10 10 |
5 | 1 2 | Sea Lake - Ultima - Swan Hill Sea Lake - Ultima - Swan Hill & Culgoa - Lalbert | 15 13 |
6 | 1 2 | Gama - Yaapeet Gypsum - Gama & Hopetoun _ Woomelang | 14 19 |
Data Entry
Field measurements were recorded on hard copy data sheets (Appendix 1) and the data was entered into the database in the office.
A quality control check was completed on the data entered into the database. A 100% check was completed by a staff member not involved in the original entry of the data. A signed quality control form is included as Appendix 2.
Analysis
Erosion risk
For the purpose of comparison three types of assessments of soil erosion risk were completed. These were:
- Calculation of the ‘Q value’.
- Determination of soil erosion risk using a risk matrix.
- Assessment of soil stability.
A formula has been derived by Leys (Leys et al 2002) to determine relative wind erosion risk. It uses the direct measurements of vegetation cover and soil dry aggregates to calculate a wind erosion risk for each site. The formula is as follows:
Q = 78.11375017 * exp (-0.05172598 * SC%) * exp (-0.038989759 * DA%)
Where Q is the calculated sediment transport rate (g/m/s) for an equivalent 65km/h wind measured at 10 m height; SC% is the vegetation cover percentage; and DA% is the level of dry aggregation greater than 0.85 mm as determined by gentle hand sieving.
A Q value of less than 5 g/m/s equates to low erosion risk, moderate risk is a Q value greater than 5 but less than 25 g/m/s and a high erosion risk is a Q value greater than 25 g/m/s.
Soil erosion risk matrix
The measurements of vegetation cover and soil dry aggregates were used to estimate a risk of erosion for each site. The rougher the soil surface the more stable the soil is, vegetation contributes to the roughness. It is recommended that vegetation cover remains above 50% cover to adequately protect from wind erosion (Agricultural Bureau of South Australia, 2002). Larger soil aggregates also protect soil from wind erosion. The larger the aggregates the less likely they are to be picked up and carried away by the wind, larger aggregates also contribute to surface roughness. Dry aggregation greater than 40% has been shown to greatly reduce erosion (Leys, Keon & McTanish, 1996). Table 5 is the matrix that was used to determine the erosion risk using the measurements of vegetation cover and soil dry aggregates.
Table 5: Matrix to determine erosion risk for sites where vegetation cover and soil dry aggregates has been measured (McIntosh, Leys & Biesaga, 2006).
dry aggregates | >50% | 30-50% | 10-30% | <10% |
groundcover | ||||
>70% | low | low | low | low |
50-70% | low | low | low | medium |
30-50% | low | low | medium | high |
18-30% | low | medium | high | high |
<10% | medium | high | high | high |
Assessment of soil stability.
Completed in the field as described in the data collection.
Results and discussion
Land Management Phase
Land management phase is recorded during each survey to determine management that is occurring over the year at sites surveyed within the Mallee region and also to see whether they have any impact on the risk of wind erosion.
The survey of land management practices during the post sowing sampling period showed 3.2% of the sites were chemical fallowed and 5.1% of the sites were conventionally fallowed. 16.5% of the sites were in pasture and 75.1% of the sites were in crop. The cropping sites were recorded as 55.4% cereal crops, 7.6% legume crops and 12.1% oil seed crops for the post sowing survey (Table 6 and Figure 6).
Table 6: Per cent (and number) of land management phase during the post sowing 2012 survey sampling period.
Land System | Cereal Crop | Chemical Fallow | Conventional Fallow | Improved Pasture | Legume Crop | Oilseed Crop | Volunteer Pasture |
| Boigbeat | 70% (7) | 0% (0) | 0% (0) | 0% (0) | 10.0% (1) | 10.0% (0) | 10.0% (0) |
| Central Mallee | 59.7% (46) | 1.3% (1) | 1.3% (1) | 1.3% (1) | 5.2% (4) | 10.4% (8) | 20.8% (16) |
| Culgoa | 47.1% (8) | 17.6% (3) | 0% (0) | 0% (0) | 11.8% (2) | 17.6% (3) | 5.9% (1) |
| Hopetoun | 47.8% (11) | 0.0% (0) | 4.3% (1) | 0.0% (0) | 17.4% (4) | 27.1% (5) | 8.7% (2) |
| Millewa | 40% (8) | 5.0% (1) | 30% (6) | 0.0% (0) | 0.0% (0) | 0.0% (0) | 25.0% (5) |
| Tempy | 70.0% (7) | 0.0% (0) | 0.0% (0) | 0.0% (0) | 10.0% (1) | 20.0% (2) | 0.0% (0) |
| Total | 55.4 (87) | 3.2 (5) | 5.1 (8) | 0.6 (1) | 7.6 (12) | 12.1 (19) | 15.9 (25) |
 Figure 6: Per cent of the sites under different land management phases, observed during the post sowing 2012 survey. |
Land Management Practice
Of cropped sites surveyed (117 cropped), 23.07% were observed as being managed with conventional farming practices and 76.93% were observed being managed with no-till/minimal till (Table 7, Figure 7).
Within the Boigbeat land system 100% of sites were observed as being managed in a no /minimal till land management practice in the post sowing 2012 survey.
Table 7: Percentage (and number) of cropped sites in conventional and no-till/minimal farming land management practice.
Land System | Observed Crops Sown to Conventional Farming | Observed Crops Sown to No- Till/Minimal Till Farming |
| Boigbeat | 0% (0) | 100% (10) |
| Central Mallee | 15.9% (8) | 84.91% (45) |
| Culgoa | 41.66% (5) | 58.33% (7) |
| Hopetoun | 16.66% (3) | 83.34% (15) |
| Millewa | 40.00% (6) | 60.00% (9) |
| Tempy | 55.55% (5) | 44.45% (4) |
| Total | 23.07% (27) | 76.93% (90) |
 Figure 7: Per cent of cropped sites observed with conventional and no /minimal till farm practices recorded during the post sowing survey 2012. | |||||||||||||||||||||||||||||||||||||||||||||||||
| Livestock The absence of livestock recorded at sites for the post sowing 2012 survey was 84.7% (Figure 8). The presence of stock recorded at sites indicates 0.6% were cattle, 1.3% were horses and 13.4% were sheep at the post sowing survey 2012. |  Figure 8: Per cent of sites with livestock observed to be absent/present, during the post sowing 2012 survey. | ||||||||||||||||||||||||||||||||||||||||||||||||
Standing Stubble Standing stubble has been recorded present at 100% at two land systems, Boigbeat and Tempy during the post sowing 2012 survey. A total of 68.8% of sites had standing stubble present; with the remaining 31.2% of the sites recorded with the absence of standing stubble. Standing stubble was recorded at greater than 45% of sites across all land systems during the post sowing survey (Table 8). | Table 8: Per cent (and number) of sites recorded having the presence and absence of stubble standing.
| ||||||||||||||||||||||||||||||||||||||||||||||||
Vegetation Measurements The post sowing 2012 survey reported that 42.0 % of the surveyed sites had greater than 70% vegetation cover and 31.8% had vegetation cover from 50 - 70 % rating these sites (73.8%) at low risk of erosion. Only 1.9% or three sites reported less than 10% cover, rating these sites at high risk of erosion (Figure 9 and Table 9). Table 9: The per cent (and number) of sites by land system recorded vegetation cover during the 2012 post sowing survey.
|  Figure 9: Per cent of vegetation cover at sites surveyed for the 2012 post sowing survey. |
Erosion Risk
Q Value
Table 10: The per cent (and number) of sites with low, medium and high erosion risk calculated using the formula derived by Leys (Leys et al, 2002)
LandSystem | Low | Medium | High | Not Entered |
| Boigbeat | 0% (0) | 0% (0) | 0% (0) | 100% (10) |
| Central Mallee | 45.45% (35) | 2.59% (2) | 0% (0) | 51.96 (40) |
| Culgoa | 52.95% (9) | 0% (0) | 0% (0) | 47.05% (8) |
| Hopetoun | 86.96% (20) | 8.69% (2) | 4.35% (1) | 0% (0) |
| Millewa | 95.00% (19) | 5.00% (1) | 0% (0) | 0% (0) |
| Tempy | 100.00% (10) | 0% (0) | 0% (0) | 0% (0) |
| Total | 59.24% (93) | 3.18% (5) | 0.63% (1) | 36.95% (58) |
Soil erosion risk matrix
Table 11: The per cent (and number) of sites with low, medium and high erosion risk estimated using the soil erosion risk matrix (Table 5). NB. Manual calculations based on 157 active sites.
LandSystem | Low | Medium | High | Not Entered |
| Boigbeat | 0% (0) | 0% (0) | 0% (0) | 100% (10) |
| Central Mallee | 42.85% (76) | 1.29% (1) | 3.89% (0) | 51.97 (40) |
| Culgoa | 52.95% (9) | 0% (0) | 0% (0) | 47.05% (8) |
| Hopetoun | 82.62% (19) | 8.69% (2) | 8.69% (2) | 0% (0) |
| Millewa | 90% (18) | 5% (1) | 5% (1) | 0% (0) |
| Tempy | 90% (9) | 10.00% (1) | 0% (0) | 0% (0) |
| Total | 56.05% (88) | 3.18% (5) | 3.82% (6) | 36.95% (58) |
Assessment of soil stability
Table 12: The per cent (and number) of sites with a detachment rating of 1, 2 or 3.
LandSystem | 1 | 2 | 3 | Not Entered |
| Boigbeat | 100.00% (10) | 0% (0) | 0% (0) | 0% (0) |
| Central Mallee | 48.1% (37) | 40.3% (31) | 11.7% (9) | 0% (0) |
| Culgoa | 100.00% (10) | 0% (0) | 0% (0) | 0% (0) |
| Hopetoun | 39.1% (9) | 47.8% (11) | 13% (3) | 0% (0) |
| Millewa | 20.00% (4) | 65.00% (13) | 15.00 % (3) | 0% (0) |
| Tempy | 50.00% (5) | 50.00% (5) | 0% (0) | 0% (0) |
| Total | 52.2% (82) | 38.2% (60) | 9.6% (15) | 0% (0) |
| The Q value (Table 10), and assessment of soil stability (Table 12) results were based on 157 recorded active sites in the data base. However soil dry aggregate measurements could not be obtained for 58 of the sites as these sites were too wet to sample. Hence both the Q value and soil erosion risk matrix values have 36.95% of data ‘not entered’. Results from Q value (Table 10) indicated that 59.24% (93 sites) were at a low risk of erosion and recorded only one site, 0.63% with a high risk of erosion. Soil erosion risk matrix (Table 11) indicated 56.05% (88 sites) were at a low risk of erosion, with 3.18% at medium risk and 3.82% of the sites at a high risk of erosion. If percentages are taken of only the sites where measurements occurred, then 94% (Q value) and 89% (soil erosion risk matrix) of the sites were assessed at low risk of erosion. Assessment of soil stability (Table 12) recorded 52.2% (82 sites) were at a low risk of erosion and 38.2% (60 sites) were at a medium risk and 9.6% (15 sites) at high risk of erosion. Results from the Q value and soil erosion matrix were more closely aligned than the results from the assessment of soil stability. Both the Q value and soil erosion matrix methods are based on actual measurements of soil dry aggregate and vegetation cover whereas the soil stability measurement is a visual record with the potential for greater variation in the results making it a less accurate assessment. However results must be viewed with caution due to fifty eight sites not being recorded for soil dry aggregates due to a rain event. | 
Figure 10: Comparison of the three methods or risk of erosion post sowing 2012. |
Conclusion
During the post sowing survey 2012:
- § Soil erosion soil matrix resulted in 56.05% of sites with a low risk of erosion (although 36.95% of sites were not assessed).
§ 73.8% of sites had greater than 50% vegetation coverage rating these sites as a low risk of erosion.
§ 55.4% of the sites were sown to cereal crops, 7.6% of the sites were sown to legume crops and 12.1% to oil seed crops.
§ 3.2% of the sites were in a chemical fallow management and 5.1% of the sites were in conventional fallow.
§ Sites under pasture management were 8.2%.
§ 77.57% of cropped sites were observed as being managed in a no-till/minimal till management practice and the remaining 22.43% were being managed in a conventional farming practice.
- § Continue collaborating with NSW, SA and WA to continue to develop soil erosion monitoring protocols, in particular to develop methods to measure the risk of erosion.
Agricultural Bureau of South Australia. (2002). Better Soils: Module 1 How healthy is your soils? http://bettersoils.soilwater.com.au/ (external link)
Agricultural Bureau of South Australia. (2002). Better Soils: Module 1 How healthy is your soils? http://bettersoils.soilwater.com.au/
Boucher, S. (2005a). Recommendations for benchmarking and monitoring soil erosion by wind. Department of Primary Industries.
Clune, T. (2005). Wind erosion in the Mallee. A milestone report for CMA project 04/133. PIRVic, Department of Primary Industries Victoria
Drendel, H (2010). Mallee soil erosion and land management survey – Post sowing 2010. Department of Primary Industries.
Gordon, J (2008). Mallee soil erosion and land management survey – Post cropping 2008. Department of Primary Industries.
Levy, E.B. & Madden, E.A. (1993) A point method of pasture analysis. NZ Journal of Agriculture, 20, 267-79.
Leys, J., Heidenreich, S., Murphy, S., Koen, T. & Biesaga, K. (2007). Lower Murray Darling CMA Catchment Health Report Card - Wind Erosion. Department of Environment and Climate Change, NSW.
Leys, J., Koen, T. & McTanish, G.H. (1996) The effect of dry aggregation and percentage of clay on sediment flux as measured by a portable field wind tunnel. Aust. J. Soil. Res.(34), 849-61.
Leys, J., Semple, W.S., Raupach, M.R., Findlater, P. & Hamilton, G.J. (2002). Measurement of Size Distributions of Dry Soil Aggregates. In Soil physical Measurement and Interpretation for Land Evaluation (eds N. McKenzie, K. Coughlan & H. Cresswell). CSIRO Publishing, Collingwood
McCord, A. (2008). State Survey Monitoring Manual Cropping. (ed P.L.I. Land Resource Unit), Vol. 2006. PIRSA.
McIntosh, G., Leys, J. & Biesaga, K. (2006). Estimating groundcover and soil aggregation for wind erosion control on cropping land. Farmtalk fact sheet. Mallee Sustainable Farming.
Price, J and Wakefield, L (2009). Mallee soil erosion and land management survey – Post cropping 2009. Department of Primary Industries.
Rowan, J.N. & Downes, R.G. (1963) A study of the land of north-western Victoria Soil Conservation Authority, Victoria
Wakefield, L. (2007b). Monitoring Mallee Soil Erosion Summer Survey Final Report 2007. Department of Primary Industries Victoria
Wakefield, L. (2008a). Mallee soil erosion and land management survey - Late summer 2008 report - Draft. Department of Primary Industries
Wakefield, L. (2008b). Mallee soil erosion and land management survey - Post cropping and spring 2007 report. Department of Primary Industries
© State of Victoria (Agriculture Victoria) 1996 - .

This work, Victorian Resources Online, is licensed under a Creative Commons Attribution 4.0 licence. You are free to re-use the work under that licence, on the condition that you credit the State of Victoria (Agriculture Victoria) as author, indicate if changes were made and comply with the other licence terms.
The licence does not apply to ‘branding’ or some ‘images or photographs’ that may be owned by third parties. We ask you to seek prior approval to use images using the VRO feedback form. Access to higher quality images can also be provided on request.
This page was last updated on .