
Stratford (Sf)
|
Geology |  | 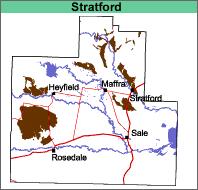 |
Level plain. This plain is an elevated weakly dissected alluvial terrace.
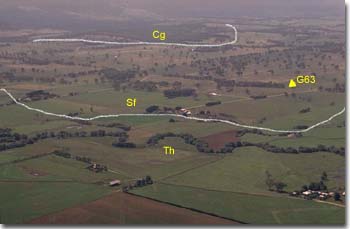 The Stratford unit (Sf) west of Heywood showing the location of Site GP63. Note: Thomson (Th) map unit in the foreground. | 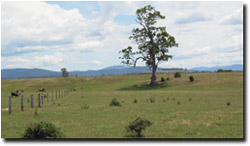 Looking from the Newry mapping unit in the foreground towards the terrace and higher level Stratford mapping unit. |
Original Vegetation The original vegetation was a grassy open forest of Eucalyptus tereticornis which has now largely been cleared. | 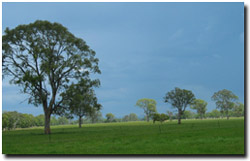 Remnant Eucalyptus tereticornis trees on the Stratford mapping unit near Newry. |
This map unit was identified and named by Ward (1977). Skene and Walbran (1948,1949) mapped such areas into the Tanjil series which they describe as ridges and uplands. It is included within the Valencia Land System and possibly the Red Gum 2 Land System as described by Aldrick et al. (1992).
| Soils Most of the soils on this map unit are texture contrast soils which means that they have light textured surface soils (sandy loams to sandy clay loams) abruptly overlying a clay subsoil. Gravel and stones (up to 100 mm in diameter) may occur throughout the profile on hill slopes and the flanks of drainage lines. Small areas of sand deposits occur immediately east of Blackall Creek. One example is some dunes just north of Stratford. These dunes are probably formed from sand blown out of the creek bed. Most of the surface soils are generally dark greyish brown loamy sands to sandy loams. They have a bleached sub-surface (typically pale brown to pale brownish grey) of similarly textured material abruptly overlying, at about 20 to 40 cm, mottled brown and yellowish brown clays. Mottled clays or sandy clays normally continue to at least 1 m often accompanied by gravel and stones. The soils are most likely to be classified as Brown or Yellow Sodosols using the Australian Soil Classification. | 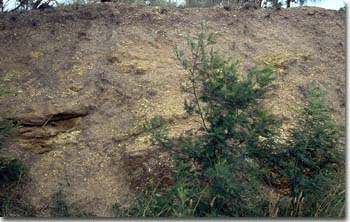 Road cutting near Stratford showing river gravels in the deep subsoil. |
Chemical and Physical Analysis
Four soil pits have been dug on this map unit and are described below (Sites GP34, GP38, GP63). A further four profiles are provided below, one from Aldrick et al. (1992) and three profiles from Skene and Walbran (1948,1949).
The surface soils generally have a pH between 5.5 and 6.0 in the surface soils and usually become alkaline with depth. Magnesium is the dominant cation in the deep subsoil, with calcium to magnesium ratios around 0.1 to 0.3. The subsoils are generally sodic.
GP34. Soil Pit Site (Sargeant and Imhof, 2000)
Depth cm | Texture | pH | EC dS/m | Carbon % | Ca meq % | Mg meq % | K meq % | Na meq % | ESP % | Coarse sand % | Fine sand % | Silt % | Clay % |
0-5 | FSL | 5.7 | 0.07 | 2.9 | 2.5 | 2.2 | 0.3 | 0.3 | 9 | 51 | 24 | 13 | |
5-20 | FSL | 7.7 | 0.11 | 1.2 | 2.8 | 0.3 | 0.8 | 5 | 50 | 25 | 19 | ||
20-70 | MHC | 7.8 | 0.31 | 1.9 | 7.0 | 0.3 | 3.1 | 26 | 3 | 33 | 18 | 44 | |
70-100 | LC | 8.5 | 0.40 | 1.7 | 7.1 | 0.2 | 4.0 | 31 | 3 | 33 | 18 | 46 | |
100+ | 7.5 | 2.60 | 0.6 | 7.6 | 0.2 | 5.7 | 41 | 4 | 25 | 25 | 46 |
GP38. Soil Pit Site (Sargeant and Imhof, 2000)
Depth cm | Texture | pH | EC dS/m | Carbon % | Ca meq% | Mg meq% | K meq% | Na meq% | ESP % | Coarse sand % | Fine sand % | Silt % | Clay % |
0-17 | SL | 5.8 | 0.06 | 2.0 | 2.7 | 2.0 | 0.3 | 0.4 | 20 | 41 | 17 | 17 | |
17-20 | SL | 6.4 | <0.05 | 1.1 | 1.3 | 0.1 | 0.3 | 11 | 30 | 39 | 17 | 3 | |
20-60 | MHC | 6.5 | <0.05 | 3.0 | 10 | 0.4 | 1.8 | 12 | 5 | 8 | 2 | 79 | |
60-90 | MHC | 7.3 | 0.24 | 1.6 | 32 | 0.2 | 12.0 | 27 | 3 | 5 | 1 | 83 | |
90+ | MHC | 7.1 | 0.28 | 1.0 | 10 | 0.2 | 13.0 | 54 | 9 | 14 | 6 | 67 |
GP63. Soil Pit Site (Sargeant and Imhof, 2000)
Depth cm | Texture | pH | EC dS/m | Cl % | Nitrogen % | Carbon % | Ca meq% | Mg meq% | K meq% | Na meq% | H meq% | ESP % | Coarse sand % | Fine sand % | Silt % | Clay % | LAT % |
0-2 | FSL | 6.4 | 0.26 | <.02 | 0.48 | 4.5 | 9.3 | 1.9 | 0.7 | 0.2 | 12.0 | 1 | |||||
2-10 | FSL | 6.0 | 0.18 | 4.7 | 1.0 | 0.2 | 0.6 | 3.1 | 5 | 7 | 41 | 34 | 13 | 1 | |||
10-15 | FSL | 1 | |||||||||||||||
15-25 | LC | 6.8 | 0.12 | 2.8 | 3.0 | 0.1 | 0.7 | 11 | 9 | 37 | 32 | 21 | 1 | ||||
25-50 | MC | 7.2 | 0.22 | 3.0 | 7.9 | 0.2 | 2.0 | 16 | 6 | 23 | 27 | 44 | 1 | ||||
50-90 | MC | 7.6 | 0.41 | 0.05 | 0.9 | 7.0 | 0.2 | 2.7 | 27 | 8 | 29 | 27 | 37 | 1 | |||
90+ | LC | 7.9 | 0.55 | 0.06 | 0.8 | 8.0 | 0.2 | 3.4 | 28 | 4 | 23 | 30 | 42 | 1 |
GP77. Soil Pit Site (Sargeant and Imhof, 2000)
Depth cm | Texture | pH | EC dS/m | Nitrogen % | Carbon % | Ca meq% | Mg meq% | K meq% | Na meq% | ESP % | Coarse sand % | Fine sand % | Silt % | Clay % | LAT % |
0-10 | FSL | 5.3 | 0.23 | 0.23 | 2.4 | 2.3 | 0.9 | 1.3 | 0.2 | 13 | 46 | 25 | 10 | 1 | |
10-40 | FSL | 5.5 | 0.06 | 0.8 | 0.3 | 0.5 | 0.1 | 12 | 50 | 28 | 10 | 1 | |||
40-70 | LMC | 7.3 | 0.09 | 2.8 | 6.1 | 1.6 | 0.5 | 17 | 3 | 29 | 22 | 50 | 2 | ||
70-100 | MC | 7.6 | 0.08 | 2.6 | 7.9 | 1.2 | 0.8 | 16 | 2 | 18 | 33 | 48 | 1 | ||
100+ | MC | 7.7 | 0.12 | 1.9 | 7.4 | 0.4 | 1.3 | 29 |
Tanjil loam, (Skene and Walbran, 1948)
Depth cm | Texture | pH | EC dS/m | Cl % | Nitrogen % | Carbon % | Ca meq% | Mg meq% | K meq% | Na meq% | H meq% | ESP % | Gravel % | Coarse sand % | Fine sand % | Silt % | Clay % | LAT % |
0-10 | L | 5.6 | 0.07 | .008 | 0.153 | 2.01 | 2.0 | 1.3 | 0.3 | 0.2 | 6.9 | 2 | 2 | 26 | 45 | 14 | 11 | 1 |
10-22 | SL | 6.2 | 0.13 | .003 | 9 | 33 | 43 | 13 | 10 | <1 | ||||||||
22-48 | HC | 6.8 | 0.09 | .009 | 2.4 | 12.9 | 0.6 | 2.8 | 8.9 | 10 | 5 | 7 | 2 | 80 | 1 | |||
48-83 | HC | 6.6 | 0.30 | .043 | 3 | 4 | 2 | 84 | 1 | |||||||||
89-107 | HC | 5.8 | 0.43 | .066 | 14 | 14 | 6 | 62 | 1 | |||||||||
107-188 | SC | 6.6 | 0.24 | .029 | 29 | 22 | 11 | 33 | <1 |
Tanjil sandy loam, gravelly phase (Skene and Walbran, 1949)
Depth cm | Texture | pH | EC dS/m | Cl % | Nitrogen % | Carbon % | Gravel % | Coarse sand % | Fine sand % | Silt % | Clay % | LAT % |
0-10 | SL | 5.4 | 0.04 | .003 | 0.095 | 1.47 | 28 | 45 | 32 | 13 | 7 | 1 |
10-25 | GRS | 6.2 | 0.04 | .004 | 48 | 48 | 33 | 10 | 7 | <1 | ||
25-33 | HC | 6.5 | 0.26 | .033 | 14 | 11 | 11 | 7 | 66 | 1 | ||
56-63 | HC | 6.1 | 0.32 | .049 | 23 | 13 | 13 | 8 | 63 | 1 | ||
63-81 | GRC | 6.1 | 0.30 | .045 | 23 | 16 | 16 | 4 | 51 | 1 | ||
122-137 | S&GR | 6.2 | 0.12 | .014 | 32 | 24 | 24 | 8 | 18 | <1 |
Tanjil loam, gravelly phase, (Skene and Walbran, 1949)
Depth cm | Texture | pH | EC dS/m | Cl % | Nitrogen % | Carbon % | Gravel % | Coarse sand % | Fine sand % | Silt % | Clay % | LAT % |
0-13 | L | 5.9 | 0.06 | .005 | 0.118 | 2.02 | 34 | 36 | 16 | 10 | 1 | |
13-18 | L | 5.9 | 0.06 | .006 | 66 | 37 | 33 | 14 | 12 | 1 | ||
20-30 | HC | 6.6 | 0.14 | .014 | 1 | 16 | 15 | 8 | 55 | 2 | ||
30-71 | HC | 6.6 | 0.55 | .075 | 5 | 10 | 8 | 6 | 69 | 1 | ||
81-102 | GC | 5.9 | 0.61 | .073 | 42 | 27 | 14 | 6 | 50 | 1 |
Profile 65, Red Gum 1,2, (Aldrick et al., 1992)
Depth cm | Texture | pH | EC dS/m | Cl % | Nitrogen % | Carbon % | Ca meq% | Mg meq% | K meq% | Na meq% | H meq% | ESP % | Gravel % | Coarse sand % | Fine sand % | Silt % | Clay % |
0-10 | SL | 4.7 | 0.63 | .007 | 0.18 | 3.2 | 1.8 | 1.0 | 0.2 | 0.2 | 12.9 | 1 | 1 | 22 | 55 | 9 | 6 |
10-18 | SL | 4.6 | 0.64 | .007 | 0.08 | 2.3 | 0.2 | 0.6 | 0.5 | 0.5 | 20.7 | 2 | 1 | 24 | 53 | 12 | 7 |
30-40 | SL | 5.9 | 0.13 | .001 | 0.2 | 0.2 | 0.02 | 0.02 | 1.6 | 1 | 6 | 24 | 58 | 17 | 3 | ||
40-50 | SL | 6.2 | 1.10 | .011 | 0.2 | 2.6 | 0.9 | 0.9 | 2.8 | 13 | 7 | 20 | 51 | 16 | 13 | ||
50-60 | HC | ||||||||||||||||
60-90 | HC | 7.4 | 2.70 | .037 | 0.2 | 7.5 | 0.6 | 12.4 | 1.5 | 21 | 1 | ** | ** | ** | ** |
The following abbreviations are used to describe field texture: S - sand; LS - loamy sand; ClS - clayey sand; SL - sandy loam; L - loam; CL - clay loam; SCL - sandy clay loam; SC - sandy clay; FSCL - fine sandy clay loam; FSC - fine sandy clay; LC - light clay; MC - medium clay; HC - heavy clay; GR - gravel; ZL - silty loam; ZCL - silty clay loam; ZLC - silty light clay; ZMC - silty medium clay.
Particle size distribution data given for Skene and Walbran (1948, 1949) does not include the water content of the soil. As a result the coarse sand, fine sand, silt, clay and loss on acid treatment (LAT) may not add up to 100%. Aldrick et al. (1992) does not provide LAT data.
Other symbols include: pH - analysed in water; EC - electrical conductivity; Cl - chloride; Ca - exchangeable calcium; Mg - exchangeable magnesium, K - exchangeable potassium; Na - exchangeable sodium; H - exchangeable hydrogen; ESP - exchangeable sodium percentage.
For Soil Pit Sites (Sargeant and Imhof, 2000) exchangeable cations have been determined using Gilman method (where pH >7) and Tucker method (pH <7). Exchangeable Sodium % (ESP) has been calculated here as the percentage of sodium in relation to the sum of the exchangeable basic cations.
Land Use
These soils tend to be waterlogged in wetter months and dry out rapidly in summer. They are mostly used for grazing.
| Stratford and Winnindoo (Sf:Wi) This map unit describes areas with at least 30% of either map unit. |  |
© State of Victoria (Agriculture Victoria) 1996 - .

This work, Victorian Resources Online, is licensed under a Creative Commons Attribution 4.0 licence. You are free to re-use the work under that licence, on the condition that you credit the State of Victoria (Agriculture Victoria) as author, indicate if changes were made and comply with the other licence terms.
The licence does not apply to ‘branding’ or some ‘images or photographs’ that may be owned by third parties. We ask you to seek prior approval to use images using the VRO feedback form. Access to higher quality images can also be provided on request.
This page was last updated on .