
Nuntin (Nt)
|
Geology |  |  |
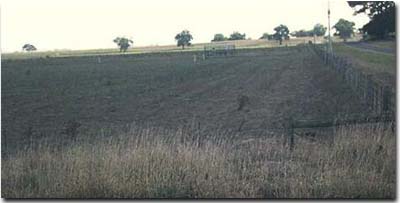 East-west dune (background) in the Nuntin mapping unit. |
Original Vegetation
No observations.
Previous Maps and Reports
This map unit is named after the Nuntin soil association mapped by Skene and Walbran (1949). The Nuntin unit from the current survey mainly comprises the following Skene and Walbran soil units: Nuntin sandy loam, Nuntin sandy loam “heavy phase”, Type J and some small areas of Clydebank sandy loam. Ward (1977) mapped these soils into the Seacombe association. The Nuntin Land System (Aldrick et al., 1992) also includes areas mapped here as Nuntin, as well as some related alluvial soils.
Soils
These soils include a range of sandy soils. The surface soils are generally dark greyish brown sands or sandy loams with strong brown to brownish yellow sands occurring at about 30 cm. A sandy clay loam to sandy clay horizon at about 60 cm is usually present. These soils are most likely to be classified as Brown or Red Chromosols (with deep sandy surface horizons) or Tenosols (where less subsoil development has occurred).
Chemical and Physical Analysis
No pits have been dug in this map unit. However, data from three sites from Skene and Walbran (1949) and one site from Aldrick et al., (1992) are described below. The pH of the surface soils appears to be above 5.5 and the subsoils are not likely to be sodic.
Nuntin sandy loam, (Skene and Walbran ,1949)
Depth cm | Texture | pH | EC dS/m | Cl % | Nitrogen % | Carbon % | Coarse sand % | Fine sand % | Silt % | Clay % | LAT % |
13 | SL | 5.5 | 0.04 | .003 | 0.146 | 1.57 | 34 | 40 | 10 | 12 | 1 |
28 | SL | 5.7 | 0.04 | .005 | 33 | 41 | 10 | 14 | 1 | ||
69 | S | 6.9 | 0.05 | .006 | 29 | 50 | 7 | 11 | 1 | ||
94 | SC | 6.8 | 0.07 | .008 | 23 | 44 | 6 | 23 | 1 | ||
152 | ClS | 7.2 | 0.04 | .004 | 33 | 45 | 4 | 15 | 1 |
Nuntin sandy loam, heavy phase, (Skene and Walbran ,1949)
Depth cm | Texture | pH | EC dS/m | Cl % | Nitrogen % | Carbon % | Coarse sand % | Fine sand % | Silt % | Clay % | LAT % |
0-25 | SL | 5.8 | 0.05 | .003 | 0.084 | 0.89 | 31 | 45 | 13 | 10 | 1 |
25-46 | S | 6.1 | 0.05 | .005 | 31 | 51 | 10 | 5 | 1 | ||
46-61 | SC | 6.4 | 0.04 | .003 | 26 | 34 | 10 | 26 | 1 | ||
61-86 | LC | 6.5 | 0.05 | .005 | 24 | 26 | 9 | 37 | 1 | ||
86-104 | LC | 7.1 | 0.05 | .004 | 29 | 30 | 7 | 31 | 1 | ||
104-137 | SC | 7.1 | 0.05 | .005 | 29 | 35 | 7 | 25 | 1 |
Profile 20, Nuntin land system, (Aldrick et al., 1992)
| Depth cm | Texture | pH | EC dS/m | Cl % | Nitrogen % | Carbon % | Ca meq% | Mg meq% | K meq% | Na meq% | H meq% | ESP % | Gravel % | Coarse sand % | Fine sand % | Silt % | Clay % |
| 0-10 | SL | 5.7 | 0.21 | .003 | 0.22 | 2.54 | 1.8 | 1.2 | 1.6 | 0.5 | 7.5 | 4 | 20 | 53 | 10 | 11 | |
| 10-20 | LS | 5.5 | 0.06 | .003 | 0.14 | 1.63 | 0.7 | 0.3 | 1.2 | 0.4 | 9.1 | 3 | 24 | 54 | 12 | 9 | |
| 20-30 | LS | 5.1 | 0.04 | .001 | 0.07 | 0.84 | 0.5 | 0.1 | 0.6 | 0.2 | 6.8 | 2 | 23 | 55 | 12 | 9 | |
| 30-42 | LS | 5.1 | 0.02 | .001 | 0.5 | 0.05 | 0.4 | 0.1 | 3.9 | 2 | 1 | 24 | 56 | 12 | 7 | ||
| 42-60 | L | 5.7 | 0.03 | .002 | 1.1 | 1.0 | 0.3 | 0.2 | 3.6 | 3 | 1 | 21 | 54 | 12 | 12 |
The following abbreviations are used to describe field texture: S - sand; LS - loamy sand; ClS - clayey sand; SL - sandy loam; L - loam; CL - clay loam; SCL - sandy clay loam; SC - sandy clay; FSCL - fine sandy clay loam; FSC - fine sandy clay; LC - light clay; MC - medium clay; HC - heavy clay; GR - gravel; ZL - silty loam; ZCL - silty clay loam; ZLC - silty light clay; ZMC - silty medium clay.
Particle size distribution data given for Skene and Walbran (1948, 1949) does not include the water content of the soil. As a result the coarse sand, fine sand, silt, clay and loss on acid treatment (LAT) may not add up to 100%. Aldrick et al. (1992) does not provide LAT data.
Other symbols include: pH - analysed in water; EC - electrical conductivity; Cl - chloride; Ca - exchangeable calcium; Mg - exchangeable magnesium, K - exchangeable potassium; Na - exchangeable sodium; H - exchangeable hydrogen; ESP - exchangeable sodium percentage.
Land Use
As the soils are light textured, they absorb water very readily under irrigation but tend to dry out rapidly during summer. The undulating topography is a constraint and much of the area is above gravity supply level.
© State of Victoria (Agriculture Victoria) 1996 - .

This work, Victorian Resources Online, is licensed under a Creative Commons Attribution 4.0 licence. You are free to re-use the work under that licence, on the condition that you credit the State of Victoria (Agriculture Victoria) as author, indicate if changes were made and comply with the other licence terms.
The licence does not apply to ‘branding’ or some ‘images or photographs’ that may be owned by third parties. We ask you to seek prior approval to use images using the VRO feedback form. Access to higher quality images can also be provided on request.
This page was last updated on .