
Loy Yang (Ly)
|
Geology |  | 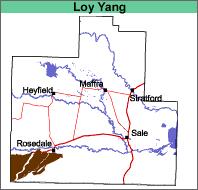 |
Landform
Undulating plain that is weakly dissected.
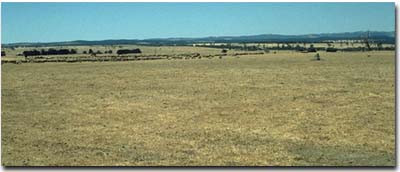 Loy Yang mapping unit landscape. |
Original Vegetation
The original vegetation was a grassy open forest of red gum (Eucalyptus tereticornis). It is now largely cleared.
Previous Maps and Reports
The Loy Yang map unit is included within the Redgum 1 and Westbury 1 Land Systems as described by Aldrick et al. (1992). This unit also incorporates soils that Poutsma and Turvey (1979) described as Maryvale.
Soils
The soils are texture contrast soils which means that they have light textured surface soils (sandy loams to sandy clay loams) abruptly overlying medium to heavy clays.
The surface soils are generally greyish brown hard-setting sandy loams to sandy clay loams. The sub-surface is always conspicuously bleached (typically pale brown to pale brownish grey) and often contain iron nodules. Brown or yellowish brown mottled mediums to heavy clays occur abruptly at 30 cm to 45 cm. These soils are generally classified as Brown or Yellow Sodosols using the Australian Soil Classification.
Chemical and Physical Analysis
Analyses were carried out for two soil pits on this map unit near Longford (Sites GP32 and GP33). The land recently cleared of pine vegetation, showed that the surface soils have a pH between 5.5 and 6.0 and that the profile remains acid throughout. The soils are strongly sodic in the subsoil, as well as being magnesic.
GP32 (Sargeant and Imhof, 2000).
Depth cm | Texture | pH | pH CaCl2 | EC dS/m | Organic Carbon % | Ca meq% | Mg meq% | K meq% | Na meq% | H meq% | ESP % | Wilting Point pF 4.2 | Coarse sand % | Fine sand % | Silt % | Clay % | LAT % |
0-20 | SL | 5.5 | 4.6 | 0.06 | 2.7 | 2.3 | 0.62 | 0.11 | 0.14 | 15 | 1 | 8.6 | 5 | 39 | 30 | 18 | 10 |
20-40 | SL | 5.6 | 4.6 | <0.05 | 0.75 | 0.2 | <0.05 | 0.06 | <10 | 1 | 3.6 | 2 | 33 | 36 | 21 | 9 | |
40-75 | HC | 6.4 | 5.0 | 0.09 | 0.62 | 7.8 | 0.11 | 2.1 | 20 | 17 | 19 | 18 | 12 | 48 | |||
75+ | HC | 6.4 | 5.0 | 0.09 | 0.13 | 7 | 0.08 | 2.2 | 24 |
GP33 (Sargeant and Imhof, 2000).
Depth cm | Texture | pH | pH CaCl2 | EC dS/m | Organic Carbon % | Ca meq% | Mg meq% | K meq% | Na meq% | H meq% | ESP % | Wilting Point pF 4.2 | Coarse sand % | Fine sand % | Silt % | Clay % | LAT % |
0-20 | SL | 5.6 | 4.6 | 0.08 | 2 | 1.1 | 1.4 | 0.41 | 0.29 | 15 | 3 | 7.8 | 6 | 31 | 35 | 19 | 13 |
20-35 | SL | 5.6 | 4.6 | <0.05 | 0.71 | 1.7 | 0.26 | 0.17 | 20 | 2 | 5.4 | 6 | 28 | 36 | 19 | 17 | |
35-70 | MC | 5.9 | 4.7 | 0.1 | 0.82 | 7.9 | 0.15 | 1.6 | 16 | 19 | 18 | 16 | 9 | 54 | |||
70+ | MC | 6.0 | 4.7 | 0.14 |
The following abbreviations are used to describe field texture: S - sand; LS - loamy sand; ClS - clayey sand; SL - sandy loam; L - loam; CL - clay loam; SCL - sandy clay loam; SC - sandy clay; FSCL - fine sandy clay loam; FSC - fine sandy clay; LC - light clay; MC - medium clay; HC - heavy clay; GR - gravel; ZL - silty loam; ZCL - silty clay loam; ZLC - silty light clay; ZMC - silty medium clay.
Other symbols include: pH - analysed in water; EC - electrical conductivity; Cl - chloride; Ca - exchangeable calcium; Mg - exchangeable magnesium, K - exchangeable potassium; Na - exchangeable sodium; H - exchangeable hydrogen; ESP - exchangeable sodium percentage.
For Soil Pit Sites (Sargeant and Imhof, 2000) exchangeable cations have been determined using Gilman method (where pH >7) and Tucker method (pH <7). Exchangeable Sodium % (ESP) has been calculated here as the percentage of sodium in relation to the sum of the exchangeable basic cations.
Land Use
All of the soils on this map unit are cleared and used for grazing. During wetter periods of the year, the surface soils may become saturated as the subsoil clay restricts the downward movement of water.
© State of Victoria (Agriculture Victoria) 1996 - .

This work, Victorian Resources Online, is licensed under a Creative Commons Attribution 4.0 licence. You are free to re-use the work under that licence, on the condition that you credit the State of Victoria (Agriculture Victoria) as author, indicate if changes were made and comply with the other licence terms.
The licence does not apply to ‘branding’ or some ‘images or photographs’ that may be owned by third parties. We ask you to seek prior approval to use images using the VRO feedback form. Access to higher quality images can also be provided on request.
This page was last updated on .