
Diagrammatic representations of Terrace development
The following animation shows how terraces are created by stream activity over hundreds of thousands of years. Click on the animation to start.
 Figure 1: Deposition of the sediments on which the Briagolong Unit soils are formed. |
 Figure 2: Erosion of the Briagolong land-surface following a period of uplift or sea level change |
 Figure 3: Valley in-filled with later sediments on which the Stratford Unit soils are formed |
 Figure 4: Erosion of the Stratford Unit land-surface following a period of uplift or seal level change. |
 Figure 5: Valley in-filled with later sediments (Qp6a, 6b) - see table below |
Geological Subdivision | Landform | Landform Elements | Map Unit |
Qp6a | Terrace | Terrace plain | |
Qp6b | Stagnant alluvial plain | Levee | |
Backplain | |||
Dune | |||
Swamp |
 Figure 6: Major sea level change associated with the last ice age resulted in erosion of late Pleistocene sediments |
 Figure 7: Present floodplains of Newry, Thomson, and La Trobe Units become in-filled with sediments |
 Figure 8: Generalised cross-section between Heyfield and north of Latrobe River near Rosedale (diagrammatic only - not to scale) |
 Figure 9: Generalised cross-section across Avon River and related terraces (diagrammatic only - not to scale) |
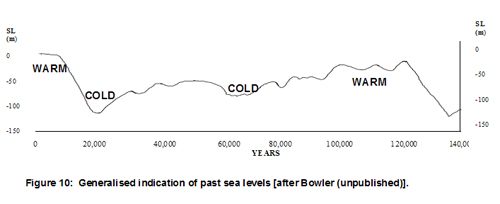 Figure 10: Generalised indication of past sea levels |
© State of Victoria (Agriculture Victoria) 1996 - .

This work, Victorian Resources Online, is licensed under a Creative Commons Attribution 4.0 licence. You are free to re-use the work under that licence, on the condition that you credit the State of Victoria (Agriculture Victoria) as author, indicate if changes were made and comply with the other licence terms.
The licence does not apply to ‘branding’ or some ‘images or photographs’ that may be owned by third parties. We ask you to seek prior approval to use images using the VRO feedback form. Access to higher quality images can also be provided on request.
This page was last updated on .