
1976 to 1993: Dryland surveys, research and the adoption of computer technology
Back | Statewide Soil
In early 1976 J.J Martin took over from J. Newell (retired) as unit leader. Mr N. S. Badawy continued the Wimmera regional survey and associated research and extension activities. The first half of this period saw the completion and publication, with one exception, of the detailed surveys of the irrigation districts as well as the publication of a number of regional dryland surveys. The latter half of the period saw considerable change in emphasis in the kind of data collected, its management and presentation through the adoption of computer technology.
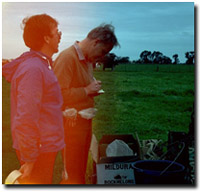
By 1987 three of the remaining irrigation district surveys had been published. These were Torrumbarry (Sargeant, Newell and Walbran, 1978), Nangiloc (Mikhail and Martin, 1986) and Bacchus Marsh (Carr, Mikhail and Martin, 1987). The total area mapped in these large-scale (ie detailed) surveys was about 139 000 hectares. Also by this date an additional 15 surveys, with a wide variety of objectives, had been completed in different areas of the state. Published map scale varied from 1:10 000 (very high intensity) for research Institute surveys to 1:250 000 (reconnaissance level) for the southwestern Victoria Soils and Landform Survey (Maher and Martin 1987). The two major regional surveys were the Eastern Wimmera (Badawy, 1984) and the South Western Victoria Soils and Landform survey. The purpose of this particular survey, which was externally funded by the National Soil Conservation Program, was to provide basic information for advice regarding the management of agriculture. This was done by producing maps delineating areas of land of similar capacity with regard to major agricultural uses e.g. annual crops (cereals), deep-rooted perennials (orchards) and pastures. During the project Mr Maher sampled and classified soil profiles at more than 1 500 sites in order to identify, characterise and map the distribution of the various soils and their associated landforms. Within the 2.4 million hectare region 237 different soils were recognised. The total area mapped in these two projects was 3.1 million hectares. Other important regional dryland surveys included Horsham, 250 000 hectares, (Badawy 1977), Yarra Glen, 62 000 hectares (Maher 1979) and Kalkee, 17 100 hectares (Badawy 1977). The remaining dryland surveys accounted for an additional 9 000 hectares.
 John Maher and John Martin sampling soils in the field | A number of these dryland surveys with specific objectives demonstrated an increasingly wider use of survey data. Some examples of these projects are given below. A capability class map for general intensive agriculture was included in the survey report of the Werribee State Research Farm (Maher and Martin 1979). Provisional land capability maps for pasture, annual crop and deep-rooted perennial crop production were constructed for the Yarra Glen survey. Detailed soil surveys were carried out to assist in the investigation of vine vigour decline and to act as a guide to replanting in the vineyards of Great Western, Halls Gap and Ararat districts (Badawy, 1982). Soil surveys were also carried out to support field investigations to determine optimum irrigation and disposal practices for sewerage and industrial effluent on the Latrobe Valley Water and Sewerage Board Farm at Dutson Downs (Mikhail, Peverill and Martin, 1984). In the Upper Yarra Region, sub-catchment surveys were conducted to supply information regarding the use of buffer zones in controlling non-point sources of pollution in agricultural land (Imhof, Maher, Martin and Hilliard, 1985). |
In addition to the Wimmera regional survey, Mr Badawy carried out a number of research projects including the effect of soil profile morphology on non-irrigated sunflower productivity (Badawy 1979), on soil factors affecting wheat production (Badawy, Lewis and Ford, 1980) and on the effect of micro-relief (gilgai) on lupin productivity (Badawy and Mahoney, 1984). He also classified the soils of the sites used for cereal variety comparisons from 1977 to 1979 (Badawy 1977, Badawy and Lewis 1978 and 1979). During this period, other research publications in which soils unit staff were either the sole or co-authors included “Irrigation and Land Use of Mallee Soils (Mikhail and Sargeant, 1979), the effect of land management on the structure of intensively cropped soils in West Gippsland (Hirst, Imhof and Weston, 1992) and “Soil Sodicity in Victoria” (Ford, Martin, Rengasamy, Boucher and Ellington, 1993). At this time staff of the unit managed a small soil physics laboratory which supported field based projects. Interest in developing and assessing techniques (for possible future use in the laboratory) which would assist in the monitoring of soil structural status (a vital component in the wider study of soil structural decline), resulted in a review of “wet-sieving” methodology (Imhof, 1988).
The adoption of computer technology from the late 1980’s together with changing client demands, new departmental policies and staff structure resulted in new projects and approaches to the problems of data acquisition, management and presentation. Although 118 reports were listed in a survey directory (Martin, 1987) most of the data were not easily accessible. By the following year, the collation and computer storage of the Department’s soil and land survey database had become a major project. This was considered to be an essential component of the geographic information system (GIS) then under development within the State Chemistry Laboratory. An early and essential first stage project with regards to the establishment of the computer soil survey database was the graphics input of the large numbers of soil maps. Over 150 large scale and intricate soil map sheets were re-drafted by unit staff prior to scanning and editing. These now reside as part of the Department's corporate database. At this stage the Soils Unit had become the Environmental Sciences and Land Studies Unit within the Research Branch which was under the management of Mr E. Hilliard. | 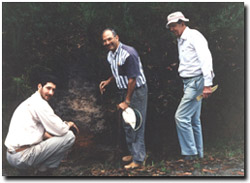 (l-r) Mark Imhof, Nabil Badawy and Ray Isbell checking a soil profile south of Colac, as part of testing the Australian Soil Classification. |
Designed to support sustainable land use, programs such a GIS had a number of key aspects and specific benefits including more effective evaluation of management options at policy, farming, industry and farm levels. These aspects and benefits were summarised by Weston (1991). The complex nature of the system and operation of it by staff members resulted in considerable in-house training and the production of a series of geographic information technical notes.
While R.S. Belcher had earlier foreshadowed the use of remote sensing as an aid to the work of the Department (Belcher, 1975) the eventual availability of relatively inexpensive computer based image processing software allowed the integration of satellite remotely sensed data with other acquired data into the developing GIS (Weston, 1988). The usefulness of remotely sensed data to the department’s information needs, in terms of recognition of significant geographic soil and land management production units, depends on a (demonstrated) adequately strong correlation between image based patterns on the one hand and actual geographic units or sites on the other. This in turn requires field traverses to collect specific data sets that will characterise the observed image patterns (Maher 1990). The first field based pilot study of the GIS, incorporating remotely sensed data, was a project covering about 53 000 hectares north of Horsham (Weston, 1989). The area was selected because of existing soils knowledge and the local need for detailed soil based management information. Specific objectives included an investigation of the feasibility of using remotely sensed data for land cover and crop identification. Initial results of this study in terms of site specific accuracy, ie. the agreement between ground observations and relevant image polygon classification, were encouraging (Maher, 1989). A summary of some of the remote sensing work done by the Department of Agriculture was presented as a paper by Imhof and Weston (1994) to the National Remote Sensing Conference held in Melbourne in 1994.
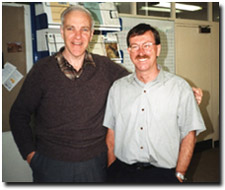 John Martin (left) and John Maher at the State Chemistry Laboratory in 1991. | In 1992 and 1993 the GIS facility was used in several exercises supporting departmental initiatives by presenting complex spatial data in user friendly format. Examples of resulting products included state maps showing a sequence of declared drought durations (1982-83 and 1967-86) and a satellite image based map of the north-west region showing the distribution of 1991 (Autumn) fallow areas. Two GIS generated maps “Victorian Sodic Soils” and “Dominant Soils Relating to Sodic Soil Classes” were produced for the 1992 Sodic Soils National Conference and Workshop (Martin and Proctor, 1992). Larger scale (1:100 000) maps showing the distribution of sodic surface soils and subsoils, salt-affected soil classes and surface soil texture grades in the mid-Loddon Valley were prepared to assist departmental research into all effects of salinity on agricultural production (Martin and Nink, 1993). |
© State of Victoria (Agriculture Victoria) 1996 - .

This work, Victorian Resources Online, is licensed under a Creative Commons Attribution 4.0 licence. You are free to re-use the work under that licence, on the condition that you credit the State of Victoria (Agriculture Victoria) as author, indicate if changes were made and comply with the other licence terms.
The licence does not apply to ‘branding’ or some ‘images or photographs’ that may be owned by third parties. We ask you to seek prior approval to use images using the VRO feedback form. Access to higher quality images can also be provided on request.
This page was last updated on .