
Irrigation Water Use Efficiency Benchmarking
Irrigation Water Use Efficiency Benchmarking Project Summary
Background
Over past decades there has been increasing pressure for greater Water Use Efficiency (WUE) in Victoria’s agricultural industries. The State Government aims to more clearly identify where significant water use improvements can be achieved and target areas that would benefit from further investment.
In 1999 a DPI/DSE ‘Coordinating Group on Water Use Efficiency’ was formed to identify key investment areas and clarify and define farm WUE indicators. In 2004, these indicators were published in the ‘Farm Water Use Efficiency Technical Reference Booklet’ (Table 1). The Booklet also provided a framework for benchmarking farm WUE for irrigated industries within Victoria’s major irrigation regions.
Table 1 – Victorian WUE Performance Reporting Indicators
Water Use Indicator | Description | |
1. | Farm Total Crop Water Use Indicator | Crop Total Water Requirement (Irrigation + Rainfall) (ETc) (ML) Total Water Supplied (Irrigation Water Supplied to the Farm Gate + Effective Rainfall) (ML) |
2. | Farm Irrigation Crop Water Use Indicator | Crop Irrigation Water Requirement (Exclusive of Rainfall) (ETci) (ML) Irrigation Water Supplied to the Farm Gate (ML) |
3. | Farm Total Crop Production Water Use Indicator | Quantity of Produce generated from a particular irrigated crop (kg) Total Water Supplied (Irrigation Water Supplied to the Farm Gate + Effective Rainfall) (ML) |
4. | Farm Irrigation Crop Production Water Use Indicator | Quantity of Produce generated from a particular irrigated crop (kg) Irrigation Water Supplied to the Farm Gate (ML) |
5. | Farm Total Crop Economic Water Use Indicator | Long-term Average annual Gross Margin of a particular irrigated crop ($) Total Water Supplied (Irrigation Water Supplied to the Farm Gate + Effective Rainfall) (ML) |
6. | Farm Irrigation Crop Economic Water Use Indicator | Long-term Average annual Gross Margin of a particular irrigated crop ($) Irrigation Water Supplied to the Farm Gate (ML) |
7. | Farm Total Crop Water Use Application Intensity Indicator | Total Water Supplied to the Farm Gate (inclusive of Effective Rainfall) (ML) Total Area Irrigated (Ha) |
A project was subsequently established to review and implement the proposed WUE benchmarking framework at a regional scale. The ‘Irrigation Water Use Efficiency Benchmarking’ project has been in progress since 2005 and will be drawing to conclusion in June 2007.
Objectives
The main objectives of the Irrigation Water Use Efficiency Benchmarking Project are to:
This will enable WUE information to be collated both at a region and industry level.
Pilot
In the initial year of the project, two pilot studies were undertaken to test the feasibility of the proposed framework and provide methodologies for its practical implementation. These pilot studies were:
(1) - Viticulture in the Red Cliffs Irrigation District, Sunraysia Irrigation Region and,
(2) - Dairy in the Central Goulburn District, Shepparton Irrigation Region.
Red Cliffs Irrigation District Pilot – Viticulture
The Red Cliffs Irrigation District pilot focussed on the application of Indicators 1 and 7 to properties within the area for 1996/97 and 2002/03 irrigation seasons using the South Australian WUE tool and SunRISE21 data. Crop Water Requirements were calculated using crop factors supplied as part of the South Australian WUE tool in combination with local weather data. The relationships to further estimate yield and improve the crop water requirement calculation are still under development.
The results for Indicator 1 (Farm Total Crop Water Use) are shown in Figure 1. The light green to red colour indicate that water use was less than the crop water requirement.
Figure 1 – Farm Total Crop Water Use, Red Cliffs Irrigation District, Sunraysia
 (PDF 2MB) | 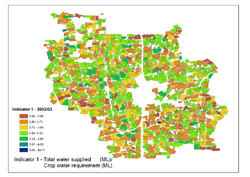 (PDF 424KB) | To view the information PDF requires the use of a PDF reader. This can be installed for free from the Adobe website (external link). |
When applied Indicator 1, Indicator 7 (Farm Total Crop Water Use Application Intensity) shows a real decrease in annual water use between 1996/97 and 2002/03. SunRISE 21 has also completed some complimentary analysis on irrigation methods which indicate that the decrease from 1997 to 2003 in irrigation water applied in the Red Cliffs irrigation district coincided with a significant conversion from furrow irrigation to pressurised irrigation methods. This demonstrates the capacity of the indicators to be complimented by farm activity information to indicate drivers of change and potential impacts of works programs.
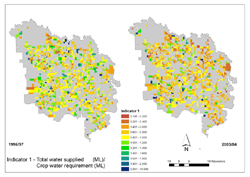
Central Goulburn Irrigation District Pilot - Dairy
Dairy properties in the Central Goulburn Irrigation District were identified using GIS-based local government information. Satellite images were used to determine the area of perennial and annual pasture on each property. Goulburn-Murray Water data was used to determine the crop water supply for each property. This gave the total water supplied, but did not distinguish between water used for perennial or annual pasture. For the purposes of this pilot, it was assumed that all the irrigation water supplied was applied to the area of perennial pasture only.
For this pilot, a selection of the indicators was calculated for approximately 800 dairy farms in the Central Goulburn Irrigation Area using data from the 1996-97 and 2003-04 irrigation seasons.
The majority of dairy properties in the Central Goulburn Irrigation District supplied total water equivalent to or less than the pasture water requirement during both the 1996-97 and 2003-04 irrigation seasons. In 1996-97, 31% percent of properties scored higher than 1 for Indicator 1 (Farm Total Crop Water Use), with the number decreasing to 9% in 2003-04 indicating water usage had declined.
The spatial presentation of results (Figure 2) shows that there is a shift between 1996-97 and 2003-04 from the cooler colours (blue / green – indicating values greater than 1 and represent potential over supply of water) to hot colours (orange / red – indicating values less than 1 and represent an under supply of water and potential for reductions in plant yield).
Figure 2 – Farm Total Crop Water Use, Central Goulburn Irrigation District
 (PDF 265KB) | To view the information PDF requires the use of a PDF reader. This can be installed for free from the Adobe website (external link). |
Current Activities
Red Cliffs Pilot
Work is currently being undertaken in Red Cliffs to develop an agreed set of crop coefficients for major irrigated crops in the Sunraysia Region. Regional production data is being investigated and it is anticipated that the other indicators will be applied to this region. This work has demonstrated that the WUE indicators are reliant on accurate information at the regional level and there are some significant gaps in our knowledge with respect to crop water use.
Central Goulburn
The Central Goulburn pilot used data from a previous DPI survey. Discussions have commenced with industry groups in the region to determine what regional production and economic data exists. The industry is interested in how the information can be used for greatest benefit for all industry participants.
Reporting System
Specification for an on-going reporting system is currently being developed. The reporting system utilises data and the reporting capabilities of the Victorian Water Register. The reporting system can be used by a variety of users and user requirements are currently being investigated.
WUE Information
WUE Knowledge Networks have been formed in both regions. The networks oversee the development of regional and state-wide benchmarks, value-add to the reporting of these benchmarks and facilitate the identification of scientific issues and knowledge gaps to be addressed. The networks will be linked through a centralised web forum housing current projects, references and contacts for WUE information. This will ensure that past and current information is easy to find.
Future Reporting
The on-going WUE reporting system will be a web based application that will combine spatial and textual data from a range of agencies involved in the stewardship and management of the irrigated regions of Victoria. This will allow for reporting on the seven WUE Indicators (Table 1) defined for Victoria. The reporting system will link into the Victorian Water Register and will enable agencies involved to access the reporting system for their own requirements.
Benefits of the Project
This project will result in an increased capacity to compare WUE between Victoria’s irrigated regions and industries. It will also identify priority industries and irrigation regions for investment (in the form of extension, incentives, research and development and infrastructure). The reporting mechanism will also enable the benefits/costs of private and public investment in farm WUE improvements to be quantified.
Contact Details
For more information regarding the Irrigation Water Use Efficiency Benchmarking project contact:
Andy McAllister (DEPI)
Email: andy.mcallister@depi.vic.gov.au
© State of Victoria (Agriculture Victoria) 1996 - .

This work, Victorian Resources Online, is licensed under a Creative Commons Attribution 4.0 licence. You are free to re-use the work under that licence, on the condition that you credit the State of Victoria (Agriculture Victoria) as author, indicate if changes were made and comply with the other licence terms.
The licence does not apply to ‘branding’ or some ‘images or photographs’ that may be owned by third parties. We ask you to seek prior approval to use images using the VRO feedback form. Access to higher quality images can also be provided on request.
This page was last updated on .