
Distribution of Victorian Dairying 1944 to 2014
Back to: Dairy Industry homepage
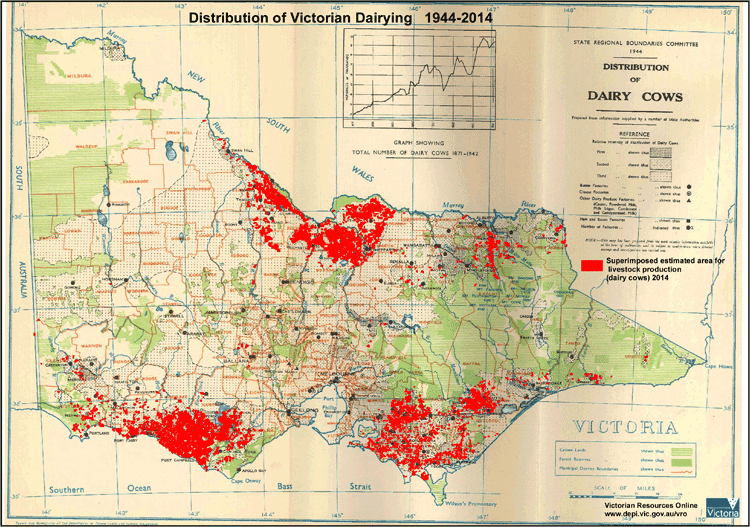
This new map provides a useful spatial view of the change in distribution of dairying over a 70 year period - from 1944-2014. The distribution of dairying in 1944 was obtained from a map produced for the former State Regional Boundaries Committee's 'Report on Regional Boundaries' that shows three levels of dairy intensity (first, second and third) as well as associated factories at the time.
Superimposed over this map (in red shading) is the estimated 2014 distribution of dairy farms in Victoria obtained from the Victorian Land Use Information System (VLUIS). VLUIS data is a combination of satellite image interpretation as well as data from other government sources. The area of dairying has been produced by applying a 1 km buffer around polygons sourced from VLUIS. It should be noted that not all dairy farms may be represented in this 2014 mapped area and the map product will be improved on over time as new data becomes available.
Distribution of Victorian Dairying 1944 to 2014 (PDF - 2MB)
The high resolution PDF file provided on this page can be viewed using the free Adobe PDF reader and this software can be installed from the Adobe website (external link). This PDF is provided with a high level of detail and with the intent that it should be printed at a high resolution.
© State of Victoria (Agriculture Victoria) 1996 - .

This work, Victorian Resources Online, is licensed under a Creative Commons Attribution 4.0 licence. You are free to re-use the work under that licence, on the condition that you credit the State of Victoria (Agriculture Victoria) as author, indicate if changes were made and comply with the other licence terms.
The licence does not apply to ‘branding’ or some ‘images or photographs’ that may be owned by third parties. We ask you to seek prior approval to use images using the VRO feedback form. Access to higher quality images can also be provided on request.
This page was last updated on .