
LCA Cardinia Shire - Tech Report No. 29 - Chapters
The Department of Natural Resources and Environment has been involved in formal land capability assessment studies since the early 1970s. The Land Capability Section of the (then) Soil Conservation Authority established the framework for the conduct of formal land capability studies upon which this more recent work is based. This framework included rating tables for some thirty activities. Ratings for various activities were presented as thematic maps, or combined into ratings for various land uses, depending upon the needs and abilities of the client.
It was proposed to undertake detailed Land Capability Studies in municipalities with significant pressures for change in land use to more intensive uses, where there was significant existing or potential land degradation issues, or where better quality agricultural land was under threat of development for residential purposes.
The primary objective has been to provide the municipality with detailed land resource information, consisting of base data on the nature of the land, and assessment of the likely performance of the land under various activities. This information can underpin many land use and management decisions by the municipal authority, both now and in the future. In doing so, many of the problems and unexpected costs incurred through inappropriate land use can be avoided.
USER GUIDE
The user guide is designed to assist document users in finding and cross referencing information contained within this report. Each section of the report is represented below with a brief description of the contents and the relationship to other sections.
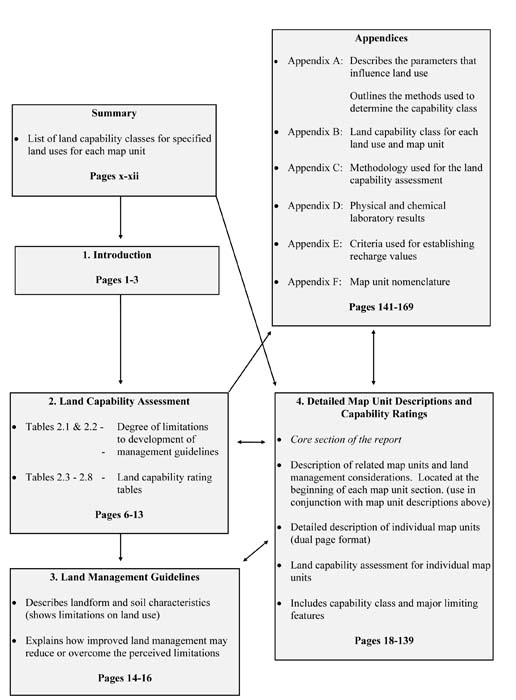
EXAMPLE: This hypothetical example is designed to assist users to understand the interrelationship between the different sections in the report and the use of the accompanying maps.
| Scenario: Determining the feasibility of further development north of Packenham Upper, (Map 1a) requiring secondary roads, septic tanks and building foundations. |
Step 1: Locate site on the Base Map and establish the map unit, for example, Dgd.
Step 2: Refer to Table i.i, in the Summary (p ix), for a general idea of the capability of this map unit to support the specified land uses AND / OR use the Land Capability Assessment for Secondary Roads, and Land Capability Assessment for Effluent Disposal maps. Locate the site and refer to the legend which will provide the rating and the limiting features.
Step 3: Inspect site. Refer to the core section of the report - Section 5. Detailed Map Unit Descriptions - and find the relevant map unit, Dgd (p 94). This will give a detailed description of the soil and landscape features of this map unit. Due to the broad scale of the maps, the first step is to determine whether the detailed soil and landscape features are similar to what is found on the site of interest. If not, the site may be similar to another map unit description or it may be an anomaly and therefore an individual study of the site may need to be carried out.
If the site is similar, the Land Capability Assessment table will give the rating for the land uses in question. For this example, the land capability ratings are:
- Secondary Roads: Rating 4 - Limiting features: slope and drainage.
- Effluent Disposal: Rating 4 - Limiting feature: drainage and permeability.
- Building Foundations: Rating 4 - Limiting features: slope and drainage.
Step 5: Section 3. Land Management Guidelines (chapter 3 p 14) will explain the limitations specified in step 3 (i.e. drainage for effluent disposal, and proportion of stones and boulders and linear shrinkage for secondary roads) and whether they can be reduced or overcome by an improved level of management.
Step 6: If the limitations can be overcome, referring to Appendix B will show if there are any other limitations which need to be overcome to allow the development to take place without causing degradation to land and water quality.
NOTE: Section 4.4 Devonian granitic map units (p 85). Understanding the whole study area is important in making planning decisions as development may be capable of occurring on the site of interest but the off-site effects may be considerable.
The process of how and when to use the various sections of the report is largely up to the user. There may be times when the user may need to refer to different sections of the report, particularly a new user, to ensure that they have a full understanding of the Land Capability Assessment process. For example, understanding the process of determining the Land Capability Assessment ratings is very important, therefore the user will need to refer to Section 2. Land Capability Assessment and Appendix A to establish how the ratings were determined.
SUMMARY
This study describes in detail the land present in the Cardinia Shire and provides information relevant to land use planning and assessment.
A land capability study provides a planning tool to assist the Shire in the development of a detailed planning scheme. It will facilitate the planning of future land use through a systematic and rational examination of the lands management requirements, and the consequences of undertaking a range of alternative land uses. Revision of the planning scheme, based on sound land resources information, is required to direct development away from areas not well suited to certain uses, and to maintain a balance between competing land uses and the better quality agricultural land, in the interest of the whole community.
The former Shire of Pakenham (area approximately 880 square kilometres) has now become incorporated into the Cardinia Shire. The new shire also includes a large area in the south, previously part of the City of Cranbourne, as well as an additional area close to the township of Emerald which was previously part of the former Shire of Sherbrooke. The Cardinia Shire has an area of approximately 1260 square kilometres.
The Shire has seen significant population growth over the last few decades due to its easy commuting distance to Melbourne and Dandenong by way of the Princes Highway and the Warragul Railway system. Growth has been concentrated around towns close to the highway, however there is increasing pressure for development away from the area set aside as the major growth corridor. The areas under pressure include Upper Beaconsfield, Gembrook, Cockatoo, Emerald and Maryknoll. It is well established that indiscriminate development of land for small lot rural and residential development may result in extensive land and water degradation, loss of good agricultural land and unnecessarily high development and maintenance costs.
The protection of good quality agricultural land is becoming increasingly important as rural residential development is encroaching upon and fragmenting the remaining highly productive areas. Identification of good quality agricultural land has, to a large extent, already been carried out in the alluvial area of the Koo-wee-rup swamp in the studies by Sargeant (1993, 1994). The Tertiary volcanic soils around Gembrook and Emerald are also valuable for horticultural production and will come under further pressure for rural residential development.
The agricultural ratings for this area show significant areas with ratings of class 3, while some areas have been categorised as class 4. Although the class 4 ratings occur on quite productive soils, the limitation for agriculture is commonly the steepness of the slope. The areas with a very poor rating (class 5) due to the very steep slopes, are generally too steep to be cultivated and are either not used for agricultural purposes or are used only for grazing.
The Shire has a diverse range of landforms including broard alluvial plains, gentle undulating rolling hills and steep hills. Steep slopes are associated with Silurian sediments and Devonian granite, and this land is often prone to sheet and gully erosion. Because of the favourable climate and long growing season, significant ground cover is present all year. This ground cover mitigates against significant erosion in many situations, however any practice that removes ground cover will greatly accelerate the rate of erosion. Increased erosion will occur around house sites, road batters, drains, eroded stream banks and bare cultivated paddocks. Westernport Bay is the ultimate destination for much of this eroded material.
An emerging problem in the shire is the increase in area of salt affected land. Salt discharge areas are becoming visible in the lower lying areas. Salt affected areas are particularly visible upslope of the Princes Highway and the railway line. Construction of the road and railway has created some compaction of the subsoil. This compaction restricts the flow of groundwater causing it to rise at certain points. As the level of groundwater approaches the rooting zone of trees, shrubs and grasses these plants die from the high levels of dissolved salts present in the groundwater. The rise in groundwater is primarily caused by the clearing of trees further up the catchment. Additionally, annual pastures that have replaced the trees use less water thereby compounding the salt problem. Many bores monitoring groundwater levels in the area show significant rises.
The high amount of ground cover in the summer months on the basalt soils aids in reducing the amount of erosion that may otherwise occur due to the steepness of the slopes. However when sheet erosion does occur, the topsoil is often washed into dams and streams leading to siltation and declining water quality. Improved cultivation practices, including the establishment of buffer zones around streams and drainage lines will reduce some of the siltation into the drainage lines.
Table i.i Summary of land capability classes.
Note: Please refer to Section 4 (Detailed Map Unit Descriptions and Capability Ratings) for further information.
MAP UNIT | LAND CAPABILITY RATING | ||||||
Symbol | Description | Agriculture | Effluent Disposal | Farm Dams | Building Foundations | Secondary Roads | Rural Residential |
Qa1 | Quaternary alluvium, Koo-wee-rup peaty clay | 2 | 5 | 3-4 | 5 | 5 | 5 |
Qa2 | Quaternary alluvium, Koo-wee-rup peaty clay with sandy ridges | 2 | 4 | 4 | 4 | 4 | 4 |
Qa3 | Quaternary alluvium, Narre clay loam | 3 | 4 | 3 | 3 | 3 | 4 |
Qa4 | Quaternary alluvium, Narre clay loam with sandy ridges | 2 | 3 | 3-4 | 3 | 3 | 3-4 |
Qa5 | Quaternary alluvium, Tynong clay loam | 3 | 3-4 | 3 | 3 | 3 | 3-4 |
Qa6 | Quaternary alluvium, Dalmore clay (non-peaty) | 3 | 4 | 5 | 3 | 5 | 5 |
Qa7 | Quaternary alluvium, Dalmore clay (heavy -surface)) | 2 | 3 | 4 | 3 | 3 | 4 |
Qa8 | Quaternary alluvium, Toomuc clay loam | 3 | 4 | 3 | 3 | 3 | 4 |
Qa9 | Quaternary alluvium, Monomeith clay loam | 3 | 4 | 4 | 3 | 3 | 4 |
Qa10 | Quaternary alluvium, Unclassified sandy ridges | 3 | 3 | 3 | 3 | 3 | 3 |
Qa11 | Quaternary alluvium, Monomeith clay loam with sandy ridges | 3 | 4 | 3 | 3 | 3 | 4 |
Qa12 | Quaternary alluvium, Dalmore clay | 3 | 4 | 5 | 3 | 5 | 5 |
Tvb1 | Tertiary volcanics, steep slope | 5 | 5 | 5 | 5 | 5 | 5 |
Tvc1 | Tertiary volcanics, moderately steep slope | 4 | 4 | 5 | 4 | 4 | 5 |
Tvd1 | Tertiary volcanics, moderate slope | 3 | 3 | 4 | 4 | 4 | 4 |
Tve1 | Tertiary volcanics, gentle crest | 2 | 2 | 4 | 3 | 3 | 4 |
Tvf1 | Tertiary volcanics, gentle slope | 2-3 | 2 | 4 | 3 | 3 | 4 |
Tvh1 | Tertiary volcanics, drainage depression | 2-3 | 3 | 4 | 4 | 4 | 4 |
Tvb2 | Tertiary volcanics, remnant capping, steep slope | 5 | 5 | 5 | 5 | 5 | 5 |
Tvc2 | Tertiary volcanics, remnant capping, moderately steep slope | 4 | 4 | 5 | 4 | 4 | 5 |
Tvd2 | Tertiary volcanics, remnant capping, moderate slope | 3 | 3 | 4 | 4 | 4 | 4 |
Tve2 | Tertiary volcanics, remnant capping, gentle crest | 2 | 2 | 4 | 3 | 3 | 4 |
Tvf2 | Tertiary volcanics, remnant capping, gentle slope | 3-2 | 2 | 4 | 3 | 3 | 4 |
Tvh2 | Tertiary volcanics, remnant capping, drainage depression | 2-3 | 3 | 4 | 4 | 4 | 4 |
Tsd | Tertiary sediments, moderate slope | 3 | 3 | 4 | 4 | 4 | 4 |
Tse | Tertiary sediments, gentle crest | 3 | 2 | 4 | 3 | 3 | 4 |
Tsf | Tertiary sediments, gentle slope | 3 | 4 | 3 | 4 | 4 | 4 |
Tsg | Tertiary sediments, very gentle slope | 3 | 4 | 3 | 4 | 4 | 4 |
Tsh | Tertiary sediments, drainage depression | 3 | 4 | 3 | 4 | 4 | 4 |
Dga | Devonian granitic, steep crest. | 4 | 4-3 | 5 | 4 | 4 | 5 |
Dgb | Devonian granitic, steep slope | 5 | 5 | 5 | 5 | 5 | 5 |
Dgc | Devonian granitic, moderately steep slope | 4 | 4 | 5 | 4 | 4 | 5 |
Dgd | Devonian granitic, moderate slope | 3 | 4 | 4 | 4 | 4 | 4 |
Dge | Devonian granitic, gentle crest | 4 | 5 | 5 | 5 | 5 | 5 |
Dgf | Devonian granitic, gentle slope | 4 | 4 | 3 | 4 | 4 | 4 |
Dgg | Devonian granitic, very gentle slope | 4 | 4 | 3 | 4 | 4 | 4 |
Dgh | Devonian granitic, drainage depression | 5 | 5 | 5 | 4 | 4 | 5 |
Dgi | Devonian granitic, flat | 5 | 5 | 5 | 4 | 4 | 5 |
Sma | Silurian metamorphic, steep crest | 3-4 | 3-4 | 5 | 3 | 3 | 5 |
Smb | Silurian metamorphic, steep slope | 5 | 5 | 5 | 5 | 5 | 5 |
Smc | Silurian metamorphic, moderately steep slope | 4 | 4 | 5 | 4 | 4 | 5 |
Smd | Silurian metamorphic, moderate slope | 5 | 3 | 4 | 5 | 5 | 5 |
Smf | Silurian metamorphic, gentle slope | 5 | 3 | 4 | 5 | 5 | 5 |
Smh | Silurian metamorphic, drainage depression | 3 | 4 | 5 | 4 | 4 | 5 |
Ssa | Silurian sediments, steep crest | 3-4 | 3-4 | 4-5 | 3 | 3 | 4-5 |
Ssb | Silurian sediments, steep slope | 5 | 5 | 5 | 5 | 5 | 5 |
Ssc | Silurian sediments, moderately steep slope | 4 | 4 | 5 | 4 | 4 | 5 |
Ssd | Silurian sediments, moderate slope | 3 | 3-4 | 4-5 | 4 | 4 | 4-5 |
Sse | Silurian sediments, gentle crest | 3 | 3 | 4 | 2 | 3 | 4 |
Ssf | Silurian sediments, gentle slope | 3 | 4 | 4 | 4 | 4 | 4 |
Ssg | Silurian sediments, very gentle slope | 3 | 4 | 3 | 4 | 4 | 4 |
Ssh | Silurian sediments, drainage depression | 3 | 4 | 3 | 4 | 4 | 4 |
Ssi | Silurian sediments, flats | 3 | 4 | 3 | 4 | 4 | 4 |
1.1 Overview
Land varies considerably in its basic characteristics and its response to the demands made upon it. Such demands include the production of food, fibre, water, and development for residential, industrial and recreational purposes.
Planners need to match the requirement of land use with the capability of the land to sustain that use and avoid land degradation. Prior knowledge of soil and land limitations can prevent unnecessary and costly mistakes. Information obtained through land capability assessments can provide the necessary data to assist local government with planning decisions and the preparation of planning strategies for the future.
Planning schemes developed and implemented by local government provide an effective means of managing changes in land use. A planning scheme may prohibit or place conditions on land use not well suited to a land type.
This report provides land resource information for broad-scale planning within the Cardinia Shire. It does not provide recommendations for land use and no allowance has been made for social or economic considerations which may influence planning proposals. It is primarily an examination of potential consequences and levels of management required for a range of land uses.
A previous study covering the former Shire of Pakenham, Land Capability Study of the Westernport Catchment by Goss, H.M., Reimers, T.. and van de Graff, R. H. M. (1987), has been used as a background to this study.
| 1.2 Location The Cardinia Shire covers an area of around 1260 square kilometres and is located approximately 50 kilometres south east of Melbourne (Figure 1.1). 1.3 Purpose of study | 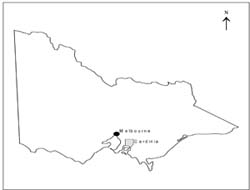 Figure 1.1 Location of Cardinia Shire |
In planning for the future use of land in the shire, there is a need to preserve the qualities that make this area attractive, both economically and aesthetically, whilst also accommodating population growth. It is important to preserve better agricultural land and farming enterprises because of their significant input to the economy of the region.
To ensure a sound base for future planning strategies, the Cardinia Shire Council requested a land capability study by the Department of Natural Resources and Environment.
1.4 Objectives
Major Objective:
To provide land resource information to the Cardinia Shire Council that will facilitate the planning of future land use through a systematic and rational examination of management requirements, and consequences of a range of alternative land uses.
More specifically:
1. To map and describe the freehold land of the Cardinia Shire which is under increased pressure for conversion to rural residential development at a scale of 1:10 000. This will involve identifying dominant land types (including soil types and topography), climatic zones and other land characteristics relevant to the assessment of the capability of the land. These are areas that surround the existing townships of Emerald, Upper Beaconsfield, Gembrook, Maryknoll and Bunyip (see Figure 1.2).
2. To map and describe the freehold land of the former Cardinia Shire at a scale of 1:25 000 (excluding existing urban areas and public land) identifying dominant land types, climatic zones and other features relevant to the assessment of the capabilities of the land.
3. To prepare land capability analyses based on standardised rating tables of the 1:25000 study and the 1:10000 area.
- agriculture,
- effluent disposal (septic tanks),
- farm (earthen) dams,
- building foundations,
- secondary roads
- rural residential development allotment size of 0.5-2 ha.
- topographic base map, including tree cover and map units, and
- thematic land use maps with land capability classes.
6. To provide the Shire with a digital copy of the land capability information gathered.
7. To assist the Cardinia Shire Council in the incorporation of this land resource information into its planning strategies.
2. LAND CAPABILITY ASSESSMENT
2.1 Philosophy and principles
Land capability assessment is a rational and systematic method of determining the ability of land to sustain a specific use and level of management, without causing significant long-term degradation.
The objectives of land capability assessments are:
- to assist land managers and land use planners to identify areas of land with physical constraints for a range of nominated land uses;
- to identify management requirements that will ensure a particular land use can be sustained without causing significant on-site or off-site degradation to land or water quality.
Land capability assessments analyse basic landform and soil information to determine the ability of the land to sustain a desired land use. A strength of the methodology lies in its association with land systems since the results can be extrapolated, with care, to similar land components and land systems in other areas (Refer to 4.2).
| The ratings provided by a land capability assessment are not intended to restrict development of land, but rather to identify the principal constraints of that land for a specified land use. It is a matter for the land manager or land use planner to decide if the cost of overcoming the constraints is justified. Where particularly severe physical constraints exist, the planning authority has the option of excluding that land from that use, or permitting the use only under strict conditions. The placement of conditions on development permits is quite a proper exercise of planning responsibility. |
2.2 Land resource mapping - methodology and constraints
The main objective of land resource mapping is to identify areas of land that are uniform with respect to the characteristics that affect land use. These areas of land will have a similar land use capability for a nominated use and are likely to respond in a similar way to management. By identifying areas of land with a limited range of variability, the resultant map provides the basis for land capability assessment (for specific methodologies, refer Appendix C).
Mapping an area of land can be a complex task as many differences arise due to interactions between climate, geology and topography. While it is possible to measure and determine some of the land characteristics such as slope, rock outcrop, and soil type, other characteristics such as site drainage, and permeability are less easily determined.
The following procedure has been adopted for this study:
- The geological boundaries are obtained from existing maps and verified in the field at the appropriate mapping scale.
- The broad landform pattern and the landform elements are identified from air-photos using a binocular stereoscope. The map units are derived from this information.
- Extensive field verification of map units ensure that map units are consistent with respect to parent material, slope, position in the landscape, soil type, drainage and native vegetation.
- A representative site for each map unit is selected, to record general landform and site information. The incidence of any land degradation in each map unit is also recorded.
- A soil pit or large exposure of the soil profile is prepared at each selected site. Detailed soil profile information is recorded. Colour photographs are taken and soil samples collected for physical and chemical analyses (see Appendix D and the corresponding tables for each Land Unit in Section 4.2 for details).
- The permeability of the soil profile is measured when the soils are near field capacity (see Appendix C).
- The map unit boundaries are entered into a Geographic Information System where the data is combined with base-map information on roads, contours and streams to produce a final base map of the study area with appropriate headings and legend.
- Land capability ratings for those land uses relevant to the study are derived from the climatic, land and soil data available for each map unit based on standardised rating tables. Separate land capability assessment maps are prepared for the specified land uses.
- A report is prepared to provide accompanying land resource information and methodology for the land capability maps.
2.3 Assessment procedure
A land capability rating table lists key land characteristics such as slope, site drainage or soil depth, which may affect the ability of the land to support a specified land use. These land characteristics are quantified and graded into classes for the land use being assessed. Each map unit within the study area is given a capability class according to the tables shown in Section 2.4.
It is the most limiting factor that determines the Capability Class for the map unit. This is related to the degree of limitation for that land use and the general level of management that will be required to minimise degradation.
A Capability Class of one represents essentially no physical limitations to the proposed land use whilst a Class of five indicates a very low capability to sustain the land use. Limitations in Class five generally exceed the current level of management skills and technology available. Severe deterioration of the environment is likely to occur if development is attempted. A Class of two, three or four will require increasing levels of management to sustain the particular land use, otherwise the environment will deteriorate.
Separate class descriptions are prepared for agriculture (Table 2.1) and other land uses (Table 2.2). Due to the scale of mapping adopted (1:25 000), the inherent variability within some landscapes may result in the presence of small unrepresentative areas within map units. In some cases, these areas will have a capability class exceeding that of the overall map unit. An opportunity may therefore exist to utilise land with less constraints for the chosen development.
2.4 Land capability rating tables
Each land capability rating table (refer Tables 2.3, 2.4, 2.5, 2.6, 2.7, 2.8) contains criteria which will strongly influence the ability of the land to sustain the desired land use. The limitations distinguishing each land capability class from one to five are also presented for comparison.
There has been no attempt to rank the criteria in order of importance. The objective of having classes is to identify the kind of limitation and its severity. It is recognised that criteria may interact, but an underlying objective of this study is to provide the information in a useable form, rather than have a convoluted series of alternative pathways that would be too complex for the intended user to follow.
Where there are known interactions between different criteria, it is the responsibility of the planner or land manager to assess the importance of the limiting factor(s) and to determine the need for management or additional financial input to overcome the limitation.
Theoretically a single diagnostic land quality could be found and used to rate land performance, but there is the risk of such a feature masking the true parameters that affect the land use, thus preventing a change to a more appropriate land use or level of management. Land use and land management practices will continue to change and if the community is concerned about long-term sustainability of specific land uses, then the limitations of the soil, the various processes of land degradation, and the possibility of off-site effects, must be recognised. Once a limitation to land use is identified, steps can be taken to overcome or minimise the long-term effect of land degradation that would result if the land use was continued.
Table 2.1 Land capability classes for agriculture.
CLASS | CAPABILITY | DEGREE OF LIMITATION |
Class 1 | Very good | Can sustain a wide range of uses including an intensive cropping regime. Very high levels of production possible with standard management levels. |
Class 2 | Good | Moderate limitations to agricultural productivity, overcome by readily available management practices. |
Class 3 | Fair | Can sustain agricultural uses with low to moderate levels of land disturbance such as broadacre cultivation in rotation with improved pastures. Moderate to high levels of production possible with specialist management practices such as minimum tillage. |
Class 4 | Poor | Low capacity to resist land disturbance such as cultivation. Moderate production levels possible with specialist management such as improved pasture establishment with minimum tillage techniques. Recommended for low disturbance agriculture such as grazing or perennial horticulture. |
Class 5 | Very poor | Very low capability to resist disturbance. Areas of low productive capacity. Minimal grazing levels or non-agricultural uses recommended. |
Note: Land is assessed for agricultural production on the basis of climate, topography, and the inherent characteristics of the soil. Climate differs from topography and soil features in that it is a regional parameter rather than site specific. The capability table identifies the versatility and potential productivity of an area for a range of agricultural uses, and highlights the necessary level of management required to sustain the land use.
These agricultural ratings are for comparative purposes only and should not be used as a basis for detailed property planning.
Table 2.2 Land capability classes for effluent disposal, farm dams, building foundations and secondary roads.
| CLASS | CAPABILITY | DEGREE OF LIMITATION TO DEVELOPMENT | GENERAL DESCRIPTIONS AND MANAGEMENT GUIDELINES |
| Class 1 | Very good | The limitation of long term instability, engineering difficulties or erosion hazards do not occur or they are very slight. | Areas with high capability for the proposed use. Standard designs and installation techniques, normal site preparation and management should be satisfactory to minimise the impact on the environment. |
| Class 2 | Good | Slight limitations are present in the form of engineering difficulties and/or erosion hazard. | Areas capable of being used for the proposed use. Careful planning and the use of standard specifications for site preparation, construction and follow up management are necessary to minimise the impact of the development on the environment. |
| Class 3 | Fair | Moderate engineering difficulties and/or moderately high erosion hazard exist during construction. | Areas with a fair capability for the proposed use. Specialised designs and techniques are required to minimise the impact of the development on the environment. |
| Class 4 | Poor | Considerable engineering difficulties during development and/or a high erosion hazard exists during and after construction. | Areas with poor capability for the proposed use. Extensively modified design and installation techniques, exceptionally careful site preparation and management are necessary to minimise the impact of the development on the environment. |
| Class 5 | Very poor | Long term severe instability, erosion hazards or engineering difficulties which cannot be practically overcome with current technology. | Performance of the land for the proposed use is likely to be unsatisfactory. Severe deterioration of the environment will occur if development is attempted in these areas. |
Table 2.3 Land capability assessment for agriculture.
Parameters influencing AGRICULTURAL PRODUCTION | Land Capability Ratings | |||||
Class 1 | Class 2 | Class 3 | Class 4 | Class 5 | ||
| C: Climate | Length of growing season (months) | 12 - 11 | 10 - 8 | 7 - 5 | 4 - 2 | < 2 |
| T: Topography | Slope (%) | 1 - 3 | 4 - 10 | 11 - 20 | 21 - 32 | > 32 |
| S: Soil | Condition of topsoil * | 25 - 21 | 20 - 16 | 15 - 11 | 10 - 6 | 5 - 1 |
| Depth of topsoil (mm) | > 300 | 300 - 160 | 150 - 110 | 100 - 50 | < 50 | |
| Depth to rock/hardpan (m) | > 2.0 | 2.0 - 1.5 | 1.5 - 1.0 | 1.0 - 0.5 | < 0.5 | |
| Depth to seasonal watertable (m) | > 5.0 | 5.0 - 2.0 | 2.0 - 1.5 | 1.5 - 1.0 | < 1.0 | |
| Total amount of water (mm) available to plants * | > 200 | 200 - 151 | 150 - 101 | 100 - 51 | 50 - 0 | |
| Index of permeability/rainfall * | Very high | High | Moderate | Low | Very low | |
| Dispersibility of topsoil (Emerson) * | E6, E7, E8 | E3(1), E3(2), E4, E5 | E3(3), E3(4) | E2 | E1 | |
| Gravel/stone/boulder content (v/v %) * | 0 | 1 - 10 | 11 - 25 | 26 - 50 | > 50 | |
| Electrical conductivity(µs/cm) * | < 300 | 300 - 600 | 600 - 1400 | 1400 - 3500 | > 3500 | |
| Susceptibility to sheet/rill erosion *+ | Very low | Low | Moderate | High | Very high | |
| Susceptibility to gully erosion *+ | Very low | Low | Moderate | High | Very high | |
| Susceptibility to wind erosion *+ | Very low | Low | Moderate | High | Very high | |
Note: The potential agricultural productivity of land is generally classified by the CTS criteria (Climate, Topography and Soil), e.g. the ‘ideal’ prime agricultural areas would be denoted by C1 T1 S1 compared with another area that had, for example, a 5 - 7 month growing season, slopes of 3% and a depth to rock/hardpan of only 0.7 m, denoted by C3T2 S4. The overall Land Capability Class of this latter land would be 4; with soil factors being the major limiting features.
* See Appendix A.
+ The susceptibility to erosion ratings for the Cardinia Shire have been improved by one rating due to the high growth rate
and ground cover during the summer months.
Table 2.4 Land capability assessment for on-site effluent disposal.
Parameters influencing EFFLUENT DISPOSAL | Land capability ratings | ||||
Class 1 | Class 2 | Class 3 | Class 4 | Class 5 | |
| Slope (%) * | < 3 | 3 - 10 | 11 - 20 | 21 - 32 | > 32 |
| Flooding risk * | Nil | Low | Moderate | High | Very high |
| Drainage * | Rapidly drained | Well drained | Moderately well drained | Imperfectly drained | Poorly drained |
| Depth to seasonal watertable (m) | > 2.0 | 2.0 - 1.5 | 1.5 - 1.0 | 1.0 - 0.5 | < 0.5 |
| Depth to hard rock/impermeable layer (m) | > 1.5 | 1.0 - 1.5 | 1.0 - 0.75 | 0.75 - 0.5 | < 0.5 |
| Number of months/year when average daily rainfall > Ksat * | 0 | 1 | 2 | 3 | > 3 |
| Permeability (Ksat mm/day) * | > 500 ** | 500 - 100 | 100 - 50 | 50 - 10 | < 10 |
Note: Areas capable of absorbing effluent from a standard anaerobic, all-waste, septic tank connected to a single family dwelling (approximate output of 1000 litres per day).
10 mm/day is equivalent to disposing of 1000 l/day along a 0.5 x 200 m trench
* See Appendix A
** Permeability > 1000 mm/day could pollute groundwater.
Table 2.5 Land capability assessment for earthen dams.
Parameters influencing the construction of EARTHEN DAMS | Land capability ratings | ||||
Class 1 | Class 2 | Class 3 | Class 4 | Class 5 | |
| Slope (%) * | 3 - 7 | 0 - 3 | 7 - 10 | 10 - 20 | > 20 |
| Linear shrinkage (%) * | 0 - 5 | 6 - 12 | 13 - 17 | 18 - 22 | > 22 |
| Suitability of subsoil * | Very high | High | Moderate | Low | Very low |
| Depth to seasonal watertable (m) | > 5 | 5 - 2 | < 2 | ||
| Depth to hard rock (m) | > 5 | 5 - 3 | 3 - 2 | 2 - 1 | < 1 |
| Permeability (Ksat mm/day) * | < 1 | 1 - 10 | 11 - 100 | 101 - 1000 | > 1000 |
| Dispersibility of subsoil (Emerson) | E3(2), E3(3) | E3(1), E3(4) | E2(1), E2(2), E5(A), E5(B) | E2(3), E2(4), E5(C), E5(D) | E1, E6, E7, E8 |
| Susceptibility to slope failure | Very low | Low | Moderate | High | Very high |
Note: This table should only be considered for small farm dams to 1000 m3 in capacity, that have a top water level less than 3 m above the original ground surface at the upstream side of the wall.
Rock outcrop, depth of topsoil and flooding risk were also considered but have not been included for reasons given in Appendix A.
* See Appendix A.
Table 2.6 Land capability assessment for building foundations.
Parameters influencing BUILDING FOUNDATIONS | Land capability ratings | ||||
Class 1 | Class 2 | Class 3 | Class 4 | Class 5 | |
| Slope (%) i) Slab ii) Stumps/footings | 0 - 1 0 - 5 | 2 - 5 6 - 10 | 6 - 10 11 - 30 | 11 - 30 30 - 45 | > 30 > 45 |
| Drainage * | Rapidly drained | Well drained | Moderately well drained | Imperfectly drained | Poorly drained |
| Depth to seasonal watertable (m) | > 5 | 5 - 2 | 2 - 1 | 1 - 0.5 | < 0.5 |
| Proportion of stones and boulders (v/v %) | 0 | 1 - 10 | 11 - 20 | 21 - 50 | > 50 |
| Depth to hardrock (m) | > 1.5 | 1.5 - 0.75 | 0.75 - 0.51 | 0.5 - 0.25 | < 0.25 |
| Susceptibility to slope failure * | Very low | Low | Moderate | High | Very high |
| Linear shrinkage (%) * i) Slab ii) Stumps/footings | < 12 < 6 | 13 - 17 7 - 12 | 18 - 22 13 - 17 | 22 - 30 18 - 22 | > 30 > 22 |
| Flood risk | Nil | Low | Moderate | Moderate/high | High |
Note: Areas capable of being used for the construction of buildings of one or two stories. It is assumed that any excavation will be less than 1.5 m and can be completed by a tractor-backhoe or equipment of similar capacity. Two methods of construction are considered:
i) Concrete slab - 100 mm thick and reinforced
ii) Stumps or strip footings
* See Appendix A.
Table 2.7 Land capability assessment for secondary roads.
Parameters influencing SECONDARY ROADS | Land capability ratings | ||||
Class 1 | Class 2 | Class 3 | Class 4 | Class 5 | |
| Slope (%) | 0 - 1 | 2 - 5 | 6 - 10 | 11 - 30 | > 30 |
| Drainage * | Rapidly drained | Well drained | Moderately well drained | Imperfectly drained | Poorly drained |
| Depth to seasonal watertable (m) | > 5 | 5 - 2 | 2 - 1 | 1 - 0.5 | < 0.5 |
| Proportion of stones and boulders (v/v %) * | 0 | 1 - 10 | 11 - 20 | 21 - 50 | > 50 |
| Depth to hard rock (m) | > 1.5 | 1.5 - 0.75 | 0.75 - 0.51 | 0.5 - 0.25 | < 0.25 |
| Susceptibility to slope failure * | Very low | Low | Moderate | High | Very high |
| Linear shrinkage (%) * | < 6 | 7 - 12 | 13 - 17 | 18 - 22 | > 22 |
| Bearing capacity (kPa) * | > 50 | - | < 50 | - | - |
| Flooding risk* | Nil | Low | Moderate | High | Very high |
| Dispersibility of subsoil Emerson (> 4% slope) * | E6, E7, E8 | E4, E5, E3(1), E3(2) | E3(3), E3(4) | E2 | E1 |
| Unified Soil Group | GW, GC, SC | SM, SW, GM | SP, CL, CH, MH, GP | ML | Pt, OH, OL |
Note: Areas capable of being used for the construction of earthen roads for light vehicles without sealed surfaces or concrete drainage and kerbing.
* See Appendix A.
Table 2.8 Land capability assessment for rural residential and rural farmlet development
Rural residential development (0.4 ha - 2.0 ha) | Rural farmlet (> 5.0 ha) | ||
| Building foundations | No change to capability class | Building foundations | No change to capability class |
| Secondary roads | No change to capability class | Secondary roads | No change to capability class |
Effluent disposal | No change to capability class | Effluent disposal | Improve rating by one class if major limitation is due to permeability, drainage and depth to hardrock.
No change to rating class if another criteria is the major limitation present |
Earthen dams | No change to capability class | Earthen dams | Improve rating by one class.
No change where slope, rapid permeability, risk of slope failure and dispersibility are the major limitations present |
Rural residential development involves a range of land uses: building foundations, earthen dams, effluent disposal and secondary roads. There is a need to consider the capability of each individual land use in assessing the overall capability of a map unit to sustain rural residential development. More intensive use of the land will require an improved level of management to reduce the likelihood of land degradation.
The land and soil within certain map units can vary substantially in the Cardinia Shire. This variation within a map unit is more likely to occur with large size allotments. It is recognised that in areas greater than 5 ha, detailed site inspection can highlight areas with a higher capability to support a given land use. For example, dam construction may be restricted by shallow soil depth on a small allotment (less than 2 ha), however on a larger allotment a minor drainage line may be found to contain sufficient soil depth to enable a dam to be constructed. Larger allotments also allow for greater flexibility in management and design, while an allotment of 1/4 - 1 acre will place absolute limits on options for development.
In assessing the overall capability for rural residential development the capability of each individual land use has been combined to arrive at a final rating class.
For the purpose of this study, rural residential development has been defined as block sizes between 0.4 - 2.0 ha. The ratings for blocks greater than 5.0 ha are not depicted on the maps and in the report, although the table above gives an indication of the capability of the map units if they are larger than 5.0 ha, where there may be more variety in map units and therefore slope and soil types.
3. LAND MANAGEMENT GUIDELINES
3.1 Management of land characteristics that influence land use
The criterions used in land capability rating tables have been selected because of the limitations they impose on the use of the land. This section explains why these features are important and how an improved level of management can reduce or even overcome the limitation. Information has been extracted from Rowe et. al. (1980) and Charman and Murphy (1991).
3.1.1 Soil texture
Soil texture is largely determined by the proportions of different-sized soil particles which make up the soil. Topsoils with well-graded textures have a relatively even distribution of particle sizes from clay through to sand, and tend to be better able to support agricultural and pastoral activities than either very sandy or very clayey soils. They are better able to withstand cultivation and compaction and are more resistant to soil erosion.
Soil texture is closely related to available water-holding capacity. The fine sandy loam - silty clay loam soils have more available water than sands or clays, and so can maintain plant growth for longer periods after wetting.
Texture is also an important determinant in soil infiltration and internal drainage, with sandier soils tending to have greater infiltration rates and better internal drainage. Well-structured or self-mulching clays may be very difficult to cultivate in either the wet or dry states. On the other hand, soils with coarse or sandy texture are very unstable and easily eroded, and may need the protection of a vegetative cover over the dry season.
3.1.2 Boulders and rock outcrop
Boulders and rock outcrop provide physical obstacles to excavation, cultivation and plant growth, and so inhibit land uses involving these activities. It may be possible to remove isolated rock outcrops by blasting, but for extensive uses, such as cropping and grazing, boulders and rock outcrop are a permanent limitation. Additional costs may be involved with the increased management required to maintain pasture growth or reduce storm water run-off from rocky areas.
3.1.3 Depth to hard rock
The presence of shallow hard rock (<0.5 m) causes problems for engineering and agricultural land use. Shallow hard rock may need excavation for engineering activities such as road works, building foundations and other shallow excavation work. Shallow hard rock may be removed with heavy machinery and blasting. Agricultural land use including cropping and farm dams are permanently restricted where shallow hard rock is present.
Very shallow soils are inherently more susceptible to erosion and require the protection of a permanent undisturbed cover of vegetation.
3.1.4 Depth of topsoil
Topsoil is not favoured as a construction material because of its low bearing capacity. The greater the depth of topsoil, the greater the cost of removing and stockpiling it. Many excavation permits now require the topsoil to be re-spread on construction sites to facilitate revegetation and this can be done successfully provided the compacted surface is broken up prior to the top soil being returned.
3.1.5 Depth to seasonal, perched or permanent watertable
The presence of a watertable close to the surface causes problems for both agricultural and engineering land uses. Saturated soils have a low bearing capacity. Therefore high watertables are unsuitable for stable foundations (e.g. building foundations and roads).
High watertables restrict the percolation of additional water from rainfall, irrigation or the effluent from septic tanks through the soil profile, whereas a fluctuating watertable is likely to cause leaching of the more mobile plant nutrients, or the concentration of iron compounds which immobilise nutrients such as phosphorus. High watertables in the plant root zone will reduce aeration and restrict root growth. Trafficability can be adversely affected, and in the case of effluent disposal, public health aspects may be of concern. High watertables may also restrict the depth of excavation for farm dams and quarries, even shallow excavations for sand and gravel deposits.
Watertables can be lowered by pumping or constructing artificial drains, however if the water is saline, disposal options are limited.
3.1.6 Dispersible clays
Dispersion is the spontaneous deflocculation of the clay fraction of soil in water. Slaking is the breakdown of an aggregate into smaller aggregates and primary particles. Dispersion and slaking are important characteristics of a soil because of their influence on the stability of the soil structure. Soils with a high degree of slaking or dispersion have a high erosion potential and any activity that exposes the topsoil or subsoil to rainfall or running water increases the risk of erosion.
Dispersion is an indicator of sodic soils. It occurs when clay particles form a cloud around an aggregate placed in water.
Dispersive soils have a high Exchangeable Sodium Percentage (ESP). This is the insoluble sodium attached to clay particles. Excessive sodium forces the clay particles apart (dispersion) when in water. The fine clay particles that have dispersed, clog up the the small pores in the soil, degrading soil structure, and restricting root growth and water movement. The amount of sodium defines the sodicity level of the soil. Excessive exchangeable sodium causes the clay particles to disperse when in contact with water.
Dispersible topsoils usually have poor physical characteristics, such as surface crusting, cloddiness, poor aeration and low emergence of plant seedlings. Maintenance of an effective pasture cover or litter layer reduces raindrop splash, dispersion and the associated surface sealing of topsoils.
Dispersible subsoils predispose a site to tunnel or gully erosion. The risk may be minimised by careful pasture management such as ensuring that the slopes and drainage depressions are well vegetated with plant species that have deep root systems and high water requirements. Road batters may be subject to slumping and erosion, with subsequent turbidity of run-off water and sedimentation in nearby water storages. As the dispersibility of the subsoil increases, so does the need to reduce batter slopes and establish a protective vegetative cover on the exposed soil.
3.1.7 Flooding
Flooding can be a problem on land with very low gradients and within confined drainage ways. Precise data is difficult to obtain on the frequency of flood events and the classes have been determined by observations of land form, catchment geometry and soil types which reflect recent sediment deposition. A distinction should be made between fast flowing flood waters (flash floods) and flooding caused by a rise in water levels with little flow (inundation). The type and severity of impact caused by these two forms of flooding differ and therefore different types of management may be required to reduce the hazard.
Floods are a threat to human safety, causing damage to property and livestock. Thus, flood-prone land should not be used for intensive development, but should be retained for land use such as grazing, where stock can be moved to higher ground in times of increased hazard. In some areas the problem may be overcome by building levee banks or retarding basins, however there may be severe environmental problems caused by this form of management. Some modification of flooding characteristics may be possible by special management aimed at delaying surface run-off. When dealing with large catchments, the problem is a long-term hazard and a permanent limitation.
3.1.8 Organic matter
Where soil materials are to be used as road fill or for earthen dams, the presence of organic matter reduces soil quality for these purposes. Soils containing even moderate amounts of organic matter are more compressible and less stable than inorganic soils. The presence of organic material in sand for concrete is also undesirable.
When used as a medium for plant growth, a high level of organic matter is most desirable as it improves soil structure and chemical fertility. Soils high in organic matter are good for intensive cropping, however cultivation promotes rapid oxidation of organic matter and the condition of the topsoil will deteriorate if the organic matter is not replaced. Organic matter levels can be increased by sowing improved pastures, ploughing in green manure crops, and stubble retention.
3.1.9 Permeability
Soils of low permeability have poor drainage through the profile. On sloping land, lateral flow may occur above an impervious layer thereby draining the water away from the site, but on relatively flat areas such soils can become waterlogged and inhibit plant growth or become too boggy for the use of agricultural machinery. Low permeability in soils also reduces the efficiency of effluent disposal systems. This limitation can be overcome if sufficient area is available to increase the length of an absorption trench or utilise plants to transpire water from the effluent disposal area. For earthen dams, low permeability in the floor, the sides and the walls of the dam is most desirable. An extremely permeable soil may have excessive leaching of plant nutrients or an inability to retain moisture for plant growth. Such a soil may drain too rapidly to purify the effluent from septic tanks, thereby increasing the risk of polluting groundwaters or nearby streams.
3.1.10 Plasticity index
The plasticity index is a measure of the range of moisture content over which the soil is in the plastic state. A soil is most easily worked or is most readily deformed when in the plastic state. A low index indicates that the range is narrow, which is desirable where the stability of the material is important, such as in a road subgrade. However where the soil is to be cultivated, a higher plasticity index is desirable to enable working over a wider range of moisture contents.
3.1.11 Linear shrinkage (shrink-swell potential)
This relates to the capacity of clayey soil material to change in volume with changes in moisture content, and is dependant on the quantity and nature of the clay minerals present. The shrink-swell characteristics of a soil influence the capability of land for uses such as roads or buildings which require a stable substrate. Buildings and roads shift or crack in soils which undergo large changes in volume during periodic wetting and drying. Construction on soils with a high shrink-swell potential requires special techniques such as laying deeper-than-usual foundations for roads or using a reinforced concrete slab rather than stumps or strip footings for buildings.
3.1.12 Site drainage
Site drainage is influenced by soil type, soil permeability, steepness of slope, slope shape, rainfall and position in the landscape. For most land uses it is important that water flows freely from the site, since poor site drainage can result in the land becoming waterlogged and boggy, inhibiting plant growth, damaging roads and buildings through subsidence, and reducing the capacity of the area to dispose of effluent. Special works or higher levels of management may be necessary to overcome poor site drainage and this will add to the cost of development and production.
3.1.13 Slope
As the angle and length of slope increases so too does the erosion hazard. The loss of adequate ground cover during the construction of dams, roads and buildings, or on land that is cultivated or overgrazed, increases the risk of erosion. Steeper slopes are more difficult and costly to use for agricultural, forestry or road-making activities, and impose limitations on the type of machinery which can be used. Certain soil types become unstable in wet conditions. As the slope increases, the risk of mass movement also increases, particularly if large quantities of water are contained in the soil profile. Instability can occur on natural slopes, under trees or pasture, road batters and earthen dam banks. Effluent from septic tanks contains high levels of nutrients and bacterial organisms. If the absorption beds are situated on sloping land, then during wet periods when the soil profile may be saturated (from excessive rainfall and/or run-off from upslope), there is an increased risk of effluent being washed into the streams and water storages further down the catchment. This may result in adverse consequences for water quality and aquatic ecosystems.
3.1.14 Soil reaction
The pH of the soil is a measure of its acidity or alkalinity. Most plants have a pH range in which optimum growth can be expected. Soil acidification occurs as nitrates that were fixed by pasture legumes are leached from the soil, and by the addition of acids in superphosphate. With the long-term use of superphosphate and nitrogen fixing legumes, and the constant removal of grain, hay and/or animal products from the land, the topsoils in many areas have become more acid (pH < 5.5 in H20) and the potential for aluminium toxicity has increased. Acid soils and aluminium toxicity can result in a decline in plant vigour and growth.
3.1.15 Stones and gravel
The stone and gravel content in a soil can restrict land use and plant growth in the following ways:
I) reducing the available water content and nutrient supply in the profile;
ii) increasing the wear and tear on cultivating and excavating machinery;
iii) increasing the cost of harvesting root and tuber crops (e.g. potatoes).
Little can be done to overcome this limitation, other than the continual removal of stones from an area as they appear on the landsurface.
4. DETAILED MAP UNIT DESCRIPTIONS AND CAPABILITY RATINGS
Fifty-two map units have been identified in Cardinia Shire. Each of the following map units is described in a detailed two page format which provides relevant information to support land use planning and management. The information includes a general description of the map unit, detailed soil profile analysis, chemical and hydraulic properties of the soil, susceptibility and incidence of land degradation, and an assessment of the capability of the land to support various land uses.
The classes for the land capability ratings range from 1 to 5, with “1” being very good and “5” being very poor. (Refer to Tables 2.1 and 2.2 for more detailed explanations).
The potential agricultural productivity of land is generally classified by the CTS criteria (Climate, Topography and Soil). For example, the ‘ideal’ prime agricultural areas would be denoted by C1T1S1 compared with another areas that had, for example, a five to seven month length of growing season, slopes of 3 per cent and a depth to rock/hardpan of only 0.7 m, denoted by C3T2S4. (refer to Table 2.3). The overall Land Capability class of this land would be “4”; with soil factors (depth to hardrock) being the major limiting features.
Maps depicting the map units and the land capability assessments for the nominated land uses have been produced, these maps can be viewed at Cardinia Shire, Centre for Land Protection Research, or the Department of Natural Resources and Environment Office.
Note:
- Because soil observation depth did not exceed 1.5 metres, the depth to hard rock and depth to seasonal watertable have been generalised where they exceed 1.5 metres.
- pH recorded in the soil profile descriptions are laboratory pH (water) results. The pH recorded in the interpretation of laboratory analysis are CaCl2.
- Minor drainage lines have not been mapped as separate map units. Soils of minor drainage lines often have similar soils of greater depth and reduced drainage capacity to those of the surrounding map unit. Minor drainage lines are often indicated as a minor watercourse on the land capability maps.
5. ACKNOWLEDGMENTS
For their valuable help and advice the authors would like to thank Grant Boyle, Martin Bluml, Evan Jones and Les Russell.
Ian Sargeant is acknowledged for his assistance in identifying the soils of the Koo-we-rup area.
Gathering of soils information would not be possible without the support of the landholders in the district, who provided access to their properties. The authors would like to thank those landholders and their families for allowing detailed soil and landform information to be collected on their properties.
The land capability study for the Cardinia Shire Council was jointly funded by the Cardinia Shire Council, the Department of Natural Resources and Environment and the National Landcare Program.
6. REFERENCES
Australian Standard 1289 (1977). Methods of Testing Soils for Engineering Purposes. Standards Association of Australia. Standards House, Sydney.
Charman, P.E.V. and Murphy, A.W., Eds. (1991). Soils: their properties and management. Sydney University Press; Soil Conservation Service, NSW.
Craze, B. and Hamilton, G.J. (1991). Soil physical properties. Ch. 10. Charman, P.E.V. and Murphy, B.W. (eds) In: Soils: their properties and management. University Press, Sydney.
Department of Natural Resources and Environment, Industry and Resource Information Section (1996). Major agricultural aoils of the Crandourne and Koo-wee-rup vegtable growing region
Elliot, G.L. and Leys, J.F. (1991). Soil erodibility. Ch. 12. In Soils: their properties and management. Eds. P.E.V. Charman and B.W. Murphy. Sydney University Press; Soil Conservation Service, NSW.
Emerson, W.W. (1977). Physical properties and structure. In Soil factors in crop production in the semi-arid environment. Eds. Russell, J.S. and Greacen, J.S. University of Queensland Press.
Emerson, W.W. 1967. A classification of soil aggregates based on their coherence in water. Aust. J. Soil Res. 5, 47 - 57.
Environment Protection Authority, Department of Water Resources and Health Department. (1990). Septic tanks code of practice.
Goudie, A.G. (1942). A survey of soils and land utilization in the parishes of Koo-wee-rup and Koo-wee rup East. Proc. Roy. Soc. Victoria, 54 (NS) Pt 1 93-130.
Goss, H.M. ,Reimers T., van de Graff, R. H. M. (1987) Land capability study of the Westernport Catchment. Department of Conservation Forests and Lands.
Hicks, R.W. (1991). Soil engineering properties. Ch. 11. In Soils: their properties and management. Eds. P.E.V Charman and B.W. Murphy. Sydney University Press; Soil Conservation Service, NSW.
Hutton, T.J. (1955). A method of particle size analysis of soils. Divisional Report No. 11/55, CSIRO, Division of Soils.
Isbell, R.F. (1994). Final Draft. A Classification System for Australian Soil Classification. January 1995, CSIRO Division of Soils (unpublished).
Lorimer, M.S. (1985). Estimating the susceptibility of soil to wind erosion in Victoria. J. Aust. Inst. Ag. Sci. 51: 122-126.
Loveday, J. and Pyle, J. (1973). The Emerson Dispersion Test and its relationship to hydraulic conductivity. Tech. Pap. 15, CSIRO Divn. Soils. CSIRO, Melbourne.
Maheswaran, J. and Crawford, D.M. (1992). Soil acidity and acidification in Victoria: a state-wide perspective. In: Acid Soils: Research and Extension Seminar Paper. State Chemistry Laboratory.
McDonald, R.C., Isbell, R.F., Speight, J.G., Walker, J. and Hopkins, M.S. (1984). Australian soil and land survey - field handbook. Inkata Press.
Northcote, K.N. (1979). A factual key for the recognition of Australian soils. Rellim Technical Publications Pty. Ltd., South Australia.
Rosengren, N.J. (1984) Sites of Geological Significance in the Westernport Bay Catchment. Department of Conservation Forests and Land.
Rowan, J. (1990). Land systems of Victoria. Land Protection Division, Department of Conservation and Environment.
Rowe, R.K., Howe, D.F., and Alley, N.F. (1980). Manual of Guidelines for Land Capability Assessment in Victoria. moisture characteristics of soil. J. Soil Sci. 20: 126-31.
Sargeant, I.J. (1975) A soil survey of the Westernport Bay Catchment. Prepared for the Westernport Bay Environment Study, Project report No. 22.
Sargeant, I.J.(1993) Soil quality assessment Horticultural Zone Amendment L71. Prepared for the Shire of Pakenham.
Sargent,I.J., (1994) Soil quality report Shire of Cranbourne. Prepared for the Shire of Cranbourne.
Salter, P.J. and Williams J.B.(1969). The influence of texture on the moisture characteristics of soil. V. Relationships between particle size composition and moisture contents at the upper and lower limits of available water. J. Soil Sci. 20: 126-31.
PREFACE
The Department of Natural Resources and Environment has been involved in formal land capability assessment studies since the early 1970s. The Land Capability Section of the (then) Soil Conservation Authority established the framework for the conduct of formal land capability studies upon which this more recent work is based. This framework included rating tables for some thirty activities. Ratings for various activities were presented as thematic maps, or combined into ratings for various land uses, depending upon the needs and abilities of the client.
It was proposed to undertake detailed Land Capability Studies in municipalities with significant pressures for change in land use to more intensive uses, where there was significant existing or potential land degradation issues, or where better quality agricultural land was under threat of development for residential purposes.
The primary objective has been to provide the municipality with detailed land resource information, consisting of base data on the nature of the land, and assessment of the likely performance of the land under various activities. This information can underpin many land use and management decisions by the municipal authority, both now and in the future. In doing so, many of the problems and unexpected costs incurred through inappropriate land use can be avoided.
USER GUIDE
The user guide is designed to assist document users in finding and cross referencing information contained within this report. Each section of the report is represented below with a brief description of the contents and the relationship to other sections.
EXAMPLE: This hypothetical example is designed to assist users to understand the interrelationship between the different sections in the report and the use of the accompanying maps.
| Scenario: Determining the feasibility of further development north of Packenham Upper, (Map 1a) requiring secondary roads, septic tanks and building foundations. |
Step 1: Locate site on the Base Map and establish the map unit, for example, Dgd.
Step 2: Refer to Table i.i, in the Summary (p ix), for a general idea of the capability of this map unit to support the specified land uses AND / OR use the Land Capability Assessment for Secondary Roads, and Land Capability Assessment for Effluent Disposal maps. Locate the site and refer to the legend which will provide the rating and the limiting features.
Step 3: Inspect site. Refer to the core section of the report - Section 5. Detailed Map Unit Descriptions - and find the relevant map unit, Dgd (p 94). This will give a detailed description of the soil and landscape features of this map unit. Due to the broad scale of the maps, the first step is to determine whether the detailed soil and landscape features are similar to what is found on the site of interest. If not, the site may be similar to another map unit description or it may be an anomaly and therefore an individual study of the site may need to be carried out.
If the site is similar, the Land Capability Assessment table will give the rating for the land uses in question. For this example, the land capability ratings are:
- Secondary Roads: Rating 4 - Limiting features: slope and drainage.
- Effluent Disposal: Rating 4 - Limiting feature: drainage and permeability.
- Building Foundations: Rating 4 - Limiting features: slope and drainage.
Step 5: Section 3. Land Management Guidelines (chapter 3 p 14) will explain the limitations specified in step 3 (i.e. drainage for effluent disposal, and proportion of stones and boulders and linear shrinkage for secondary roads) and whether they can be reduced or overcome by an improved level of management.
Step 6: If the limitations can be overcome, referring to Appendix B will show if there are any other limitations which need to be overcome to allow the development to take place without causing degradation to land and water quality.
NOTE: Section 4.4 Devonian granitic map units (p 85). Understanding the whole study area is important in making planning decisions as development may be capable of occurring on the site of interest but the off-site effects may be considerable.
The process of how and when to use the various sections of the report is largely up to the user. There may be times when the user may need to refer to different sections of the report, particularly a new user, to ensure that they have a full understanding of the Land Capability Assessment process. For example, understanding the process of determining the Land Capability Assessment ratings is very important, therefore the user will need to refer to Section 2. Land Capability Assessment and Appendix A to establish how the ratings were determined.
SUMMARY
This study describes in detail the land present in the Cardinia Shire and provides information relevant to land use planning and assessment.
A land capability study provides a planning tool to assist the Shire in the development of a detailed planning scheme. It will facilitate the planning of future land use through a systematic and rational examination of the lands management requirements, and the consequences of undertaking a range of alternative land uses. Revision of the planning scheme, based on sound land resources information, is required to direct development away from areas not well suited to certain uses, and to maintain a balance between competing land uses and the better quality agricultural land, in the interest of the whole community.
The former Shire of Pakenham (area approximately 880 square kilometres) has now become incorporated into the Cardinia Shire. The new shire also includes a large area in the south, previously part of the City of Cranbourne, as well as an additional area close to the township of Emerald which was previously part of the former Shire of Sherbrooke. The Cardinia Shire has an area of approximately 1260 square kilometres.
The Shire has seen significant population growth over the last few decades due to its easy commuting distance to Melbourne and Dandenong by way of the Princes Highway and the Warragul Railway system. Growth has been concentrated around towns close to the highway, however there is increasing pressure for development away from the area set aside as the major growth corridor. The areas under pressure include Upper Beaconsfield, Gembrook, Cockatoo, Emerald and Maryknoll. It is well established that indiscriminate development of land for small lot rural and residential development may result in extensive land and water degradation, loss of good agricultural land and unnecessarily high development and maintenance costs.
The protection of good quality agricultural land is becoming increasingly important as rural residential development is encroaching upon and fragmenting the remaining highly productive areas. Identification of good quality agricultural land has, to a large extent, already been carried out in the alluvial area of the Koo-wee-rup swamp in the studies by Sargeant (1993, 1994). The Tertiary volcanic soils around Gembrook and Emerald are also valuable for horticultural production and will come under further pressure for rural residential development.
The agricultural ratings for this area show significant areas with ratings of class 3, while some areas have been categorised as class 4. Although the class 4 ratings occur on quite productive soils, the limitation for agriculture is commonly the steepness of the slope. The areas with a very poor rating (class 5) due to the very steep slopes, are generally too steep to be cultivated and are either not used for agricultural purposes or are used only for grazing.
The Shire has a diverse range of landforms including broard alluvial plains, gentle undulating rolling hills and steep hills. Steep slopes are associated with Silurian sediments and Devonian granite, and this land is often prone to sheet and gully erosion. Because of the favourable climate and long growing season, significant ground cover is present all year. This ground cover mitigates against significant erosion in many situations, however any practice that removes ground cover will greatly accelerate the rate of erosion. Increased erosion will occur around house sites, road batters, drains, eroded stream banks and bare cultivated paddocks. Westernport Bay is the ultimate destination for much of this eroded material.
An emerging problem in the shire is the increase in area of salt affected land. Salt discharge areas are becoming visible in the lower lying areas. Salt affected areas are particularly visible upslope of the Princes Highway and the railway line. Construction of the road and railway has created some compaction of the subsoil. This compaction restricts the flow of groundwater causing it to rise at certain points. As the level of groundwater approaches the rooting zone of trees, shrubs and grasses these plants die from the high levels of dissolved salts present in the groundwater. The rise in groundwater is primarily caused by the clearing of trees further up the catchment. Additionally, annual pastures that have replaced the trees use less water thereby compounding the salt problem. Many bores monitoring groundwater levels in the area show significant rises.
The high amount of ground cover in the summer months on the basalt soils aids in reducing the amount of erosion that may otherwise occur due to the steepness of the slopes. However when sheet erosion does occur, the topsoil is often washed into dams and streams leading to siltation and declining water quality. Improved cultivation practices, including the establishment of buffer zones around streams and drainage lines will reduce some of the siltation into the drainage lines.
Table i.i Summary of land capability classes.
Note: Please refer to Section 4 (Detailed Map Unit Descriptions and Capability Ratings) for further information.
MAP UNIT | LAND CAPABILITY RATING | ||||||
Symbol | Description | Agriculture | Effluent Disposal | Farm Dams | Building Foundations | Secondary Roads | Rural Residential |
Qa1 | Quaternary alluvium, Koo-wee-rup peaty clay | 2 | 5 | 3-4 | 5 | 5 | 5 |
Qa2 | Quaternary alluvium, Koo-wee-rup peaty clay with sandy ridges | 2 | 4 | 4 | 4 | 4 | 4 |
Qa3 | Quaternary alluvium, Narre clay loam | 3 | 4 | 3 | 3 | 3 | 4 |
Qa4 | Quaternary alluvium, Narre clay loam with sandy ridges | 2 | 3 | 3-4 | 3 | 3 | 3-4 |
Qa5 | Quaternary alluvium, Tynong clay loam | 3 | 3-4 | 3 | 3 | 3 | 3-4 |
Qa6 | Quaternary alluvium, Dalmore clay (non-peaty) | 3 | 4 | 5 | 3 | 5 | 5 |
Qa7 | Quaternary alluvium, Dalmore clay (heavy -surface)) | 2 | 3 | 4 | 3 | 3 | 4 |
Qa8 | Quaternary alluvium, Toomuc clay loam | 3 | 4 | 3 | 3 | 3 | 4 |
Qa9 | Quaternary alluvium, Monomeith clay loam | 3 | 4 | 4 | 3 | 3 | 4 |
Qa10 | Quaternary alluvium, Unclassified sandy ridges | 3 | 3 | 3 | 3 | 3 | 3 |
Qa11 | Quaternary alluvium, Monomeith clay loam with sandy ridges | 3 | 4 | 3 | 3 | 3 | 4 |
Qa12 | Quaternary alluvium, Dalmore clay | 3 | 4 | 5 | 3 | 5 | 5 |
Tvb1 | Tertiary volcanics, steep slope | 5 | 5 | 5 | 5 | 5 | 5 |
Tvc1 | Tertiary volcanics, moderately steep slope | 4 | 4 | 5 | 4 | 4 | 5 |
Tvd1 | Tertiary volcanics, moderate slope | 3 | 3 | 4 | 4 | 4 | 4 |
Tve1 | Tertiary volcanics, gentle crest | 2 | 2 | 4 | 3 | 3 | 4 |
Tvf1 | Tertiary volcanics, gentle slope | 2-3 | 2 | 4 | 3 | 3 | 4 |
Tvh1 | Tertiary volcanics, drainage depression | 2-3 | 3 | 4 | 4 | 4 | 4 |
Tvb2 | Tertiary volcanics, remnant capping, steep slope | 5 | 5 | 5 | 5 | 5 | 5 |
Tvc2 | Tertiary volcanics, remnant capping, moderately steep slope | 4 | 4 | 5 | 4 | 4 | 5 |
Tvd2 | Tertiary volcanics, remnant capping, moderate slope | 3 | 3 | 4 | 4 | 4 | 4 |
Tve2 | Tertiary volcanics, remnant capping, gentle crest | 2 | 2 | 4 | 3 | 3 | 4 |
Tvf2 | Tertiary volcanics, remnant capping, gentle slope | 3-2 | 2 | 4 | 3 | 3 | 4 |
Tvh2 | Tertiary volcanics, remnant capping, drainage depression | 2-3 | 3 | 4 | 4 | 4 | 4 |
Tsd | Tertiary sediments, moderate slope | 3 | 3 | 4 | 4 | 4 | 4 |
Tse | Tertiary sediments, gentle crest | 3 | 2 | 4 | 3 | 3 | 4 |
Tsf | Tertiary sediments, gentle slope | 3 | 4 | 3 | 4 | 4 | 4 |
Tsg | Tertiary sediments, very gentle slope | 3 | 4 | 3 | 4 | 4 | 4 |
Tsh | Tertiary sediments, drainage depression | 3 | 4 | 3 | 4 | 4 | 4 |
Dga | Devonian granitic, steep crest. | 4 | 4-3 | 5 | 4 | 4 | 5 |
Dgb | Devonian granitic, steep slope | 5 | 5 | 5 | 5 | 5 | 5 |
Dgc | Devonian granitic, moderately steep slope | 4 | 4 | 5 | 4 | 4 | 5 |
Dgd | Devonian granitic, moderate slope | 3 | 4 | 4 | 4 | 4 | 4 |
Dge | Devonian granitic, gentle crest | 4 | 5 | 5 | 5 | 5 | 5 |
Dgf | Devonian granitic, gentle slope | 4 | 4 | 3 | 4 | 4 | 4 |
Dgg | Devonian granitic, very gentle slope | 4 | 4 | 3 | 4 | 4 | 4 |
Dgh | Devonian granitic, drainage depression | 5 | 5 | 5 | 4 | 4 | 5 |
Dgi | Devonian granitic, flat | 5 | 5 | 5 | 4 | 4 | 5 |
Sma | Silurian metamorphic, steep crest | 3-4 | 3-4 | 5 | 3 | 3 | 5 |
Smb | Silurian metamorphic, steep slope | 5 | 5 | 5 | 5 | 5 | 5 |
Smc | Silurian metamorphic, moderately steep slope | 4 | 4 | 5 | 4 | 4 | 5 |
Smd | Silurian metamorphic, moderate slope | 5 | 3 | 4 | 5 | 5 | 5 |
Smf | Silurian metamorphic, gentle slope | 5 | 3 | 4 | 5 | 5 | 5 |
Smh | Silurian metamorphic, drainage depression | 3 | 4 | 5 | 4 | 4 | 5 |
Ssa | Silurian sediments, steep crest | 3-4 | 3-4 | 4-5 | 3 | 3 | 4-5 |
Ssb | Silurian sediments, steep slope | 5 | 5 | 5 | 5 | 5 | 5 |
Ssc | Silurian sediments, moderately steep slope | 4 | 4 | 5 | 4 | 4 | 5 |
Ssd | Silurian sediments, moderate slope | 3 | 3-4 | 4-5 | 4 | 4 | 4-5 |
Sse | Silurian sediments, gentle crest | 3 | 3 | 4 | 2 | 3 | 4 |
Ssf | Silurian sediments, gentle slope | 3 | 4 | 4 | 4 | 4 | 4 |
Ssg | Silurian sediments, very gentle slope | 3 | 4 | 3 | 4 | 4 | 4 |
Ssh | Silurian sediments, drainage depression | 3 | 4 | 3 | 4 | 4 | 4 |
Ssi | Silurian sediments, flats | 3 | 4 | 3 | 4 | 4 | 4 |
1.1 Overview
Land varies considerably in its basic characteristics and its response to the demands made upon it. Such demands include the production of food, fibre, water, and development for residential, industrial and recreational purposes.
Planners need to match the requirement of land use with the capability of the land to sustain that use and avoid land degradation. Prior knowledge of soil and land limitations can prevent unnecessary and costly mistakes. Information obtained through land capability assessments can provide the necessary data to assist local government with planning decisions and the preparation of planning strategies for the future.
Planning schemes developed and implemented by local government provide an effective means of managing changes in land use. A planning scheme may prohibit or place conditions on land use not well suited to a land type.
This report provides land resource information for broad-scale planning within the Cardinia Shire. It does not provide recommendations for land use and no allowance has been made for social or economic considerations which may influence planning proposals. It is primarily an examination of potential consequences and levels of management required for a range of land uses.
A previous study covering the former Shire of Pakenham, Land Capability Study of the Westernport Catchment by Goss, H.M., Reimers, T.. and van de Graff, R. H. M. (1987), has been used as a background to this study.
| 1.2 Location The Cardinia Shire covers an area of around 1260 square kilometres and is located approximately 50 kilometres south east of Melbourne (Figure 1.1). 1.3 Purpose of study | Figure 1.1 Location of Cardinia Shire |
In planning for the future use of land in the shire, there is a need to preserve the qualities that make this area attractive, both economically and aesthetically, whilst also accommodating population growth. It is important to preserve better agricultural land and farming enterprises because of their significant input to the economy of the region.
To ensure a sound base for future planning strategies, the Cardinia Shire Council requested a land capability study by the Department of Natural Resources and Environment.
1.4 Objectives
Major Objective:
To provide land resource information to the Cardinia Shire Council that will facilitate the planning of future land use through a systematic and rational examination of management requirements, and consequences of a range of alternative land uses.
More specifically:
1. To map and describe the freehold land of the Cardinia Shire which is under increased pressure for conversion to rural residential development at a scale of 1:10 000. This will involve identifying dominant land types (including soil types and topography), climatic zones and other land characteristics relevant to the assessment of the capability of the land. These are areas that surround the existing townships of Emerald, Upper Beaconsfield, Gembrook, Maryknoll and Bunyip (see Figure 1.2).
2. To map and describe the freehold land of the former Cardinia Shire at a scale of 1:25 000 (excluding existing urban areas and public land) identifying dominant land types, climatic zones and other features relevant to the assessment of the capabilities of the land.
3. To prepare land capability analyses based on standardised rating tables of the 1:25000 study and the 1:10000 area.
- agriculture,
- effluent disposal (septic tanks),
- farm (earthen) dams,
- building foundations,
- secondary roads
- rural residential development allotment size of 0.5-2 ha.
- topographic base map, including tree cover and map units, and
- thematic land use maps with land capability classes.
6. To provide the Shire with a digital copy of the land capability information gathered.
7. To assist the Cardinia Shire Council in the incorporation of this land resource information into its planning strategies.
2. LAND CAPABILITY ASSESSMENT
2.1 Philosophy and principles
Land capability assessment is a rational and systematic method of determining the ability of land to sustain a specific use and level of management, without causing significant long-term degradation.
The objectives of land capability assessments are:
- to assist land managers and land use planners to identify areas of land with physical constraints for a range of nominated land uses;
- to identify management requirements that will ensure a particular land use can be sustained without causing significant on-site or off-site degradation to land or water quality.
Land capability assessments analyse basic landform and soil information to determine the ability of the land to sustain a desired land use. A strength of the methodology lies in its association with land systems since the results can be extrapolated, with care, to similar land components and land systems in other areas (Refer to 4.2).
| The ratings provided by a land capability assessment are not intended to restrict development of land, but rather to identify the principal constraints of that land for a specified land use. It is a matter for the land manager or land use planner to decide if the cost of overcoming the constraints is justified. Where particularly severe physical constraints exist, the planning authority has the option of excluding that land from that use, or permitting the use only under strict conditions. The placement of conditions on development permits is quite a proper exercise of planning responsibility. |
2.2 Land resource mapping - methodology and constraints
The main objective of land resource mapping is to identify areas of land that are uniform with respect to the characteristics that affect land use. These areas of land will have a similar land use capability for a nominated use and are likely to respond in a similar way to management. By identifying areas of land with a limited range of variability, the resultant map provides the basis for land capability assessment (for specific methodologies, refer Appendix C).
Mapping an area of land can be a complex task as many differences arise due to interactions between climate, geology and topography. While it is possible to measure and determine some of the land characteristics such as slope, rock outcrop, and soil type, other characteristics such as site drainage, and permeability are less easily determined.
The following procedure has been adopted for this study:
- The geological boundaries are obtained from existing maps and verified in the field at the appropriate mapping scale.
- The broad landform pattern and the landform elements are identified from air-photos using a binocular stereoscope. The map units are derived from this information.
- Extensive field verification of map units ensure that map units are consistent with respect to parent material, slope, position in the landscape, soil type, drainage and native vegetation.
- A representative site for each map unit is selected, to record general landform and site information. The incidence of any land degradation in each map unit is also recorded.
- A soil pit or large exposure of the soil profile is prepared at each selected site. Detailed soil profile information is recorded. Colour photographs are taken and soil samples collected for physical and chemical analyses (see Appendix D and the corresponding tables for each Land Unit in Section 4.2 for details).
- The permeability of the soil profile is measured when the soils are near field capacity (see Appendix C).
- The map unit boundaries are entered into a Geographic Information System where the data is combined with base-map information on roads, contours and streams to produce a final base map of the study area with appropriate headings and legend.
- Land capability ratings for those land uses relevant to the study are derived from the climatic, land and soil data available for each map unit based on standardised rating tables. Separate land capability assessment maps are prepared for the specified land uses.
- A report is prepared to provide accompanying land resource information and methodology for the land capability maps.
2.3 Assessment procedure
A land capability rating table lists key land characteristics such as slope, site drainage or soil depth, which may affect the ability of the land to support a specified land use. These land characteristics are quantified and graded into classes for the land use being assessed. Each map unit within the study area is given a capability class according to the tables shown in Section 2.4.
It is the most limiting factor that determines the Capability Class for the map unit. This is related to the degree of limitation for that land use and the general level of management that will be required to minimise degradation.
A Capability Class of one represents essentially no physical limitations to the proposed land use whilst a Class of five indicates a very low capability to sustain the land use. Limitations in Class five generally exceed the current level of management skills and technology available. Severe deterioration of the environment is likely to occur if development is attempted. A Class of two, three or four will require increasing levels of management to sustain the particular land use, otherwise the environment will deteriorate.
Separate class descriptions are prepared for agriculture (Table 2.1) and other land uses (Table 2.2). Due to the scale of mapping adopted (1:25 000), the inherent variability within some landscapes may result in the presence of small unrepresentative areas within map units. In some cases, these areas will have a capability class exceeding that of the overall map unit. An opportunity may therefore exist to utilise land with less constraints for the chosen development.
2.4 Land capability rating tables
Each land capability rating table (refer Tables 2.3, 2.4, 2.5, 2.6, 2.7, 2.8) contains criteria which will strongly influence the ability of the land to sustain the desired land use. The limitations distinguishing each land capability class from one to five are also presented for comparison.
There has been no attempt to rank the criteria in order of importance. The objective of having classes is to identify the kind of limitation and its severity. It is recognised that criteria may interact, but an underlying objective of this study is to provide the information in a useable form, rather than have a convoluted series of alternative pathways that would be too complex for the intended user to follow.
Where there are known interactions between different criteria, it is the responsibility of the planner or land manager to assess the importance of the limiting factor(s) and to determine the need for management or additional financial input to overcome the limitation.
Theoretically a single diagnostic land quality could be found and used to rate land performance, but there is the risk of such a feature masking the true parameters that affect the land use, thus preventing a change to a more appropriate land use or level of management. Land use and land management practices will continue to change and if the community is concerned about long-term sustainability of specific land uses, then the limitations of the soil, the various processes of land degradation, and the possibility of off-site effects, must be recognised. Once a limitation to land use is identified, steps can be taken to overcome or minimise the long-term effect of land degradation that would result if the land use was continued.
Table 2.1 Land capability classes for agriculture.
CLASS | CAPABILITY | DEGREE OF LIMITATION |
Class 1 | Very good | Can sustain a wide range of uses including an intensive cropping regime. Very high levels of production possible with standard management levels. |
Class 2 | Good | Moderate limitations to agricultural productivity, overcome by readily available management practices. |
Class 3 | Fair | Can sustain agricultural uses with low to moderate levels of land disturbance such as broadacre cultivation in rotation with improved pastures. Moderate to high levels of production possible with specialist management practices such as minimum tillage. |
Class 4 | Poor | Low capacity to resist land disturbance such as cultivation. Moderate production levels possible with specialist management such as improved pasture establishment with minimum tillage techniques. Recommended for low disturbance agriculture such as grazing or perennial horticulture. |
Class 5 | Very poor | Very low capability to resist disturbance. Areas of low productive capacity. Minimal grazing levels or non-agricultural uses recommended. |
Note: Land is assessed for agricultural production on the basis of climate, topography, and the inherent characteristics of the soil. Climate differs from topography and soil features in that it is a regional parameter rather than site specific. The capability table identifies the versatility and potential productivity of an area for a range of agricultural uses, and highlights the necessary level of management required to sustain the land use.
These agricultural ratings are for comparative purposes only and should not be used as a basis for detailed property planning.
Table 2.2 Land capability classes for effluent disposal, farm dams, building foundations and secondary roads.
| CLASS | CAPABILITY | DEGREE OF LIMITATION TO DEVELOPMENT | GENERAL DESCRIPTIONS AND MANAGEMENT GUIDELINES |
| Class 1 | Very good | The limitation of long term instability, engineering difficulties or erosion hazards do not occur or they are very slight. | Areas with high capability for the proposed use. Standard designs and installation techniques, normal site preparation and management should be satisfactory to minimise the impact on the environment. |
| Class 2 | Good | Slight limitations are present in the form of engineering difficulties and/or erosion hazard. | Areas capable of being used for the proposed use. Careful planning and the use of standard specifications for site preparation, construction and follow up management are necessary to minimise the impact of the development on the environment. |
| Class 3 | Fair | Moderate engineering difficulties and/or moderately high erosion hazard exist during construction. | Areas with a fair capability for the proposed use. Specialised designs and techniques are required to minimise the impact of the development on the environment. |
| Class 4 | Poor | Considerable engineering difficulties during development and/or a high erosion hazard exists during and after construction. | Areas with poor capability for the proposed use. Extensively modified design and installation techniques, exceptionally careful site preparation and management are necessary to minimise the impact of the development on the environment. |
| Class 5 | Very poor | Long term severe instability, erosion hazards or engineering difficulties which cannot be practically overcome with current technology. | Performance of the land for the proposed use is likely to be unsatisfactory. Severe deterioration of the environment will occur if development is attempted in these areas. |
Table 2.3 Land capability assessment for agriculture.
Parameters influencing AGRICULTURAL PRODUCTION | Land Capability Ratings | |||||
Class 1 | Class 2 | Class 3 | Class 4 | Class 5 | ||
| C: Climate | Length of growing season (months) | 12 - 11 | 10 - 8 | 7 - 5 | 4 - 2 | < 2 |
| T: Topography | Slope (%) | 1 - 3 | 4 - 10 | 11 - 20 | 21 - 32 | > 32 |
| S: Soil | Condition of topsoil * | 25 - 21 | 20 - 16 | 15 - 11 | 10 - 6 | 5 - 1 |
| Depth of topsoil (mm) | > 300 | 300 - 160 | 150 - 110 | 100 - 50 | < 50 | |
| Depth to rock/hardpan (m) | > 2.0 | 2.0 - 1.5 | 1.5 - 1.0 | 1.0 - 0.5 | < 0.5 | |
| Depth to seasonal watertable (m) | > 5.0 | 5.0 - 2.0 | 2.0 - 1.5 | 1.5 - 1.0 | < 1.0 | |
| Total amount of water (mm) available to plants * | > 200 | 200 - 151 | 150 - 101 | 100 - 51 | 50 - 0 | |
| Index of permeability/rainfall * | Very high | High | Moderate | Low | Very low | |
| Dispersibility of topsoil (Emerson) * | E6, E7, E8 | E3(1), E3(2), E4, E5 | E3(3), E3(4) | E2 | E1 | |
| Gravel/stone/boulder content (v/v %) * | 0 | 1 - 10 | 11 - 25 | 26 - 50 | > 50 | |
| Electrical conductivity(µs/cm) * | < 300 | 300 - 600 | 600 - 1400 | 1400 - 3500 | > 3500 | |
| Susceptibility to sheet/rill erosion *+ | Very low | Low | Moderate | High | Very high | |
| Susceptibility to gully erosion *+ | Very low | Low | Moderate | High | Very high | |
| Susceptibility to wind erosion *+ | Very low | Low | Moderate | High | Very high | |
Note: The potential agricultural productivity of land is generally classified by the CTS criteria (Climate, Topography and Soil), e.g. the ‘ideal’ prime agricultural areas would be denoted by C1 T1 S1 compared with another area that had, for example, a 5 - 7 month growing season, slopes of 3% and a depth to rock/hardpan of only 0.7 m, denoted by C3T2 S4. The overall Land Capability Class of this latter land would be 4; with soil factors being the major limiting features.
* See Appendix A.
+ The susceptibility to erosion ratings for the Cardinia Shire have been improved by one rating due to the high growth rate
and ground cover during the summer months.
Table 2.4 Land capability assessment for on-site effluent disposal.
Parameters influencing EFFLUENT DISPOSAL | Land capability ratings | ||||
Class 1 | Class 2 | Class 3 | Class 4 | Class 5 | |
| Slope (%) * | < 3 | 3 - 10 | 11 - 20 | 21 - 32 | > 32 |
| Flooding risk * | Nil | Low | Moderate | High | Very high |
| Drainage * | Rapidly drained | Well drained | Moderately well drained | Imperfectly drained | Poorly drained |
| Depth to seasonal watertable (m) | > 2.0 | 2.0 - 1.5 | 1.5 - 1.0 | 1.0 - 0.5 | < 0.5 |
| Depth to hard rock/impermeable layer (m) | > 1.5 | 1.0 - 1.5 | 1.0 - 0.75 | 0.75 - 0.5 | < 0.5 |
| Number of months/year when average daily rainfall > Ksat * | 0 | 1 | 2 | 3 | > 3 |
| Permeability (Ksat mm/day) * | > 500 ** | 500 - 100 | 100 - 50 | 50 - 10 | < 10 |
Note: Areas capable of absorbing effluent from a standard anaerobic, all-waste, septic tank connected to a single family dwelling (approximate output of 1000 litres per day).
10 mm/day is equivalent to disposing of 1000 l/day along a 0.5 x 200 m trench
* See Appendix A
** Permeability > 1000 mm/day could pollute groundwater.
Table 2.5 Land capability assessment for earthen dams.
Parameters influencing the construction of EARTHEN DAMS | Land capability ratings | ||||
Class 1 | Class 2 | Class 3 | Class 4 | Class 5 | |
| Slope (%) * | 3 - 7 | 0 - 3 | 7 - 10 | 10 - 20 | > 20 |
| Linear shrinkage (%) * | 0 - 5 | 6 - 12 | 13 - 17 | 18 - 22 | > 22 |
| Suitability of subsoil * | Very high | High | Moderate | Low | Very low |
| Depth to seasonal watertable (m) | > 5 | 5 - 2 | < 2 | ||
| Depth to hard rock (m) | > 5 | 5 - 3 | 3 - 2 | 2 - 1 | < 1 |
| Permeability (Ksat mm/day) * | < 1 | 1 - 10 | 11 - 100 | 101 - 1000 | > 1000 |
| Dispersibility of subsoil (Emerson) | E3(2), E3(3) | E3(1), E3(4) | E2(1), E2(2), E5(A), E5(B) | E2(3), E2(4), E5(C), E5(D) | E1, E6, E7, E8 |
| Susceptibility to slope failure | Very low | Low | Moderate | High | Very high |
Note: This table should only be considered for small farm dams to 1000 m3 in capacity, that have a top water level less than 3 m above the original ground surface at the upstream side of the wall.
Rock outcrop, depth of topsoil and flooding risk were also considered but have not been included for reasons given in Appendix A.
* See Appendix A.
Table 2.6 Land capability assessment for building foundations.
Parameters influencing BUILDING FOUNDATIONS | Land capability ratings | ||||
Class 1 | Class 2 | Class 3 | Class 4 | Class 5 | |
| Slope (%) i) Slab ii) Stumps/footings | 0 - 1 0 - 5 | 2 - 5 6 - 10 | 6 - 10 11 - 30 | 11 - 30 30 - 45 | > 30 > 45 |
| Drainage * | Rapidly drained | Well drained | Moderately well drained | Imperfectly drained | Poorly drained |
| Depth to seasonal watertable (m) | > 5 | 5 - 2 | 2 - 1 | 1 - 0.5 | < 0.5 |
| Proportion of stones and boulders (v/v %) | 0 | 1 - 10 | 11 - 20 | 21 - 50 | > 50 |
| Depth to hardrock (m) | > 1.5 | 1.5 - 0.75 | 0.75 - 0.51 | 0.5 - 0.25 | < 0.25 |
| Susceptibility to slope failure * | Very low | Low | Moderate | High | Very high |
| Linear shrinkage (%) * i) Slab ii) Stumps/footings | < 12 < 6 | 13 - 17 7 - 12 | 18 - 22 13 - 17 | 22 - 30 18 - 22 | > 30 > 22 |
| Flood risk | Nil | Low | Moderate | Moderate/high | High |
Note: Areas capable of being used for the construction of buildings of one or two stories. It is assumed that any excavation will be less than 1.5 m and can be completed by a tractor-backhoe or equipment of similar capacity. Two methods of construction are considered:
i) Concrete slab - 100 mm thick and reinforced
ii) Stumps or strip footings
* See Appendix A.
Table 2.7 Land capability assessment for secondary roads.
Parameters influencing SECONDARY ROADS | Land capability ratings | ||||
Class 1 | Class 2 | Class 3 | Class 4 | Class 5 | |
| Slope (%) | 0 - 1 | 2 - 5 | 6 - 10 | 11 - 30 | > 30 |
| Drainage * | Rapidly drained | Well drained | Moderately well drained | Imperfectly drained | Poorly drained |
| Depth to seasonal watertable (m) | > 5 | 5 - 2 | 2 - 1 | 1 - 0.5 | < 0.5 |
| Proportion of stones and boulders (v/v %) * | 0 | 1 - 10 | 11 - 20 | 21 - 50 | > 50 |
| Depth to hard rock (m) | > 1.5 | 1.5 - 0.75 | 0.75 - 0.51 | 0.5 - 0.25 | < 0.25 |
| Susceptibility to slope failure * | Very low | Low | Moderate | High | Very high |
| Linear shrinkage (%) * | < 6 | 7 - 12 | 13 - 17 | 18 - 22 | > 22 |
| Bearing capacity (kPa) * | > 50 | - | < 50 | - | - |
| Flooding risk* | Nil | Low | Moderate | High | Very high |
| Dispersibility of subsoil Emerson (> 4% slope) * | E6, E7, E8 | E4, E5, E3(1), E3(2) | E3(3), E3(4) | E2 | E1 |
| Unified Soil Group | GW, GC, SC | SM, SW, GM | SP, CL, CH, MH, GP | ML | Pt, OH, OL |
Note: Areas capable of being used for the construction of earthen roads for light vehicles without sealed surfaces or concrete drainage and kerbing.
* See Appendix A.
Table 2.8 Land capability assessment for rural residential and rural farmlet development
Rural residential development (0.4 ha - 2.0 ha) | Rural farmlet (> 5.0 ha) | ||
| Building foundations | No change to capability class | Building foundations | No change to capability class |
| Secondary roads | No change to capability class | Secondary roads | No change to capability class |
Effluent disposal | No change to capability class | Effluent disposal | Improve rating by one class if major limitation is due to permeability, drainage and depth to hardrock.
No change to rating class if another criteria is the major limitation present |
Earthen dams | No change to capability class | Earthen dams | Improve rating by one class.
No change where slope, rapid permeability, risk of slope failure and dispersibility are the major limitations present |
Rural residential development involves a range of land uses: building foundations, earthen dams, effluent disposal and secondary roads. There is a need to consider the capability of each individual land use in assessing the overall capability of a map unit to sustain rural residential development. More intensive use of the land will require an improved level of management to reduce the likelihood of land degradation.
The land and soil within certain map units can vary substantially in the Cardinia Shire. This variation within a map unit is more likely to occur with large size allotments. It is recognised that in areas greater than 5 ha, detailed site inspection can highlight areas with a higher capability to support a given land use. For example, dam construction may be restricted by shallow soil depth on a small allotment (less than 2 ha), however on a larger allotment a minor drainage line may be found to contain sufficient soil depth to enable a dam to be constructed. Larger allotments also allow for greater flexibility in management and design, while an allotment of 1/4 - 1 acre will place absolute limits on options for development.
In assessing the overall capability for rural residential development the capability of each individual land use has been combined to arrive at a final rating class.
For the purpose of this study, rural residential development has been defined as block sizes between 0.4 - 2.0 ha. The ratings for blocks greater than 5.0 ha are not depicted on the maps and in the report, although the table above gives an indication of the capability of the map units if they are larger than 5.0 ha, where there may be more variety in map units and therefore slope and soil types.
3. LAND MANAGEMENT GUIDELINES
3.1 Management of land characteristics that influence land use
The criterions used in land capability rating tables have been selected because of the limitations they impose on the use of the land. This section explains why these features are important and how an improved level of management can reduce or even overcome the limitation. Information has been extracted from Rowe et. al. (1980) and Charman and Murphy (1991).
3.1.1 Soil texture
Soil texture is largely determined by the proportions of different-sized soil particles which make up the soil. Topsoils with well-graded textures have a relatively even distribution of particle sizes from clay through to sand, and tend to be better able to support agricultural and pastoral activities than either very sandy or very clayey soils. They are better able to withstand cultivation and compaction and are more resistant to soil erosion.
Soil texture is closely related to available water-holding capacity. The fine sandy loam - silty clay loam soils have more available water than sands or clays, and so can maintain plant growth for longer periods after wetting.
Texture is also an important determinant in soil infiltration and internal drainage, with sandier soils tending to have greater infiltration rates and better internal drainage. Well-structured or self-mulching clays may be very difficult to cultivate in either the wet or dry states. On the other hand, soils with coarse or sandy texture are very unstable and easily eroded, and may need the protection of a vegetative cover over the dry season.
3.1.2 Boulders and rock outcrop
Boulders and rock outcrop provide physical obstacles to excavation, cultivation and plant growth, and so inhibit land uses involving these activities. It may be possible to remove isolated rock outcrops by blasting, but for extensive uses, such as cropping and grazing, boulders and rock outcrop are a permanent limitation. Additional costs may be involved with the increased management required to maintain pasture growth or reduce storm water run-off from rocky areas.
3.1.3 Depth to hard rock
The presence of shallow hard rock (<0.5 m) causes problems for engineering and agricultural land use. Shallow hard rock may need excavation for engineering activities such as road works, building foundations and other shallow excavation work. Shallow hard rock may be removed with heavy machinery and blasting. Agricultural land use including cropping and farm dams are permanently restricted where shallow hard rock is present.
Very shallow soils are inherently more susceptible to erosion and require the protection of a permanent undisturbed cover of vegetation.
3.1.4 Depth of topsoil
Topsoil is not favoured as a construction material because of its low bearing capacity. The greater the depth of topsoil, the greater the cost of removing and stockpiling it. Many excavation permits now require the topsoil to be re-spread on construction sites to facilitate revegetation and this can be done successfully provided the compacted surface is broken up prior to the top soil being returned.
3.1.5 Depth to seasonal, perched or permanent watertable
The presence of a watertable close to the surface causes problems for both agricultural and engineering land uses. Saturated soils have a low bearing capacity. Therefore high watertables are unsuitable for stable foundations (e.g. building foundations and roads).
High watertables restrict the percolation of additional water from rainfall, irrigation or the effluent from septic tanks through the soil profile, whereas a fluctuating watertable is likely to cause leaching of the more mobile plant nutrients, or the concentration of iron compounds which immobilise nutrients such as phosphorus. High watertables in the plant root zone will reduce aeration and restrict root growth. Trafficability can be adversely affected, and in the case of effluent disposal, public health aspects may be of concern. High watertables may also restrict the depth of excavation for farm dams and quarries, even shallow excavations for sand and gravel deposits.
Watertables can be lowered by pumping or constructing artificial drains, however if the water is saline, disposal options are limited.
3.1.6 Dispersible clays
Dispersion is the spontaneous deflocculation of the clay fraction of soil in water. Slaking is the breakdown of an aggregate into smaller aggregates and primary particles. Dispersion and slaking are important characteristics of a soil because of their influence on the stability of the soil structure. Soils with a high degree of slaking or dispersion have a high erosion potential and any activity that exposes the topsoil or subsoil to rainfall or running water increases the risk of erosion.
Dispersion is an indicator of sodic soils. It occurs when clay particles form a cloud around an aggregate placed in water.
Dispersive soils have a high Exchangeable Sodium Percentage (ESP). This is the insoluble sodium attached to clay particles. Excessive sodium forces the clay particles apart (dispersion) when in water. The fine clay particles that have dispersed, clog up the the small pores in the soil, degrading soil structure, and restricting root growth and water movement. The amount of sodium defines the sodicity level of the soil. Excessive exchangeable sodium causes the clay particles to disperse when in contact with water.
Dispersible topsoils usually have poor physical characteristics, such as surface crusting, cloddiness, poor aeration and low emergence of plant seedlings. Maintenance of an effective pasture cover or litter layer reduces raindrop splash, dispersion and the associated surface sealing of topsoils.
Dispersible subsoils predispose a site to tunnel or gully erosion. The risk may be minimised by careful pasture management such as ensuring that the slopes and drainage depressions are well vegetated with plant species that have deep root systems and high water requirements. Road batters may be subject to slumping and erosion, with subsequent turbidity of run-off water and sedimentation in nearby water storages. As the dispersibility of the subsoil increases, so does the need to reduce batter slopes and establish a protective vegetative cover on the exposed soil.
3.1.7 Flooding
Flooding can be a problem on land with very low gradients and within confined drainage ways. Precise data is difficult to obtain on the frequency of flood events and the classes have been determined by observations of land form, catchment geometry and soil types which reflect recent sediment deposition. A distinction should be made between fast flowing flood waters (flash floods) and flooding caused by a rise in water levels with little flow (inundation). The type and severity of impact caused by these two forms of flooding differ and therefore different types of management may be required to reduce the hazard.
Floods are a threat to human safety, causing damage to property and livestock. Thus, flood-prone land should not be used for intensive development, but should be retained for land use such as grazing, where stock can be moved to higher ground in times of increased hazard. In some areas the problem may be overcome by building levee banks or retarding basins, however there may be severe environmental problems caused by this form of management. Some modification of flooding characteristics may be possible by special management aimed at delaying surface run-off. When dealing with large catchments, the problem is a long-term hazard and a permanent limitation.
3.1.8 Organic matter
Where soil materials are to be used as road fill or for earthen dams, the presence of organic matter reduces soil quality for these purposes. Soils containing even moderate amounts of organic matter are more compressible and less stable than inorganic soils. The presence of organic material in sand for concrete is also undesirable.
When used as a medium for plant growth, a high level of organic matter is most desirable as it improves soil structure and chemical fertility. Soils high in organic matter are good for intensive cropping, however cultivation promotes rapid oxidation of organic matter and the condition of the topsoil will deteriorate if the organic matter is not replaced. Organic matter levels can be increased by sowing improved pastures, ploughing in green manure crops, and stubble retention.
3.1.9 Permeability
Soils of low permeability have poor drainage through the profile. On sloping land, lateral flow may occur above an impervious layer thereby draining the water away from the site, but on relatively flat areas such soils can become waterlogged and inhibit plant growth or become too boggy for the use of agricultural machinery. Low permeability in soils also reduces the efficiency of effluent disposal systems. This limitation can be overcome if sufficient area is available to increase the length of an absorption trench or utilise plants to transpire water from the effluent disposal area. For earthen dams, low permeability in the floor, the sides and the walls of the dam is most desirable. An extremely permeable soil may have excessive leaching of plant nutrients or an inability to retain moisture for plant growth. Such a soil may drain too rapidly to purify the effluent from septic tanks, thereby increasing the risk of polluting groundwaters or nearby streams.
3.1.10 Plasticity index
The plasticity index is a measure of the range of moisture content over which the soil is in the plastic state. A soil is most easily worked or is most readily deformed when in the plastic state. A low index indicates that the range is narrow, which is desirable where the stability of the material is important, such as in a road subgrade. However where the soil is to be cultivated, a higher plasticity index is desirable to enable working over a wider range of moisture contents.
3.1.11 Linear shrinkage (shrink-swell potential)
This relates to the capacity of clayey soil material to change in volume with changes in moisture content, and is dependant on the quantity and nature of the clay minerals present. The shrink-swell characteristics of a soil influence the capability of land for uses such as roads or buildings which require a stable substrate. Buildings and roads shift or crack in soils which undergo large changes in volume during periodic wetting and drying. Construction on soils with a high shrink-swell potential requires special techniques such as laying deeper-than-usual foundations for roads or using a reinforced concrete slab rather than stumps or strip footings for buildings.
3.1.12 Site drainage
Site drainage is influenced by soil type, soil permeability, steepness of slope, slope shape, rainfall and position in the landscape. For most land uses it is important that water flows freely from the site, since poor site drainage can result in the land becoming waterlogged and boggy, inhibiting plant growth, damaging roads and buildings through subsidence, and reducing the capacity of the area to dispose of effluent. Special works or higher levels of management may be necessary to overcome poor site drainage and this will add to the cost of development and production.
3.1.13 Slope
As the angle and length of slope increases so too does the erosion hazard. The loss of adequate ground cover during the construction of dams, roads and buildings, or on land that is cultivated or overgrazed, increases the risk of erosion. Steeper slopes are more difficult and costly to use for agricultural, forestry or road-making activities, and impose limitations on the type of machinery which can be used. Certain soil types become unstable in wet conditions. As the slope increases, the risk of mass movement also increases, particularly if large quantities of water are contained in the soil profile. Instability can occur on natural slopes, under trees or pasture, road batters and earthen dam banks. Effluent from septic tanks contains high levels of nutrients and bacterial organisms. If the absorption beds are situated on sloping land, then during wet periods when the soil profile may be saturated (from excessive rainfall and/or run-off from upslope), there is an increased risk of effluent being washed into the streams and water storages further down the catchment. This may result in adverse consequences for water quality and aquatic ecosystems.
3.1.14 Soil reaction
The pH of the soil is a measure of its acidity or alkalinity. Most plants have a pH range in which optimum growth can be expected. Soil acidification occurs as nitrates that were fixed by pasture legumes are leached from the soil, and by the addition of acids in superphosphate. With the long-term use of superphosphate and nitrogen fixing legumes, and the constant removal of grain, hay and/or animal products from the land, the topsoils in many areas have become more acid (pH < 5.5 in H20) and the potential for aluminium toxicity has increased. Acid soils and aluminium toxicity can result in a decline in plant vigour and growth.
3.1.15 Stones and gravel
The stone and gravel content in a soil can restrict land use and plant growth in the following ways:
I) reducing the available water content and nutrient supply in the profile;
ii) increasing the wear and tear on cultivating and excavating machinery;
iii) increasing the cost of harvesting root and tuber crops (e.g. potatoes).
Little can be done to overcome this limitation, other than the continual removal of stones from an area as they appear on the landsurface.
4. DETAILED MAP UNIT DESCRIPTIONS AND CAPABILITY RATINGS
Fifty-two map units have been identified in Cardinia Shire. Each of the following map units is described in a detailed two page format which provides relevant information to support land use planning and management. The information includes a general description of the map unit, detailed soil profile analysis, chemical and hydraulic properties of the soil, susceptibility and incidence of land degradation, and an assessment of the capability of the land to support various land uses.
The classes for the land capability ratings range from 1 to 5, with “1” being very good and “5” being very poor. (Refer to Tables 2.1 and 2.2 for more detailed explanations).
The potential agricultural productivity of land is generally classified by the CTS criteria (Climate, Topography and Soil). For example, the ‘ideal’ prime agricultural areas would be denoted by C1T1S1 compared with another areas that had, for example, a five to seven month length of growing season, slopes of 3 per cent and a depth to rock/hardpan of only 0.7 m, denoted by C3T2S4. (refer to Table 2.3). The overall Land Capability class of this land would be “4”; with soil factors (depth to hardrock) being the major limiting features.
Maps depicting the map units and the land capability assessments for the nominated land uses have been produced, these maps can be viewed at Cardinia Shire, Centre for Land Protection Research, or the Department of Natural Resources and Environment Office.
Note:
- Because soil observation depth did not exceed 1.5 metres, the depth to hard rock and depth to seasonal watertable have been generalised where they exceed 1.5 metres.
- pH recorded in the soil profile descriptions are laboratory pH (water) results. The pH recorded in the interpretation of laboratory analysis are CaCl2.
- Minor drainage lines have not been mapped as separate map units. Soils of minor drainage lines often have similar soils of greater depth and reduced drainage capacity to those of the surrounding map unit. Minor drainage lines are often indicated as a minor watercourse on the land capability maps.
5. ACKNOWLEDGMENTS
For their valuable help and advice the authors would like to thank Grant Boyle, Martin Bluml, Evan Jones and Les Russell.
Ian Sargeant is acknowledged for his assistance in identifying the soils of the Koo-we-rup area.
Gathering of soils information would not be possible without the support of the landholders in the district, who provided access to their properties. The authors would like to thank those landholders and their families for allowing detailed soil and landform information to be collected on their properties.
The land capability study for the Cardinia Shire Council was jointly funded by the Cardinia Shire Council, the Department of Natural Resources and Environment and the National Landcare Program.
6. REFERENCES
Australian Standard 1289 (1977). Methods of Testing Soils for Engineering Purposes. Standards Association of Australia. Standards House, Sydney.
Charman, P.E.V. and Murphy, A.W., Eds. (1991). Soils: their properties and management. Sydney University Press; Soil Conservation Service, NSW.
Craze, B. and Hamilton, G.J. (1991). Soil physical properties. Ch. 10. Charman, P.E.V. and Murphy, B.W. (eds) In: Soils: their properties and management. University Press, Sydney.
Department of Natural Resources and Environment, Industry and Resource Information Section (1996). Major agricultural aoils of the Crandourne and Koo-wee-rup vegtable growing region
Elliot, G.L. and Leys, J.F. (1991). Soil erodibility. Ch. 12. In Soils: their properties and management. Eds. P.E.V. Charman and B.W. Murphy. Sydney University Press; Soil Conservation Service, NSW.
Emerson, W.W. (1977). Physical properties and structure. In Soil factors in crop production in the semi-arid environment. Eds. Russell, J.S. and Greacen, J.S. University of Queensland Press.
Emerson, W.W. 1967. A classification of soil aggregates based on their coherence in water. Aust. J. Soil Res. 5, 47 - 57.
Environment Protection Authority, Department of Water Resources and Health Department. (1990). Septic tanks code of practice.
Goudie, A.G. (1942). A survey of soils and land utilization in the parishes of Koo-wee-rup and Koo-wee rup East. Proc. Roy. Soc. Victoria, 54 (NS) Pt 1 93-130.
Goss, H.M. ,Reimers T., van de Graff, R. H. M. (1987) Land capability study of the Westernport Catchment. Department of Conservation Forests and Lands.
Hicks, R.W. (1991). Soil engineering properties. Ch. 11. In Soils: their properties and management. Eds. P.E.V Charman and B.W. Murphy. Sydney University Press; Soil Conservation Service, NSW.
Hutton, T.J. (1955). A method of particle size analysis of soils. Divisional Report No. 11/55, CSIRO, Division of Soils.
Isbell, R.F. (1994). Final Draft. A Classification System for Australian Soil Classification. January 1995, CSIRO Division of Soils (unpublished).
Lorimer, M.S. (1985). Estimating the susceptibility of soil to wind erosion in Victoria. J. Aust. Inst. Ag. Sci. 51: 122-126.
Loveday, J. and Pyle, J. (1973). The Emerson Dispersion Test and its relationship to hydraulic conductivity. Tech. Pap. 15, CSIRO Divn. Soils. CSIRO, Melbourne.
Maheswaran, J. and Crawford, D.M. (1992). Soil acidity and acidification in Victoria: a state-wide perspective. In: Acid Soils: Research and Extension Seminar Paper. State Chemistry Laboratory.
McDonald, R.C., Isbell, R.F., Speight, J.G., Walker, J. and Hopkins, M.S. (1984). Australian soil and land survey - field handbook. Inkata Press.
Northcote, K.N. (1979). A factual key for the recognition of Australian soils. Rellim Technical Publications Pty. Ltd., South Australia.
Rosengren, N.J. (1984) Sites of Geological Significance in the Westernport Bay Catchment. Department of Conservation Forests and Land.
Rowan, J. (1990). Land systems of Victoria. Land Protection Division, Department of Conservation and Environment.
Rowe, R.K., Howe, D.F., and Alley, N.F. (1980). Manual of Guidelines for Land Capability Assessment in Victoria. moisture characteristics of soil. J. Soil Sci. 20: 126-31.
Sargeant, I.J. (1975) A soil survey of the Westernport Bay Catchment. Prepared for the Westernport Bay Environment Study, Project report No. 22.
Sargeant, I.J.(1993) Soil quality assessment Horticultural Zone Amendment L71. Prepared for the Shire of Pakenham.
Sargent,I.J., (1994) Soil quality report Shire of Cranbourne. Prepared for the Shire of Cranbourne.
Salter, P.J. and Williams J.B.(1969). The influence of texture on the moisture characteristics of soil. V. Relationships between particle size composition and moisture contents at the upper and lower limits of available water. J. Soil Sci. 20: 126-31.

© State of Victoria (Agriculture Victoria) 1996 - .

This work, Victorian Resources Online, is licensed under a Creative Commons Attribution 4.0 licence. You are free to re-use the work under that licence, on the condition that you credit the State of Victoria (Agriculture Victoria) as author, indicate if changes were made and comply with the other licence terms.
The licence does not apply to ‘branding’ or some ‘images or photographs’ that may be owned by third parties. We ask you to seek prior approval to use images using the VRO feedback form. Access to higher quality images can also be provided on request.
This page was last updated on .