
ORZC2
| Location: Birchip. | Australian Soil Classification: Vertic (& Epihypersodic), Pedal, Calcic, CALCAROSOL (clayey) |
| Geology: Woorinen Formation. | |
| General Landscape Description: Located on westerly facing gentle slope of gently undulating plain. This site represents the depression component of the gilgai microrelief (near site ORZC1). | |
| Site Description: Pasture containing barrel medic. | |
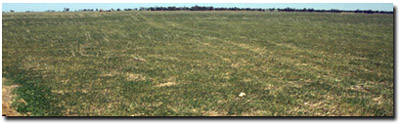 Site ORZC2 Landscape | 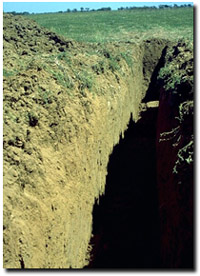 Sites ORZC1 & ORZC2 |
| Soil Profile Morphology: Surface Soil |
| A1 | 0-10 cm | Brown (7.5YR4/4); light clay; moderate to strong, medium to fine polyhedral structure; earthy fabric; very weak consistence (dry); strong effervescence; contains minor amounts of iron sandstone floaters (20 cm in size); also contains worm casts; pH 8.4: | 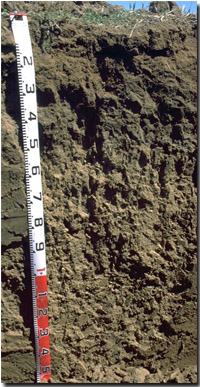 Site ORZC2 Profile |
| Subsoil | |||
| B21 | 10-20 cm | Brown (7.5YR4/4); light medium clay; weak blocky structure; earthy fabric; firm consistence (dry); pH 8.9: | |
| B22 | 20-45 cm | Brown (10YR4/3); light medium clay; weak coarse blocky structure; very firm consistence (dry); contains bands of quartz sand; pH 9.0; clear change to: | |
| B23k | 45-60 cm | Yellowish brown (10YR5/4) with light brown (7.5YR6/4) and dark greyish brown (10YR4/2) mottles as well as infill of a darker soil; medium clay; strong coarse prismatic structure; strong consistence (dry); contains few (5%) fine earth carbonates as well as pockets of sand; pH 9.3: | |
| B24 | 60-120 cm | Light yellowish brown (10YR6/4); medium clay; lenticular structure with slickensides; very firm consistence (moist); contains sand grains throughout; pH 9.4: | |
| B25 | 120+ cm | Light brown (7.5YR6/4) with light brownish grey (10YR6/2) and reddish yellow (5YR6/6) mottles; medium heavy clay; firm consistence (moist); pH 9.3. | |
Key Profile Features:
- Gradual increase in clay content with depth.
- Vertic properties (i.e. slickensides and lenticular peds) in deeper subsoil.
- Soil profile calcareous throughout.
Soil Profile Characteristics:
pH | Salinity Rating | |||
Surface (A1 horizon) | Moderately Alkaline | Low | Non-Sodic | None |
Subsoil (B21 horizon) | Strongly Alkaline | Low | Sodic | None |
Deeper subsoil (at 1 m) | Very Strongly Alkaline | High-Very High | Strongly Sodic | Moderate1 |
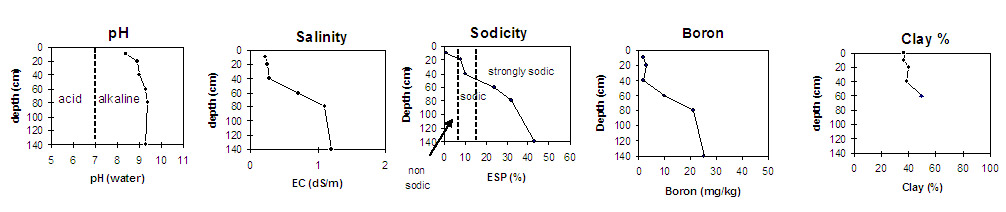 |
Horizon | Horizon Depth (cm) | pH (water) | pH (CaCl2) | EC 1:5 | NaCI % | Exchangeable Cations | Boron mg/kg | Field Capacity pF 2.5 | Wilting Point pF 4.2 | Coarse Sand (0.2 - 2 mm) | Fine Sand (0.02 -0.2 mm) | Silt (0.002 -0.02 mm) | Clay (<0.002 mm) | |||
Ca | Mg | K | Na | |||||||||||||
meq/100g | ||||||||||||||||
A1 | 0-10 | 8.4 | 8.0 | 0.23 | 30 | 6.9 | 3.1 | 0.32 | 2.0 | 39 | 18 | 17 | 217 | 13 | 37 | |
B21 | 10-20 | 8.9 | 8.2 | 0.25 | 0.01 | 17 | 7.8 | 1.2 | 2.1 | 2.8 | 36 | 17 | 18 | 23 | 9 | 40 |
B22 | 20-40 | 9.0 | 8.3 | 0.28 | 0.01 | 17 | 8.4 | 1.0 | 2.8 | 2.0 | 35 | 17 | 19 | 23 | 8 | 39 |
B23k | 45-60 | 9.3 | 8.5 | 0.7 | 0.09 | 11 | 13 | 1.1 | 7.7 | 10 | 46 | 23 | 12 | 17 | 9 | 50 |
B24 | 60-80 | 9.4 | 8.7 | 1.1 | 0.15 | 8.5 | 14 | 1.4 | 11 | 21 | 47 | 22 | 12 | 18 | 12 | 52 |
B25 | 120+ | 9.3 | 8.6 | 1.2 | 0.23 | 7.3 | 10 | 1.3 | 14 | 25 | 45 | 22 | 13.0 | 20 | 9 | 54 |
Management Considerations:
General
- Management strategies for all soils should include: increasing organic matter levels in the surface soil, minimising the degradation of soil aggregates and porosity, promoting the development of stable biopores, improving the calcium status of the cation exchange complex (particularly when sodium is a significant part), and breaking up any hardpans. Less frequent tillage, using less aggressive implements and working the soil at optimum moisture content can all assist in maintaining soil aggregation and porosity as well as reducing the breakdown of organic matter.
Whole Profile
- Most of the soil profile is strongly to extremely alkaline throughout. This indicates that phosphorus and trace elements such as iron, manganese, copper and zinc may be poorly available to plants.
- The original gilgai microrelief is caused due to the vertic properties of the soil and the resultant shrinking and swelling in response to drying and wetting cycles. This forces ‘blocks’ of soil material gradually upward to form mounds (or ‘puffs’). The soil in the mounds will be different to soils in the depressions. Mound soils tend to be lighter in colour and have higher calcium carbonate contents. Salinity is also often higher in the upper profile in the mounds as well as boron levels. Continuous cultivation results in the smoothing out of many of these gilgai formations. The forces that created them, however, are still operating as is evident by displacement of fence posts; and if the land is left undisturbed over a number of wetting and drying seasons they will continue to develop.
- The surface soil has a high cation exchange capacity with relatively high levels of exchangeable calcium and potassium.
- Tillage of clayey soils like these should be avoided if the soil is wet (i.e. wetter than the plastic limit). At such moisture conditions, excessive tillage, trafficking or over-stocking could result in some structural damage (e.g. compaction). Ideally, tillage should take place on clayey soils when the soil is drier than the plastic limit – down to at least the tillage depth.
- The surface soil has a weak consistence when dry and is reasonably friable. This is well suited as a seed-bed.
- The upper subsoil is sodic but does not disperse. The deeper subsoil becomes strongly sodic and disperses, which is likely to result in restricted root and water movement in the deeper subsoil. The high level of exchangeable sodium in the deeper subsoil can also result in nutrient imbalances and may even have a toxic effect on some plants.
- Boron levels are lower for this depression component of the gilgai microrelief (compared to the nearby gilgai mounds) in the upper part of the subsoil. Boron levels increase below 40 cm depth to levels that are likely to affect the growth of boron-sensitive species (including cereals, pulses, pasture legumes). Concentrations as low as 10 ppm, for example, can reduce lentil yield. Limited data estimates that the threshold level of soluble boron for cereals is 15 mg/kg (Cartwright et al., 1984). Other work at VIDA indicates that where there are low levels of soluble salts, boron tolerance can be comparatively high, with little reduction in wheat yield at levels of up to 45 ppm (Quinlan, 2001).
- The level of soluble salts is low in the upper subsoil. Levels increase to high in the deeper subsoil (i.e. from 40 cm depth) to levels which will restrict the growth of salt-sensitive species. Excessive soil salinity can affect the plant's ability to take up water and can also have a toxic effect on plants.
- The deeper subsoil displays vertic properties (i.e. slickensides and lenticular peds). This indicates that significant shrinking and swelling occurs during wetting and drying cycles. This may disturb the roots of some plant species and has engineering implications (e.g. disturbance to fencelines).
- Surface cracking not evident.
References:
Cartwright, B, Zarcinas, BA, and Mayfield, AH (1984), Toxic concentrations of boron in a red-brown earth at Gladstone, South Australia, Australian Journal of Soil Research 22, 261-72.
Hobson, K (2001), Boron Tolerant Lentils, In On The Pulse pamphlet, NRE.
Quinlan, J (2001), Sorting out the Boron Problem, Wimmera Farming & Landcare Newsletter, 19-20.
Rengasamy, P and Churchman, GJ (1999), Cation Exchange Capacity, Exchangeable Cations and Sodicity, In: Soil Analysis – An Interpretation Manual, (eds. Peverill, KI et al.), CSIRO Publishing.
© State of Victoria (Agriculture Victoria) 1996 - .

This work, Victorian Resources Online, is licensed under a Creative Commons Attribution 4.0 licence. You are free to re-use the work under that licence, on the condition that you credit the State of Victoria (Agriculture Victoria) as author, indicate if changes were made and comply with the other licence terms.
The licence does not apply to ‘branding’ or some ‘images or photographs’ that may be owned by third parties. We ask you to seek prior approval to use images using the VRO feedback form. Access to higher quality images can also be provided on request.
This page was last updated on .