SW50
Location: Garvoc
Australian Soil Classification: Epiacidic, Epipedal, Black VERTOSOL
General Landscape Description: Level plain between basalt barriers.
Site Description: Grazing paddock (dairy).
Mapping Unit: Unit 32 (Maher and Martin, 1987).
Geology: Quaternary - Newer volcanics (basalt).
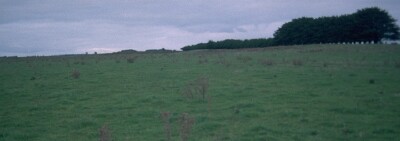 SW50 Landscape |
Soil Profile Morphology:
Surface Soil
| O | 0-10 cm | Organic mat: | |
| A1 | 10-30 cm | Very dark grey (10YR3/1); rusty root channel mottling; medium clay; strong very coarse blocky, parting to strong coarse blocky structure; strong consistence moist; pH 6.1: | |
| Subsoil | |||
| B21 | 30-60 cm | Very dark grey (10YR3/1); medium clay; moderate to strong medium blocky, parting to moderate to strong fine blocky structure; weak consistence moist; pH 5.5: | |
| B22 | 60-130 cm | Very dark grey (10YR3/1); medium clay; strong coarse lenticular, parting to fine lenticular structure; firm consistence moist; pH 6.8 (becoming pH 7.8 from 100 cm depth). | |
Soil Profile Characteristics:
- | pH | Salinity | ||
Surface Soil (A1 horizon) | Slightly Acid | Low-Moderate | Non-Sodic | Slight |
Subsoil (30-60 cm) | Strongly Acid | High | Non-Sodic | None |
Deeper Subsoil (100-130 cm) | Slightly Alkaline | High-Very High | Non-Sodic | None |
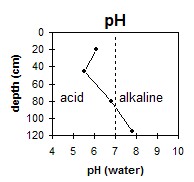 The surface is slightly acid. The subsoil is strongly acid becoming slightly alkaline at 1 m. | 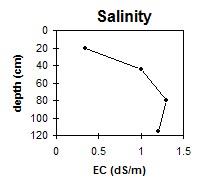 The surface salinity rating is low to moderate. The subsoil is high becoming high to very high at 80 cm depth. | 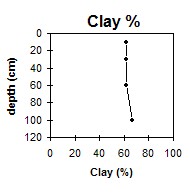 The clay content is high throughout the profile. |
Chemical and Physical Analysis:
Horizon | Horizon Depth (cm) | pH (water) | pH (CaCl2) | EC dS/m | NaCl % | Organic Carbon % | Total Nitrogen % | Exchangeable Cations | Coarse Sand (0.2-2.0 mm) % | Fine Sand (0.02-0.2 mm) % | Silt (0.002-0.02 mm) % | Clay (<0.002 mm) % | Field Capacity % w/w | Wilting Point % w/w | |||
Ca | Mg | K | Na | ||||||||||||||
meq/100g | |||||||||||||||||
A0 | 0-10 | ||||||||||||||||
A1 | 10-30 | 6.1 | 5.4 | 0.34 | 0.03 | 4.4 | 0.35 | 20 | 16 | 0.2 | 2.1 | 1 | 11 | 14 | 62 | 66 | 40.9 |
B21 | 30-60 | 5.5 | 5.1 | 1 | 0.21 | 2.5 | 0.19 | 20 | 17 | 0.2 | 2.3 | 1 | 11 | 13 | 62 | 64.8 | 38.7 |
B22 | 60-100 | 6.8 | 6.4 | 1.3 | 0.23 | 1.8 | 0.12 | 22 | 18 | 0.2 | 2.4 | 1 | 11 | 14 | 62 | 66.9 | 38.7 |
B23 | 100-130 | 7.8 | 7.4 | 1.2 | 0.23 | 68 | 30 | 0.4 | 3.7 | 1 | 11 | 12 | 67 | 71 | 41.4 | ||
Profile Described By: Mark Imhof and Austin Brown, August 1998.
© State of Victoria (Agriculture Victoria) 1996 - .

This work, Victorian Resources Online, is licensed under a Creative Commons Attribution 4.0 licence. You are free to re-use the work under that licence, on the condition that you credit the State of Victoria (Agriculture Victoria) as author, indicate if changes were made and comply with the other licence terms.
The licence does not apply to ‘branding’ or some ‘images or photographs’ that may be owned by third parties. We ask you to seek prior approval to use images using the VRO feedback form. Access to higher quality images can also be provided on request.
This page was last updated on .