
Soils and landforms of the Omeo/Benambra and Tambo Valley region
1. Introduction | 2. How to use this guide | 3. Climate | 4. Geology and geomorphology | 5. Rocks and sediments in East Gippsland | 6. History of land use | 7. Soil issues of the Omeo/Benambra and Tambo Valley region | Soil-landform units | Interpretation of soil analytical data | Acknowledgements | References
This manual collates all of the previous work conducted within the study area, including field work conducted by David Rees and Ian Sargeant and information published by Aldrick et al, 1992 titled “A Study of the Land in the Catchment of the Gippsland Lakes”. Soils are classified according to the Australian Soil Classification (Isbell 1996). Terminology is consistent with that used in the Australian Soil and Land Survey Handbook (McDonald et al 1990).
The manual presents information about the geology and geomorphology of the study area and includes soil descriptions, management issues and chemical and physical analyses from some but not all of the landform map units. Interpretation of this information, together with case studies, will be produced in the Victorian Government’s Landcare Notes series at a later date.
The information from this manual will be made available on the Victorian Resources Online website.
Top
2 How to use this guide
Within a given locality, soils which share common characteristics can be grouped together and distinctions can be made between other “groups” of soils. For example, the soils and topography of the flats near Lake Omeo are quite different from soils and topography of the granite hills around Swifts Creek.
This guide is based on “soil-landform map units” that are map units that have similar geology, topography and the range of soil types. Each map unit may have two or three separate “types” of soil, called “components” that would be difficult to separate without making the map too complicated. Consequently within a given “soil landform map unit” there may be one component typical of the hill crest, another on the slope and another on the more gently sloping land.
We could choose to give local names to each soil landform map unit, but that would mean we would end up with many names for several soil landform map units that are basically the same though they occur in different locations throughout Gippsland. For this reason we have decided to give the same soil landform map unit name to all areas with a similar set of soils formed on a similar type of parent material, similar topography and similar climate. These soils will also usually have similar natural vegetation. For example the soil landform map unit “Talbotville” was named after an area around Talbotville (about 25 km north-west of Dargo) which had mostly shallow soils on steep topography developed on Palaeozoic (Ordovician, Silurian and Devonian) sedimentary rock. Similar soils and landforms occur elsewhere in Gippsland so the same name has been given to all other similar soil landform map units.
Table 1. Soil landform map units based on the underlying rock/sediment, elevation, rainfall and landform pattern
| Name | Symbol | Rock/sediment | Elevation (m) | Terrain Slope (Modal) | Relief (m) | Rainfall | Landform Pattern |
| A | A | Pleistocene alluvium | 600-800 | 3-10% | 9-30 | 600-800 | Low rises |
| Beloka | Bk | Quaternary colluvium | 750-900 | 3-10% | 9-30 | 700-800 | Undulating rises |
| Benambra | Ba | Recent alluvium and colluvium | 650-750 | <3% | <9 | 600-700 | Gently undulating plain |
| Bindi | Bi | Limestone | 500-650 | 10-32% (<15%) | 30-90 | 500-700 | Rolling low hills |
| Bloomfield | Bf | Granite and gniesses | 250-1200 | 32-56 +% | 90-300 | 500-800 | Steep hills |
| Carrabungla | Ca | Devonian rhyodacites | 500-1000 | 32-56+% | 90-300 | 500-800 | Steep hills |
| Cobungra | Cn | Granite and gniesses | 900-1000 | 10-32 % | 30-90 | 700-900 | Rolling low hills |
| Dargo | Do | Granite and gniesses | 250-500 | 10-32 % (<15%) | 30-90 | 500-700 | Rolling low hills |
| Fraser | Fr | Basalt | 620-720 | <3% | 9-30 | 700-900 | Gently undulating rises |
| Hinnomunjie | He | Palaeozoic sediments | 600-900 | 10-32 % (<15%) | 30-90 | 600-800 | Rolling low hills |
| Livingston | Lv | Quaternary colluvium | 700-800 | 3-10% | 9-30 | 600-800 | Undulating rises |
| McAdam | Mc | Limestone | 550-850 | 32-56 +% | 90-300 | 500-700 | Steep hills |
| McFarlane | Mf | Igneous complex | 800-1200 | 32-56 +% | 90-300 | 600-800 | Steep hills |
| Morass | Ms | Quaternary alluvium | 700-900 | <3% | <9 | 600-800 | Gently undulating plain |
| Omeo | Om | Granite | 600- 800 | 10-32 % (<15%) | 30-90 | 600-800 | Rolling low hills |
| Pendergast | Pt | Quaternary colluvium | 700-800 | 3-10% | 9-30 | 600-800 | Undulating to rolling low hills |
| Talbotville | Te | Palaeozoic sediments | 250- 1200 | 32 - 56% | 90-300 | 500-800 | Steep hills |
| Walnut | Wt | Quaternary alluvium | 300-500 | <1% | <9 | 500-700 | Level plain |
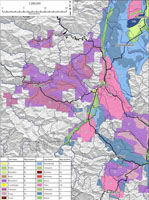 Soils - landform map units of the Omeo region | 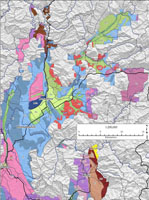 Soil - landform map units of the Benambra region | 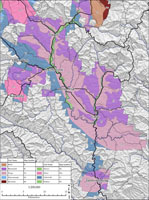 Soil - landform map units of the Tambo Valley region |
Top
3 Climate
3.1 Temperature
Average daily mean temperatures are highest during the summer and lowest in winter (Table 2). In Omeo the mean daily average temperatures from May to September are below 100C, which retards plant growth. In July they are below 5.6 0C which prevents plant growth (Rowe, 1967). The Bureau of Meteorology does not collect temperature data for Swifts Creek.
Table 2: Mean maximum and monthly temperatures and related plant growth for Omeo
| Jan | Feb | Mar | Apr | May | Jun | July | Aug | Sept | Oct | Nov | Dec | |
| Omeo | ||||||||||||
| Mean maximum temp. | 25.3 | 25.4 | 22.3 | 18.1 | 14.2 | 10.8 | 10.2 | 11.7 | 14.5 | 17.5 | 20.3 | 23.4 |
| Mean minimum temp. | 10 | 9.8 | 7.9 | 4.9 | 2.7 | 0.6 | -0.3 | 0.7 | 2.8 | 4.5 | 6.5 | 8.1 |
| Average monthly temp | 17.7 | 17.6 | 15.1 | 11.5 | 8.5 | 5.7 | 5 | 6.2 | 8.7 | 11 | 13.4 | 15.8 |
| Plant growth retarded | NO | NO | NO | NO | YES | YES | YES | YES | YES | NO | NO | NO |
| Plant growth prevented | NO | NO | NO | NO | NO | NO | YES | NO | NO | NO | NO | NO |
Plant growth interpretations Rowe (1967)
3.2 Rainfall
Moist west to north-westerly airstreams, lifted by the north-western face of the highlands, deposit most of their moisture on the lower slopes to windward and on the high elevations (LCC 1982). Rain shadows therefore occur on the leeside of the high Hotham-Bogong High Plains which reduces the area’s annual rainfall to about 620 – 670 mm (24 - 26 inches). Although the Cassilis Valley has no official weather station it receives more rainfall than Swifts Creek; with the long term average at Cassilis believed to be about 800 mm (Rees 1995).
Table 3: Mean annual rainfall for Omeo, Tongio and Swifts Creek.
| Jan | Feb | Mar | April | May | June | July | Aug | Sept | Oct | Nov | Dec | Total | |
| Omeo 1879-2008 | 51.9 | 51.8 | 52.7 | 45.2 | 50.4 | 56.3 | 52.2 | 55.9 | 61.3 | 70.5 | 64.8 | 60.3 | 673.6 |
| Omeo 1997-2008 | 44.9 | 51.0 | 36.9 | 32.9 | 29.5 | 64.8 | 48.3 | 50.2 | 56.2 | 46.7 | 74.3 | 42.3 | 577.9 |
| Tongio 1923-2007 | 51.0 | 48.7 | 50.1 | 45.3 | 45.9 | 54.1 | 48.2 | 50.7 | 53.8 | 66.4 | 68.2 | 62.7 | 653.8 |
| Swifts Ck 1938-2008 | 54.4 | 48.4 | 50.2 | 43.9 | 41.8 | 48.7 | 38.0 | 41.5 | 46.9 | 65.4 | 67.7 | 61.8 | 621.6 |
| Swifts Ck 1997-2008 | 44.0 | 42.4 | 33.5 | 35.6 | 26.5 | 61.1 | 33.5 | 36.3 | 44.5 | 32.3 | 68.7 | 46.2 | 504.5 |
Mean precipitation at Omeo and Swifts Creek is relatively uniformly distributed (Table 3), but there is a slight depression in the winter rainfall, and spring is slightly wetter than the other seasons. Summer rainfall at Omeo is mostly the result of thunderstorms that are not affected by the landmass to the north-west (Rowe 1967). Summer thunderstorms are caused by convection and occur erratically, but falls are often heavy and occasionally contribute to rainfall in rain shadow areas (LCC 1982). Rowe points out rainfall intensities, when considered with changes in ground cover, should provide an indication of the potentially critical periods for erosion and the severity of this hazard.
Also included in Table 3 is the 12 year record (1996 – 2008) for Omeo and Swifts Creek. Over the last twelve years, the average rainfall is well down on the long term average by about 100 mm. The most reliable rainfall over this period has occurred in June, September and November.
Table 3 does not give any indication of the variability of the rainfall. From year to year the monthly rainfall is highly variable, which makes it difficult to predict beginning and end of the growing season.
Top
4 Geology and geomorphology
The account given below of the geological history of East Gippsland is very much simplified. Much of the region is in rugged and remote mountain country. Its geology is quite complicated and influenced by numerous faults. Only recently have geologists begun to unravel its geological history.
Palaeozoic Era
The oldest sedimentary rock in these areas are those deposited under deep marine conditions during the Ordovician Period (510 to 435 million years ago (m.y.a) when all except the far west of Victoria was under a deep sea. These sediments originated from erosion in mountains which were at that time in the far western part of the state and South Australia.
Orogeny is the term given to periods of mountain building. Such events occur as a result of plate tectonics and affect certain regions of the Earth’s crust and happen within a certain time frame. At the moment there is a major period of orogeny in progress in which the Indian Plate is colliding with the Asian Plate with the formation of the Himalayas, within which the rocks and sediments are still undergoing deformation. A major period of orogeny called the Benambran Orogeny occurred during the Late Ordovician – Early Silurian Periods (440 – 420 m.y.a.). The heat and pressure associated with deformation of these older sediments caused them to be altered (metamorphosed) to harder rocks such as gniesses, schists and quartzites. Gniess, like granite, is a fairly coarse grained rock similar in composition to granite.
The Benambran Orogeny caused major changes in geography. Most of western, central and far eastern Victoria became dry land. As a result, the large deep water basin that existed earlier over central and eastern Victoria was reduced to two smaller marine troughs, the Melbourne Trough and the Cowambat Rift. The latter was a deep rift valley extending from south of Bairnsdale to well past Corryong. During the Silurian Period it became filled with both marine sediments and volcanic material.
The Late Silurian and Early Devonian Periods (about 400 – 420 m.y.a.) were marked by another period of mountain building, the Bowning/Bindian Orogeny. In Gippsland this resulted in the sediments of the Cowambat Rift being uplifted. Most of the granite intrusions into the region east of Dargo were formed during this period. This granite formed as a result of molten magma melting the overlying sediments and then solidifying. The sediments around these granite intrusions are often hardened into schists due to contact metamorphism. Soon after, still in the Early Devonian, a new north-south depression, called the Buchan Basin, developed across eastern Victoria, partially overlapping the older Cowombat Rift. The basin contains two major rock units, the Snowy River Volcanics and the overlying Buchan Group, a shallow water limestone, such as around Bindi, and mudstone unit.
The Bowin/Bindian Orogeny, however, did not affect the Melbourne Trough in central Victoria. Sediments in that basin accumulated almost without interruption from the beginning of the Ordovician Period through until the end of the Devonian Period, a period of over 100 million years.
Another dramatic period of major mountain building and deformation which affected most of Victoria, the Tabberabberan Orogeny, occurred during the Early to Mid Devonian Period (about 390 – 370 m.y.a.). This produced a major mountain range, called the Tabberabban Highlands, in Eastern Victoria. Uplift associated with this event caused the sea to retreat to the east, so that by about the end of the Devonian Period all of Victoria except the far east was dry land. Volcanic activity and granite intrusions occurred in the Melbourne Trough towards the end of the Devonian period.
A large sedimentary basin, 40 -50 kilometres wide and extending from Valencia Creek to Mansfield developed west of the Tabberabban Highlands. This basin was first partly filled by rhyolites and rhyodacites (volcanic rocks) during the Late Devonian Period (about 370 m.y.a.), and later, during the Early Carboniferous, about 350 m.y.a.), by a thick body of fresh water sediments. These sediments are mainly conglomerate, pebbly sandstone and siltstone. They do not occur within the present study area.
Towards the end of the early Carboniferous Period, about 350 m.y.a., there was a widespread but not very intense deformation known as the Kanimblan Orogeny which uplifted central and eastern Victoria. This caused some folding. This was the last major tectonic event in Victoria until the Lower Cretaceous Period, about 120 million years ago. However during the Late Carboniferous and Permian Periods, about 290 m.y.a., Victoria was positioned closer to the South Pole and largely covered by glaciers. Erosion over this period as glaciers moved northwards changed the Victorian landscape greatly, although no glacial sediments occur within our study area.
Over long periods of time, glaciers and other forms of erosion have worn down the land surface with the result that much of the formerly deep granites and metamorphosed sediments are now exposed at the surface.
Mesozoic Era
The earliest rocks from this era are those belonging to the Triassic Mount Leinster Igneous Province (about 230 – 200 m.y.a.) which lies mostly within the Benambra 1:100 000 map area but several of the granites extend into the Omeo 1:100 000 map area and there are also trachyte lavas, plugs and dykes. Examples of the granite–like intrusions are Little Mount Tambo, Prendergast Lookout and The Brothers.
In the Late Jurassic and Early Cretaceous Periods (160 – 96 m.y.a.), Australia and Antarctica began to split apart. As they moved apart, a long rift valley was slowly filled up by as much as 3000+ metres of fresh water sediments. These were largely volcanic material, probably from volcanoes within the valley. In addition, alluvial material was deposited by river and streams from either side of the valley. Some of these sediments formed coal deposits. Many contain plant and animal fossils, including dinosaurs. The Otway and Strzelecki Ranges, which are formed from these sediments, were uplifted during the Middle to Late Cretaceous Period as Australia continued to move northward. Minor earthquakes associated with faulting still occur from time to time. None of the sediments in these areas are covered by this report.
South of the Dividing Range the sedimentary basin that developed in the Early Cretaceous Period continued to widen and deepen, forming the Gippsland Basin in the Late Cretaceous to Early Palaeocene Periods (about 70 – 60 m.y.a).
Cainozoic Era
Within East Gippsland there are minor occurrences of Palaeozoic basalts (57 – 55 m.y.a) for example, near Gelantipy and the Fraser Tableland. More extensive areas occur around Warragul and Thorpdale.
During the Tertiary Period (65 to about 1.8 m.y.a.) the Gippsland Basin was in-filled, mostly by sediments from the highlands. The undulating foothills immediately north of Bairnsdale and extending to east of Orbost are based on sediments deposited during the Tertiary Period. Early deposits are marine, but later deposits are alluvial. The end result was an extensive plain, which is now quite dissected.
The Quaternary Period extends from about 1.8 million years to the present and is subdivided into Pleistocene and Recent (10,000 years ago to the present). There were several ice ages during the Quaternary Period which caused considerable rises and falls in sea levels. This was because as ice caps grew in size and water contracted with cooling, the water levels in the oceans dropped.
Extensive colluvial fans are developed along the large Livingstone Creek fault scarp, and extensive alluvial flats and terraces occur along the Tambo River, with more narrow flats along many of the smaller streams.
The last ice age was about 17,000 to 20,000 years ago. It resulted in a sea level fall of about 150 metres and a land bridge being established between Australia and Tasmania. As well as being cold, the climate was dry and windy. Additional sand was probably blown in from the south-west. The lower sea levels caused the major Gippsland Rivers to cut deep valleys into the plains, which then became partly in-filled as the sea level rose to its present level.
Additional geological information for the area covered by the Omeo 1:100 000 mapsheet (8423) can be obtained from the Geological Survey of Victoria Report 118 produced by Willman et al. in 1999. The survey includes information on the economic geology of the region covering mineral exploration, mining history, mineralisation style and economic potential and prospectivity. It also details the geophysical character of the various rock types with lithological descriptions, and a geophysical interpretation of the aeromagnetic and radiometric data. The Geological Survey Report can be ordered from the Department of Primary Industries website.
Table 4: Geological time scale showing approximate age of significant events in East Gippsland
| Era | Period | Epoch | Millions of years | Significant event |
| Quaternary | Recent | Last 10,000 yrs | Modern rivers incise into older flood plains | |
| Pleistocene | 1.6 | Formation of the terraced eastern plains formed by stream deposition from Toongabbie to Lakes Entrance. Several periods of ice age conditions followed by warming | ||
| Pliocene | 5 | Deposition of sands and sandy clays following the uplift of the Eastern Highlands. Plains extend along the southern footslopes of the Highlands from Traralgon to Orbost | ||
| Miocene | 23 | Major uplift of the Eastern Highlands | ||
| Tertiary | Oligocene | 36 | Volcanic flows near Gelantipy and the Fraser Tableland | |
| Eocene | 53 | Brown coal deposits in Latrobe Valley | ||
| Palaeocene | 65 | Australia drifts clear of Antarctica | ||
Cretaceous | 145 | Extinction of dinosaurs Age of upper Otway and Strzelecki rocks | ||
Jurassic | 205 | Development of rift between Australia and Antarctica | ||
Triassic | 250 | Granitic rocks and Volcanic flows near Benambra | ||
Permian | 290 | Ice covered most of Victoria, causing considerable denudation of the highlands | ||
Carboniferous | 360 | Minor tectonic event causing faulting | ||
Devonian | 405 | Major uplift, faulting and folding. Mountains formed in Eastern Victoria. Granitic and volcanic rocks in Central Victoria Buchan basin formed Major uplift, folding and faulting. | ||
Silurian | 436 | Granitic and volcanic rocks in Eastern Victoria Shallow sea in a trough from Bairnsdale to Corryong Major uplift, faulting and folding of much of East Gippsland. Much of Victoria became dry land | ||
Ordovician | 510 | Most of Victoria under a deep sea. Sediment from mountains in South Australia and far western Victoria accumulated on sea floor | ||
Cambrian | 560 | |||
| Pre-Cambrian | 4600 | |||
Top
5 Rocks and sediments in East Gippsland
5.1 General classification of rocks
In East Gippsland the soils have been formed both on hard rock and loose material transported by water or wind, or collecting from higher up a slope. This is known as the ‘parent material’ of the soil. Hard rocks in the area include:
Igneous rocks: Rocks formed from molten rock – either deep below the earth’s surface (plutonic, such as granites) or at the earth’s surface (volcanic, such as the basalts around Gelantipy). Granitic rocks are normally coarse grained – meaning that one can see the different coloured mineral grains in the rock with the naked eye, whereas the mineral grains in volcanic rock are fine and normally can only be seen under magnification.
Sedimentary rock: Rocks formed from the erosion products of other rocks or sediments, from shells and corals (e.g. limestone) or plant remains (e.g. coal). They may also be subdivided into hard sediments or soft sediments, including unconsolidated sediments that have not yet formed the hard material we would usually think of as ‘rock’. Depending on the particle sizes in the sediments, hard sediments may be subdivided into conglomerates that are mostly of stony material, sandstone, siltstones and mudstones.
In Gippsland, most of the hard sedimentary rocks formed from ancient sediments deposited in the Palaeozoic era. These rocks vary in hardness depending on the degree of metamorphosis they have experienced; for example, those formed from finer sediments range from mudstones, shales, schists to gniesses, with mudstones being softest and gniesses hardest. The gniesses here are similar to granite in grain size and like granite, weather to produce sandy soils. Sandstone may become metamorphosed into quartzite.
Soft sediments in East Gippsland are generally less ancient, from the Cainozoic era or later, e.g. the brown coal deposits in the La Trobe Valley. Perhaps the most extensive areas of soft sediments in East Gippsland are the undulating plains immediately south of the Eastern Highlands, extending from Stratford to Cann River. These were mostly deposited during and after a major uplift of the Eastern Highlands about 5 million years ago. Periods of wind, aridity and cold during the last ice age, about 20,000 years ago, have resulted in some of this area becoming partially mantled in sand. The youngest sediments are those in the present river valleys and flood plains.
Metamorphic rock: Any rock which has been changed substantially by heat, pressure or deformation. In Gippsland these include schist, gneiss and quartzite. The rocks may be changed by heat and shearing during periods of mountain building, e.g. the rocks around Ensay North, or by heat due to contact with granites as they cooled deep underground, e.g. steep hills around the granites near Dargo.
5.2 Rocks to soils
The longevity of stone, whether it is in a building, gravestone or bridge shows us the transformation of rock to soil is an extremely slow process. Even when a depth of soil has accumulated, the development of a soil profile such as a texture contrast soil similar to those seen in road cuttings south of Omeo is believed to take tens of thousands of years.
Soils form from rock as a result a process termed weathering, and includes both physical and chemical processes. Chemical processes are more active at the surface of the rock fragments, the smaller the rock fragment the more rapidly it will decompose. Thus physical processes that break rocks down into smaller fragments greatly speed up the chemical processes that convert rock to soil.
Physical weathering is the breakdown of rock by entirely mechanical methods. Sometimes the forces leading to the breakdown of rock originate within the rock; at other times forces are applied externally. Cracks often develop in rocks close to the surface and frost can crack rocks when water confined in these cracks freezes and expands. Temperature changes cause expansion or shrinkage in rocks, and repeated changes in temperature cause the rock to crack or break up, particularly when soil particles fall into the crack and prevent it from closing. Wetting and drying of mudstones can also result in physical weathering as water molecules orient themselves around the clay particles and force them apart. Other methods of physical weathering include mechanical abrasion and collapse under gravity, causing the rock to break down into smaller fragments.
Plants, including mosses and lichens, are a major factor in soil formation. Roots break open small cracks in the rock, help keep the soil in place and retain water necessary for continued weathering.
Chemical weathering is the change in the mineral composition of the rocks and rock fragments. These changes are brought about by oxygen, water, the dissolved carbon dioxide in water. Higher temperatures accelerate the process. After prolonged weathering, the major weathering products of rocks are clays of various types and quartz, which is most resistant of the common minerals to chemical attack. Most silt, sand and gravel particles in a soil are quartz. Soils formed from granite generally have a high coarse sand component because of the quartz crystals present in granite.
Climate has a major bearing on soil formation. The rate of all chemical processes, including soil formation, increases with increasing temperature and rainfall. On the High Plains the average rainfall is higher and the temperatures are lower than for the foothills and plains. Here the additional plant material due to higher rainfall does not decompose rapidly and tends to accumulate as peat. The effects of climate on soil formation are made even more complicated as it effects both plant production and biological activity, which in turn further influence the soil profile. As the rainfall and temperature increases, biological activity also increases often resulting in deep disturbance of the soil profile and the consequent absence of a marked clay horizon deeper in the soil profile. Organic matter content in surface strata can be higher than of soils formed under lower rainfall. Examples of these types of soils are found under the damp mountain ash forests of Gippsland.
Position within the landscape is a major determinant of the rate at which soil material accumulates. The soil in mountainous and very steep hilly land is generally rapidly eroded away, leaving only a shallow soil cover. Here there are comparatively young soils on geologically old rock. On the other hand, soil tends to be deeper on flatter land as erosion rates are slower. Lower slopes and valleys tend to collect soil washed from elsewhere as colluvium (material that moves under gravity down slope) and alluvium (material moved by water) and can have deeper soils.
A defined soil profile slowly develops once a sufficient depth of soil has accumulated. Over time, clay may gradually move down the soil profile: the end stage of this process is the formation of a texture-contrast soil with well defined clay subsoil. Many soil profiles in East Gippsland show this feature. Organic matter tends to accumulate in the topsoil, resulting in darker colours. Iron oxide also moves downwards resulting in stronger, brighter colours in the clay horizon. Often iron oxide nodules or concretions accumulate above clay, but whether these are remnants of earlier soil profiles is open to conjecture.
In the strongly structured soils developed over basalt, e.g. around Gelantipy, the high amount of free iron oxide converts the clay particles into stable clay aggregates, clay particles are not easily moved down the soil profile and texture contrast soils do not occur. In river valleys and low lying areas, soil accumulates so rapidly that a well defined soil profile has little chance to form, other than an accumulation of organic matter in the topsoil. Soils on the Benambra flats are such an example. In these situations soil texture in uniform throughout the profile or changes only gradually with depth.
Top
6 History of land use
6.1 Land use - previous
The historical use of land in the study area was outlined in the publication “Report on the Alpine Study Area” produced by the Land Conservation Council of Victoria in 1977. That report is the major source of information for this section.
Aboriginal people have lived in Australia for 50,000 – 60,000 years. Probably their most significant effect on the vegetation was their use of fire for hunting animals. Several tribes inhabited the High Country region, with the main tribes being Jaitmathang and Kandagora-mittung. The tribes predominantly lived around Lake Omeo Plain, the rolling hills of Livingstone Creek and the Tambo headwater areas, occupying the lower areas for most of the year and visiting higher areas in spring and summer. The group of tribes known as the Kurnai occupied most of the study area south of the Great Dividing Range. Aboriginal numbers dwindled after European settlement and the tribes virtually disappeared, with campsites around Omeo being the only present evidence of their long occupation.
As European settlement extended on the Monaro plains, pressure for new grazing area increased and settlers, such as McKillop, Livingstone and McFarlane in 1835, sought the extensive grazing lands of the Omeo plains. Edmund Buckley explored the Bindi and Tongio areas in 1837. This led to the ring-barking and clearing of trees, and the burning of the vegetation to prepare the land for agriculture and encourage fresh grass on bush country. Settlers introduced domestic grazing animals wherever suitable grazing land occurred.
The Omeo district was one of the first areas to be used for grazing with pastoralists moving their stock from the Monaro region. The Omeo region and Upper Tambo
valley subsequently became the gateway to the extensive grazing areas of Gippsland in the early days.
The discovery of gold followed and exceeded grazing as an economic incentive. The rush began in the early 1850s with discovery of alluvial deposits around Omeo, Cobungra and Mitta Mitta. Additional goldfields were explored at Swifts Creek, Tongio West, Cassilis and the Upper Livingstone Creek by the end of the 1850s.
Mining activities had a significant impact on the land during the mining boom. Many kilometres of streambeds and terraces were sluiced, water races were cut in the hills, river flats were dredged and forests were cut to produce timber for dwellings, mine construction and firewood. Small villages and townships sprang up with the influx of miners. Mining towns expanded, especially around Omeo, Brookville and Cassilis.
With the decline of gold mining in 1914, forests provided timber for fencing and farm buildings. Sawlog harvesting did not commence in a significant way until much later, with a sawmill being established at Mount Baldhead in 1930.
After the Second World War significant demand for timber was made on the study area and this lead to Omeo and Swifts Creek opening their first sawmills in 1946.
Recreation in the area increased greatly after the Second World War. Activities include skiing, bushwalking, fishing and recreational driving.
6.2 Land use – present
Agriculture, forestry, nature conservation, recreation and residential use are the main present land uses.
Agriculture
Cattle and sheep grazing is the most widespread form of agriculture in the area although there are a number of small enterprises such as deer farming, Angora goat farming and wineries.
Forestry
Timber productivity is greatest in the open forests dominated by Mountain Ash (Eucalyptus regnans) and Alpine Ash (E. delegatensis) with limited Shining Gum (E. nitens). The timber is harvested as sawlogs and pulpwood, can be seasoned for flooring or cabinet making or used to make high quality paper (Aldrick 1992). Mountain Ash is the world’s tallest hardwood tree and is easily killed by fire as is Alpine Ash (Costermans 1983). No timber is logged within the area described in this manual although Swifts Creek has a sawmill.
Nature conservation and recreation
This manual’s study area contains a small part of the Alpine National Park. At 646,000 ha, it is the State's largest park, and with adjoining national parks in NSW and the ACT it forms a protected area over most of Australia's high country. Extensive snowfields are the primary winter attraction; while the warmer months bring stunning wildflower displays and opportunities for bushwalks and four wheel driving. The 650 km Australian Alps Walking Track traverses the Alps from Walhalla to Canberra.
Top
7 Soil issues of the Omeo/Benambra and Tambo Valley region
Soil must be physically, nutritionally and biologically balanced to be productive and stable. Soil structure decline, soil acidification and soil erosion are common soil health issues with the potential to severely restrict agricultural productivity on susceptible soil types, while erosion may also contribute to downstream sedimentation and turbidity within water storages (Hollier 2003).
In order to protect the soil, it is important to maintain groundcover in the form of living plant material, failed crops, and crop stubbles or pasture residues. The Drought Preparation and Survival Guide (NRE 2002) points out the amount of groundcover will depend upon the region, soil type and seasonal weather expectations and it is important to remember pasture and stubble will deteriorate over time due to trampling, wind and rain damage.
7.1 Soil structure decline
Soil structure, or pedality, refers to the arrangements of soil particles and the spaces (pores) between them. Natural aggregates are called peds, therefore a soil may be pedal or apedal depending on the presence or absence of peds. The structure of a soil governs infiltration and the volume of air and water available for plant growth. Structural deterioration leads to surface crusts and compaction which inhibit plant growth and reduce soil biological activity. Soil structure can be maintained by paying attention to stocking rates, removing livestock from wet areas, and maintaining vegetation cover (Hollier 2003).
7.2 Soil erosion
Following European settlement overgrazing by stock and rabbits, and burning lead to loss of vegetation. In the harsh alpine environment, revegetation was slow and consequently wind and water erosion occurred (LCC 1982). In the northern valleys agriculture has caused serious problems; with the Omeo/Benambra area being the most severely gully-eroded area in the Lake Hume catchment (Rowe 1967). Past development based on gold prospecting and mining has disturbed the environment and left sediment dumps in the Cassilis valley (Rees 1995).
The steeper slopes in the study area are highly prone to water erosion, particularly sheet and gully erosion. Sheet erosion is caused by heavy rain falling on unprotected slopes and is characterised by a more or less uniform wasting away of the surface soil. It rapidly reduces the productivity of land by carrying off the rich organic matter and readily available plant food, and may continue for lengthy periods undetected. If unchecked it is rapidly followed by rill and gully erosion (SEC 1938). Gullies are defined as open erosion channels at least 30 cm deep that conduct ephemeral runoff and are frequently characterised by steep side walls and a lack of vegetation, whereas rills are narrower and shallower than gullies (Boucher 2006).
Topsoil dislodged and carried away by wind or water removes nutrients such as nitrogen, phosphorus and organic carbon, which are integral components for the health of the soil and production. With every millimetre of topsoil eroded, it is estimated that about 13 t/ha of topsoil, 130 kg/ha of organic carbon (based on a soil carbon level of 1%), 20 kg/ha of nitrogen equivalent to 40 kg of urea and 8 kg/ha of phosphorus equivalent to 100 kg of super phosphate are lost. It is possible to replace phosphorus and some nitrogen through fertiliser application, however organic carbon and nitrogen take years of careful management to restore. Hence soil erosion will decrease the productivity of the land for many years to come (NRE 2002).
Climate In relation to erosion
Rowe (1967) observed that high-intensity rainfall is responsible for starting most of the serious erosion in the region and therefore the condition of the land upon which high intensity rainfall occurs is critical. Although he made no measurements of storm intensity, he found the average wet day’s rainfall in Omeo is highest in late summer and autumn. Unfortunately this is the period of least ground cover. He considers the remedy is to maintain as dense a ground cover as practicable and careful grazing management of the pastures in summer is necessary, particularly on slopes, so that overgrazing does not reduce cover below suitable limits.
Frost can also be a powerful agent of erosion, particularly when occurring upon bare soil, where frost action causes the surface to crumble and become powdery, thus also becoming susceptible to wind erosion. This form of erosion may occur at any time of the year in the sub-alpine and alpine tracts and again is prevented by maintaining ground cover (Rowe 1967).
In dry periods, soils become more susceptible to wind erosion. When groundcover is lost, strong winds are able to erode soil particles depositing them either as drifts along fence lines or transporting them up to thousands of kilometres away (NRE 2002).
7.3 Soil acidity
Australia's soils are old and highly weathered and some of them will be naturally more acidic than others (COA, 2001). In the high rainfall (>600mm/year) zones of Victoria soil acidification is becoming a priority issue for many farmers (Hughes 2001). Except for small areas of soil on calcium-rich alluvium near Benambra, soils in the study area are mostly acid (Rowe 1967). Most are moderately acid at the surface, which is with a pH of between 5.5 and 6, with areas of strongly acid soils (pH 5-5.5). Landcare Victoria (1992) estimates that strongly acid soils, i.e. pH of less than 5.5 in water, affects 1.2 million ha of Victoria's agricultural land, costing $15 million in lost production annually.
Extremes in acidity also present problems for the production of many agriculturally important clover species and their symbiotic rhizobia. Soil chemistry is complex and it can be difficult to identify the precise cause of poor plant growth or nodulation. However, aluminium and manganese toxicities, as well as molybdenum and phosphorus deficiencies, are probable causes of poor production in many strongly acid soils (DPI 2004).
In a report titled “The impact of acid soils in Victoria” Slattery and Hollier (2002) suggest the causes of soil acidity are:
- Removal of product from the farm or paddock
- Leaching of nitrogen as nitrate below the plant root zone
- Build up of organic matter
- Inappropriate use of nitrogenous fertiliser
- Erosion of top soil, sub-soil becoming surface soil
The use of acid tolerant plants is widespread in the higher rainfall grazing areas. Many producers rely on moderate to highly tolerant pasture species (eg subterranean clover, perennial ryegrass and cocksfoot). Since the mid 1990s there has been a revival in the establishment of perennial systems (phalaris). This trend is reflected in increased lime usage. There is growing interest in low input native pastures for light textured, rocky or steep areas where it is difficult to apply lime (Hughes 2001).
7.4 Soil fertility decline
Australian soils are naturally low in nutrients, particularly phosphorus. In alpine areas sulphur deficiency has also been found to be as important as phosphorus. Phosphorus has been found to have a residual life after use of 2-3 years while sulphur needs to be used annually (Hamilton and Mahoney 1985).
Grazing practices in Victoria for over 100 years have substantially increased the fertility of large areas of previously nutrient-deficient soils by adding phosphorus, sulphur, potassium and trace elements as fertiliser and nitrogen from legumes, organic matter from plant growth and crop residue. Intensive agriculture necessitates the maintenance of this soil nutrient balance, as nutrients removed via crops and grazing must be replaced naturally and through manufactured fertilisers. Most Victorian farming soils are susceptible to nutrient decline if not properly managed. This decline can be ameliorated by reducing leaching and run-off through improved soil and water management and incorporating revised pasture and cropping management to maintain levels of organic matter.
Soil classification
In describing a soil the major properties looked at by soil scientists include:
- The position in landscape and the degree of slope (e.g. eastern mid-slope 15%)
- The sand, silt and clay content – as determined by its soil texture (or feel between the fingers when moist)
- Degree of contrast in texture of successive horizons and the sharpness of the transition
- Colour of each horizon
- Size, shape and consistence of the natural aggregates (peds) and the pattern of cracks between them
- Presence or absence of free lime, either as white streaks or as large round concretions
- Presence or absence of ironstone gravel
- Degree of acidity or alkalinity
- Depth to parent rock or unconsolidated parent material.
Australian soil classification
| Soil order | Example |
| Human made soils ANTHROPOSOLS Dominated by organic materials ORGANOSOLS Negligible pedological organization RUDOSOLS Weak pedological organisation TENOSOLS Bs, Bh, or Bhs horizons* PODOSOLS Clay ≥ 35% in all horizons, cracks, slickensides VERTOSOLS Prolonged seasonal saturation HYDROSOLS Strong texture contrast between A and B horizons pH < 5.5 in upper B horizon KUROSOLS Sodic in upper B horizon with pH ≥ 5.5 SODOSOLS Non-sodic in upper B horizon with pH ≥ 5.5 CHROMOSOLS Lacking strong texture contrast between A and B horizons Calcareous throughout profile or below A1 CALCAROSOLS High free iron B2 horizon FERROSOLS Structured B2 horizon DERMOSOLS Massive B2 horizon KANDOSOLS | Highly disturbed building sites Dark peaty soil on the High Plains Shallow soils on steep hilly uncleared forest land north of Tambo Crossing As above, but slightly deeper soils Deep sand soils just east of Providence Ponds (Perry River) Cracking clay soils on the flats near Lake Omeo Swamp soils Typical soils exposed on road cuttings between Lakes Entrance and Cann River Typical soils on the Munro Plains Common around Swifts Creek Many soils on undulating land around Omeo Soils on limestone around Buchan Dark red and brown heavy loam soils around Gelantipy and Fraser Tableland Many soils on undulating land around Cobungra Not common in Gippsland |
Bs (iron or aluminium oxide enriched B horizon)
Organosols with their peaty top-soil are common on the High Plains. Rudosols and Tenosols are generally shallow soils in Gippsland and common on steep slopes with little soil cover. Podosols are mainly sandy soils with “coffee rock” at depth in the soil profile and frequently occur in the foothills. Vertosols are high clay content soils and are found on the Benambra flats. Kurosols, Chromosols and particularly Sodosols are common on undulating land comprising a variety of rock types. Kurosols are acidic and may benefit from lime applications, whereas Sodosols are sodic and prone to gully and tunnel erosion. Calcareous soils are found around Buchan on the limestone country, where they are generally strongly structured. Ferrosols, which are dark brown to red well-structured loam soils on basalt, occur around Gelantipy and the Fraser Tableland and are well suited to intensive agriculture. Dermosols and the weakly structured or massive Kandosols are common in higher elevations and, like Sodosols, occur on undulating to hilly country. Excepting Anthroposols and Organosols, examples of all of these soil orders are described in East Gippsland.
Top
Soil - landform units
Top
Interpretation of soil analytical data
1.1 Soil horizons | 1.2 Field texture | 1.3 pH | 1.4 Total soluble solids (TSS%) | 1.5 Nitrogen | 1.6 Carbon (C) | 1.7 Calcium (Ca) | 1.8 Magnesium (Mg) | 1.9 Potassium (K) | 1.10 Cation exchange capacity (CEC) | 1.11 Exchangeable sodium percentage (ESP) 1.12 Calcium:Magnesium ratio (Ca:Mg) | 1.13 Soil constituents
This chapter was previously published by Sargeant, I. and Sargant, J. (2005) in Sustainable Soil Management – a reference manual to the major agricultural soils of the Bairnsdale and Dargo regions. Department of Primary Industries, Bairnsdale, Victoria.
This section comes from the publications “A manual on the soil testing service provided by the Division of Agricultural Chemistry” by A.J. Brown, K.K.H. Fung and K.I. Peverill (1982), “The analytical and interpretive service provided by Ag- Plus” by K.I. Peverill, S.W. Margetts, A.J. Brown, N.B. Grennhill and G.R. Monro (1987) and a manual by P Hazelton and B Murphy (2007) titled “Interpreting soil test results: what do all the numbers mean?” The definitions of soil horizons are from “Australian Soil and Land Survey” (McDonald et al. 1990).
1.1 Soil horizons
A soil profile may be sub-divided into a number of soil horizons, which are layers of soil approximately parallel to the surface. The O and P horizons are dominated by organic material in varying stages of decomposition that have accumulated on the mineral soil surface, whereas the A, B, C , D and R are dominated by soil minerals. Information about the A, B and C horizons is included here.
A horizons
These are horizons consisting of one or more surface mineral horizons with some organic accumulation and usually darker in colour than the underlying horizons, or consisting of surface and subsurface horizons that are lighter in colour but have a lower content of silicate clay and/or sesquioxides than the underlying horizons.
A1 horizon mineral horizon at or near the soil surface with some accumulation of humified organic matter, usually darker in colour than underlying horizons and with maximum biologic activity for any given soil profile
A2 horizon mineral horizon having, either alone or in combination, less organic matter, sesquioxides, silicate clay than immediately adjacent horizons. Usually paler in colour than the A1 horizons
A3 horizon transitional horizon between A and B which is dominated by properties characteristic of an overlying A1 or A2.
B horizons
These horizons consist of one or more mineral soil layers characterised by one or more of the following: a concentration of silicate clay, iron, aluminium, organic material or several of these; a structure and/or consistence unlike that of the A horizons above or of any horizons immediately below; stronger colours, usually expressed as higher chroma and/or redder hue, than those of the A horizons above or those of the horizons below.
B1 horizon transitional horizons between A and B, which is dominated by properties characteristic of underlying B2.
B2 horizon horizon in which the dominant feature is one or more of the following:
- an illuvial, residual or other concentration of silicate clay, or iron, aluminium, or humus either alone or in combination;
- maximum development of pedologic organisation (i.e. all changes in soil material resulting from the effect of physical, chemical and biologic processes) as evidenced by a different structure and/or consistence, and or/stronger colours than the A horizons above or any horizon immediately below.
These are layers below the AB profile or consolidated and unconsolidated material, usually partially weathered, little affected by pedogenic (soil forming) processes and either like or unlike the material from which the solum presumably formed. It lacks properties characteristic of all other horizons and is recognized by its lack of pedological development and/or presence of geologic organisation frequently expressed as sedimentary laminae or as ghost rock structure as in saprolite.
D horizons
These are considered to be any soil material below the soil solum in that it is unlike the solum in its general character and cannot be given reliable horizon designation.
R horizons
These horizons consist of continuous masses of moderately strong to very strong rock.
1.2 Field texture
Field texture is determined by measuring the behaviour of a small handful of soil when moistened with water and kneaded (1-2 minutes) until it is quite moist but does not stick to the hand. This “ball” is called a “bolus”. It provides an estimate of the relative amounts of coarse sand, fine sand, silt and clay sized particles. Field texture influences many soil physical properties such as water holding capacity and hydraulic conductivity. Numerous soil properties affect the determination of texture such as type of clay minerals, organic matter, carbonates, etc. Texture is determined by the behaviour of the moist bolus and the length of the ribbon when sheared between the thumb and forefinger.
| Field texture symbol | Field texture grade | Behaviour of moist bolus | Approx clay content (%) |
| S | Sand | Coherence slight to nil, cannot be moulded: sand grains of medium size, single grains will stick to the fingers. | less than 5% |
| LS | Loamy sand | Slight coherence; sand grains of medium size; can be sheared between the thumb and forefinger to give a minimal ribbon of about 5mm. | approx 5% |
| CS | Clayey sand | Sight coherence; sand grains of medium size; sticky when wet; many sand grains will stick to the fingers; will form a minimal ribbon of 5-15mm; discolours fingers with clay stain. | 5%-10% |
| SL | Sandy loam | Bolus coherent but very sandy to touch; will form a ribbon of 15-25mm; dominant sand grains are of medium size and are readily visible. | 10%-20% |
| FSL | Fine sandy loam | Bolus coherent; fine sand can be felt and heard when manipulated; will form a ribbon of 13-25mm; sand grains are evident under a hand lens. | 10%-20% |
| SCL- | Light sandy clay loam | Bolus strongly coherent but sandy to touch; sand grains dominantly medium sized and easily visible; will form a ribbon of 20-25mm. | 15%-20% |
| L | Loam | Bolus coherent and rather spongy; smooth feel when manipulated but with no obvious sandiness or “silkiness”; may be somewhat greasy to the touch if much organic matter present; will form a ribbon of about 25mm. | approx 25% |
| Lfsy | Loam, fine sandy | Bolus coherent and slightly spongy; fine sand can be felt and heard when manipulated; will form a ribbon of approx 25mm. | approx 25% |
| ZL | Silty loam | Coherent bolus; very smooth to often silky when manipulated; will form a ribbon of approx 25mm. | clay approx 25%; more than 25% silt |
| SCL | Sandy clay loam | Strongly coherent bolus; sandy to the touch; medium sized grains visible in the finer matrix; will form a ribbon of 25-40mm | 20%-30% |
| CL | Clay loam | Coherent plastic bolus; smooth to manipulate; will form a ribbon of 40-50mm. | 30%-35% |
| CLS | Clay loam, sandy | Coherent plastic bolus; medium sized sand grains in the finer matrix; will form a ribbon of 40-50mm. | 30%-35% |
| ZCL | Silty clay loam | Coherent smooth bolus; plastic and often silky to touch; will form a ribbon of 40-50mm. | clay 30%-35%; more than 25% silt |
| FSCL | Fine sandy clay loam | Coherent bolus; fine sand can be felt and heard when manipulated; will form a ribbon of 38-50mm. | 30%-35% |
| SC | Sandy clay | Plastic bolus; fine to medium sands can be seen, felt or heard in the clayey matrix; will form a ribbon of 50-70mm. | 35%-40% |
| ZC | Silty clay | Plastic bolus; smooth and silky to manipulate; will form a ribbon of 50-70mm. | clay 35%-40%; more than 25% silt |
| LC | Light clay | Plastic bolus; smooth to touch; slight resistance to shearing; will form a ribbon of 50-75mm. | clay 35%-40%; more than 25% silt |
| LMC | Light medium clay | Plastic bolus; smooth to touch; slight to moderate resistance to forming a ribbon; will form a ribbon of 75mm. | 40%-45% |
| MC | Medium clay | Smooth plastic bolus; can be moulded into a rod without fracturing; has a moderate resistance to forming a ribbon; will form a ribbon of 75mm or more. | 45%-55% |
| MC | Heavy clay | Smooth plastic bolus; strong resistance to manipulation and forming a ribbon; will form a ribbon of 75mm or more. | More than 50% |
1.3 pH
The pH of a soil is a measure of soil acidity and soil alkalinity on a scale of 0 (extremely acidic) to 14 (extremely alkaline), with a pH of 7 being neutral. Soils with pHs in water below 4.5 and above 9.5 rarely exist and would not provide a good growth medium. Plant growth is generally favoured by a soil pH between 5.5 and 8.0. With increasing low pHs, particularly below pH 5.5, exchangeable aluminium increases to toxic levels and molybdenum becomes increasingly unavailable.
Descriptive terms for pH (H20) ranges are:
| Descriptive term | pH | Descriptive term | pH |
| Extremely acid | less than 4.5 | Slightly alkaline | 7.1 -7.9 |
| Very strongly acid | 4.5-5.0 | Moderately alkaline | 8.0-8.5 |
| Strongly acid | 5.1-5.5 | Strongly alkaline | 8.6-9.0 |
| Moderately acid | 5.6-6.0 | Very strongly alkaline | 9.1-9.5 |
| Slightly acid | 6.1-7.0 | Extremely alkaline | more than 9.5 |
| Neutral | 7.0 |
Soil pH is carried out using two methods:
- pH(H2O): the pH of the soil in water using a soil:solution ratio of 1:5 (10 gram soil to 50 ml water),
- pH(CaCl2): the pH of the soil in dilute calcium chloride using a soil solution ratio of 1:5 (10 gram soil to 50 ml of 0.01M(CaCl2).
One of the effects of increasing pH by liming is to increase the availability of phosphorus and molybdenum.
1.4 Total soluble salts (TSS %)
Total soluble salts in a soil is a popular way of expressing soil salinity and is measured by multiplying the electrical conductivity (EC) of a 1:5 soil/water suspension at 20°C which has been shaken for one hour by 0.33. TSS is an old unit and you may wish to convert the figures in this manual to EC. There is no clear relationship between electrical conductivity (1:5 soil:water) and total soluble salts due to the different ionic conductivities of the various salts and the influence of the soil particles, but an approximate value for the percentage total soluble salts is obtained by multiplying the electrical conductivity at 25°C (dS/m) by 0.33.
TSS(soil) % = E.C. x 0.33
In other words, to convert the figures in this manual to EC you divide the total soluble salts figure by 0.33.
To convert percentages into parts per million (ppm or mg/kg), the percentage value is multiplied by 10,000.
Soils with EC values less than 0.15dS/m (approximately 500 ppm or 0.05%) are regarded as sufficiently low to have harmless salinity.
| EC (dS/m) | Approx TSS % | Approx. TSS ppm | Interpretation |
| less than 0.15 | less than 0.050 | less than 500 | low and harmless |
| 0.15-0.2 | 0.050-0.067 | 500-670 | slightly higher than normal |
| 0.2-0.5 | 0.067-0.165 | 670-1650 | higher than normal |
| 0.5-0.75 | 0.165-0.248 | 1650-2480 | considerably higher than normal (unfavourable) |
| 0.75-1.00 | 0.248-0.330 | 2480-3300 | high and harmful |
| 1.00-1.50 | 0.330-0.495 | 3300-4950 | very high and harmful |
| more than 1.50 | more than 0.495 | more than 4950 | excessively high |
These are broad interpretations and it should be realised plants vary considerably in their ability to tolerate soluble salts. Salt tolerance within a plant species varies markedly at different stages of growth, with germination and seedling stages generally being less tolerant. Another very important aspect that should be taken into account is soil texture. Given the same EC reading, plants growing on light textured soils are up to twice as affected by soluble salts as those growing on heavy textured soils.
Some farmers have managed to manage and reverse salinity by liming and/or application of microbial mixes and humates (Anon, Acres Australia Vol 1 (2)). More information may be obtained from the Organic Information and Resource Centre, PO Box 1263, Bairnsdale, 3875.
1.5 Nitrogen (N)
Nitrogen (N) is a constituent of all proteins and is found in every living cell. In plants it is the key component of chlorophyll. Although the atmosphere contains 79% nitrogen or about 300,000 tonnes above each hectare of land, plants cannot directly access this source and frequently show symptoms of nitrogen deficiency, such as poor growth and yellowing of leaves. The quantities removed by average crops of wheat, cabbages and tomato are about 60, 150 and 120 kg/ha respectively. Plants can only take up nitrogen as nitrate (NO3-) or ammonium (NH4+).
Nitrogen sources
In nature the ultimate source of nitrogen is lightning in the atmosphere. A small amount of gas is converted to NO3- by electrical discharge and falls with the rain. But most nitrogen in the soil is “fixed” by bacteria. The bacteria may exist freely in the soil (Azobacter) or be associated with leguminous plants such as peas, clover or lucerne (Rhizobium). The process of moving the nitrogen in the air to nitrogen compounds in the soil is called “nitrogen fixation”.
Nitrogen is also available to the plant following the decomposition of dead plants and animals, and the addition of animal wastes such as urine. However if the organic wastes are too high in carbon (high carbon /nitrogen ratio) then there is an increase in microbial activity which competes with the plant for nitrogen. This can occur when organic matter low in nitrogen, e.g. straw, is added to the soil. Fertiliser sources of nitrogen are urea, potassium nitrate, ammonium nitrate, mixed fertilisers, ammonium sulfate, blood and bone and liquid ammonia. In Australia, apart from intensive cropping, relatively little nitrogen fertiliser is used on dryland pasture. Instead, the nitrogen requirement is generally met by the nitrogen fixing bacteria associated with leguminous plants.
Deficiency
Nitrogen deficiency is a potential for all crops excluding legumes, so signs of poor growth and leaf yellowing must be looked for. In pastures, the extreme contrast between growth on urine patches and the surrounding area often indicate nitrogen deficiency. In wheat lands, clover is grown in a rotation between crops and this is used to provide nitrogen for crop growth.
1.6 Carbon (C)
Organic matter is that material in a soil which is directly derived from plants and animals, and supports most important microfauna and microflora in the soil. Through its breakdown and interaction with other soil constituents it is largely responsible for much of the physical and chemical fertility of a soil (Charman and Roper, 1991).
Organic matter and organic carbon are usually expressed as a percentage of the soil by weight. Care should be taken when presenting and interpreting results as to whether organic matter or organic carbon levels are indicated. In this manual organic carbon levels are used.
Soil organic carbon levels (%)
| Interpretation | Low rainfall | (<500 mm) | High rainfall | (>500 mm) |
| Crops | Pasture | Crops | Pasture | |
| Low | 0.09 | 1.7 | 1.45 | <2.9 |
| Normal | 0.09 – 1.4 | 1.7 – 2.6 | 1.45 – 2.9 | 2.9 – 5.8 |
| High | >1.45 | >2.6 | >2.9 | >5.8 |
1.7 Calcium (Ca)
Calcium is required for cell walls and is necessary for normal cell division and is associated with proteins, nucleic acids and enzymes. As a result, calcium deficiency results in the disintegration of roots and the terminal portion of shoots. Calcium is also part of the genetic coding material of the nucleus. As calcium is abundant in most soils, deficiency symptoms are rarely seen in the field. Calcium is generally adequate in surface soils, particularly when pHs are over 5.5.
Lime, superphosphate and gypsum contain significant amounts of calcium.
1.8 Magnesium (Mg)
Magnesium along with nitrogen is found in chlorophyll, the green colouring in plants. Chlorophyll is necessary for the conversion of carbon dioxide in the air to carbohydrates. It also forms soluble organic salts, which help maintain cell rigidity. Although plant deficiencies are rare, lactating sheep and cattle may be unable to get enough magnesium from the grass due to imbalance between this nutrient and potassium, resulting in an often fatal disorder called “grass tetany”.
Magnesium is generally adequate in soils as clays typically contain about 0.05 to 1.0% magnesium. As these clays weather, the magnesium is released and is held on exchange positions. Magnesium may be added to the soil as dolomite (CaMgCO3).
1.9 Potassium (K)
Potassium is an essential constituent of all living cells and is the major nutrient in plants. Potassium plays an important part in many physiological processes in the plant such as respiration, transpiration and the synthesis of carbohydrates and sugars. It is also the major constituent in cell fluid and maintains cell rigidity. Plants take up potassium, as they do all nutrients, from soil solution.
Sources
The potassium containing minerals in soils are generally the clay minerals, mica and illite, but some young soils derived from basalt and granite may contain unweathered potassium containing felspar. Where a deficiency occurs, artificial fertilisers such as potassium chloride (muriate of potash) are used, particularly after heavy cropping or fodder removal.
Deficiency
Deficiency symptoms are poor growth, leaf scorch and leaf spotting, particularly in older leaves. Dry vegetative growth contains 1-4% potassium so leafy crops remove quite large amounts.
South of the dividing range, Victorian soils generally contain low amounts of potassium containing minerals. So soils which are cropped (vegetables or hay cutting) become potassium deficient.
In Northern Victoria, the total potassium content of a soil may be over 1.5% whereas most southern Victorian soils, (Otways and Strzeleckis excluded), total potassium is generally less than 0.5%.
Available potassium
The deficiency levels quoted below for soil samples taken at 0-10 cm are a useful guide for pastures in most circumstances. If exchangeable cation data are given (see Section 1.7), the potassium value (meq/100 g) may be multiplied by 390 to give the potassium level in the soil in parts per million.
| Interpretation | Sand | Sandy loam | Clay loam | Clay |
| Low | less than 50 | less than 80 | less than 110 | less than 120 |
| Deficiency level | 50-100 | 80-120 | 110-160 | 120-180 |
| Moderate | 100-150 | 120-200 | 160-250 | 180-300 |
| High | greater than 150 | greater than 200 | greater than 250 | greater than 300 |
1.10 Cation exchange capacity (CEC)
The cation exchange capacity is a measure of the soil’s ability to absorb and to hold cations. The five most abundant cations are calcium (Ca2+), magnesium (Mg2+), potassium (K+) and sodium (Na+) and in strongly acid soils, aluminium (Al3+). The cations manganese (Mn2+), iron (Fe2+), copper (Cu2+) and zinc (Zn2+) are usually present in amounts that do not contribute significantly to the cation compliment. The calculation of the cation exchange capacity is the sum of exchangeable calcium, magnesium, potassium, sodium and exchangeable acidity (H+) if the soils are below pH 7. This measurement provides an indication of the potential amount of cations available in the soil and in what ratios.
The cations have a positive electrical charge and are held on the negatively charged surfaces of clay minerals and organic matter. These cations can be exchanged for other cations, for example one Ca2+ cation can be exchanged for two Na+ cations, and are therefore said to be “exchangeable” cations. Some clays e.g. montmorillonite, have a greater negative charge than others, e.g. kaolinite, but the types of clay in the soils described in this manual have not been determined. Little can be done to improve the soil clay content. However organic matter has a high ability to hold cations and additions of manure, crop waste and other organic materials will improve the cation exchange capacity (see Section 1.11).
A high cation exchange capacity means that a soil has good nutrient cation retention. Soils high in clay and organic matter have a high cation exchange capacity and can retain fertiliser cations. In contrast, sandy soils, which are low in clay and/or organic matter, have a low cation exchange capacity so fertiliser is soon leached out.
The cation exchange capacity of a soil is a major controlling agent of stability of soil structure, nutrient availability for plant growth, soil pH and the soil’s reaction to fertilisers and other ameliorants (e.g. lime, gypsum and dolomite).
Anions are also present in a soil, being held on positively charged surfaces of oxides and iron and aluminium. An example of an anion is H2PO4-, which denotes the usual form of phosphorus in a soil when superphosphate is added. No analyses of anions were carried out.
Nutrient status
The exchangeable cation capacity may be used as a guide to the nutrient status of the soil. This is calculated as the sum of exchangeable calcium, magnesium and potassium (in milliequivalents per 100g) and can be used as a rough guide to availability of nutrients in general. The categories used are given in the table below:
| Potential fertility rating | Total (meq/100g)* |
| Very low | 0 – 3.9 |
| Low | 4 – 7.9 |
| Moderate | 8 – 17.9 |
| High | More than 18 |
*Note: The State Chemistry Laboratory report the cation exchange capacity in the unit milliequivalents (meq)/100g which is equivalent to cmol (+) /kg used by some other laboratories.
1.11 Exchangeable sodium percentage (ESP)
This is calculated as the proportion of the cation exchange capacity occupied by sodium ions and is expressed as a percentage.
If the ESP is less than 8, the soil is non-sodic, from 8-15 the soil is sodic and greater than 15 the soil is strongly sodic. These sodium dominated clays have a tendency to swell on wetting. They are also likely to be dispersive which means the soils are structurally unstable and disperse in water into their basic particles i.e. sand, silt and clay. The fine clay particles that have dispersed clog up the small pores in the soil, degrading soil structure and restricting root growth and water movement.
1.12 Calcium: Magnesium ratio (Ca:Mg)
This ratio is found by dividing the quantity of exchangeable calcium by the quantity of exchangeable magnesium. If the result is less than 2 there may be excessive magnesium, which could make it more difficult for plants to take up potassium. In this case dolomite, or calcium magnesium carbonate, which contains more than 15% magnesium, should be applied to provide a better ratio. Values less than a Ca:Mg ratio of 2, and particularly less than 1, are thought to favour clay dispersion.
| Ca:Mg | Interpretation |
| <1 | Calcium deficient |
| 1-4 | Calcium low |
| 4-6 | Balanced |
| 6-10 | Magnesium low |
| >10 | Magnesium deficient |
1.13 Soil constituents
Constituents of soils, their surface area per gram and their negative charge, i.e. ability to hold cations, e.g. calcium (Ca), magnesium (Mg), potassium (K) and sodium (Na).
| Component | Size (mm) | Surface area (m2 /g) | Cation exchange capacity (cmol (+)/kg) |
| Gravel | more than 2.0 | nil | |
| Coarse sand | 2.0 - 0.2 | 0.01 | nil |
| Fine sand | 0.2 - 0.02 | 0.1 | nil to very slight if mica present |
| Silt | 0.02 - 0.002 | 1.0 | nil to very slight if mica present |
| Clay | less than 0.002 * | 5 - 750 * | varies according to clay type - kaolinite (a non-swelling clay): about 8 illite: about 30 montmorillonite (a swelling clay): about 100 vermiculite: about 150 |
| Iron, aluminium and manganese oxides and hydroxides | 100 - 200 | varies according to pH about +5 at low pH (i.e. anion adsorbing) to about -5 at pH 7 (i.e. cation adsorbing) | |
| Other oxides (very little) (titanium and zircon) | |||
| Water * | |||
| Air* | |||
| Dissolved salts | |||
| Undissolved salts | |||
| Colloidal organic matter | very high surface area | varies according to organic matter type and pH, up to 300 (i.e. strongly cation adsorbing) |
The components in italics are the most reactive and hold most of the nutrients and water. The high surface area largely contributes to the water retaining ability of the soil.
*Soil air and soil water combined make up about 50% of the volume of surface soil. Even apparently dense clay subsoil will contain 40 – 45% pore space which is occupied by either soil air or soil water.
Source: I. J. Sargeant, unpublished lecture notes, Monash University.
Top
Acknowledgements/thanks
The Commonwealth Government’s Natural Heritage Trust funded soil survey work conducted for this manual.
The main contributors to the manual were: Ian Sargeant (Soil Consultant), Catherine Clancy, Keren Walker, David Rees and Bronwyn Linke of the High Country Landcare Network and the committee members thereof.
The East Gippsland Landcare Network would also like to thank the following people who were involved in this project: Mark Imhof, Brett Mitchard, Carmel Henderson.
The document was compiled in partnership with the Future Farming Systems Research Division of the Department of Primary Industries, Sustainable Landscapes Portfolio of the Department of Primary Industries, Swifts Creek Ensay Landcare group, Omeo Landcare group and the Benambra Landcare group.
Development of the manual was financially supported through the Commonwealth Government’s Natural Heritage Trust Program.
Project Management: Keren Walker1, Julianne Sargant1, Heather Adams1
Field Survey: David Rees1, Ian Sargeant2
Text: Ian Sargeant
Map Products: Brett Mitchard1
Photographs: Ian Sargeant, Keren Walker1, John Commins1
Booklet formatting: Ian Sargeant
Editing Advice: Trish Lothian1, Keith Borley
Technical information regarding vegetation: compiled by Trish Fox and Carmel Henderson1
Glossary of Terms: Mark Imhof1
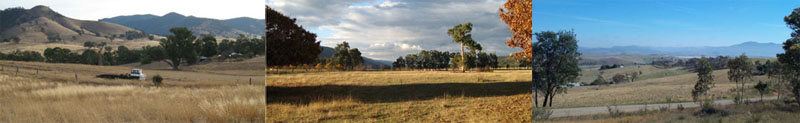
Cover Photographs: Landscape: Timbarra; Soil pit: Hinnomunjie Component 3.
1Department of Primary Industries
2 Ian Sargeant, Soil Consultant, 5 Railway Parade North, Glen Waverley
Top
References
Aldrick J. M., Hook R. A., van de Graaff R. H. M., Nicholson B. M., O’Beirne D. A. and Schoknecht N. R., 1992. A Study of the Land in the Catchment of the Gippsland Lakes. Department of Conservation, Forests and Lands, Victoria, Australia. Technical Communication No 17.
Baker, D.E., and Eldershaw, V.J., 1993. Interpreting soil analyses - for agricultural land use in Queensland. Dept. of Primary Industries, Project Report Series QO93014, Australia.
Boucher, S.C. 2006. Gully erosion. Victorian Resources Online article, available at www.nre.vic.gov.au/DPI/Vro/vrosite.nsf/pages/lwm_land_deg_gully_new
Brown A. J., Fung K.K.H. and Peverill K.I., 1982. A manual on the soil testing service provided by the Division of Agricultural Chemistry.
Charman, P.E.V., and Murphy B.W., 1991. Soils Their Properties and Management. Sydney University Press and Oxford University Press, Melbourne, Australia.
Commonwealth of Australia . 2001 Australian Agriculture Assessment. Published by: National Land and Water Resources Audit . Available at: http://audit.ea.gov.au/ANRA/agriculture/docs/national/Agriculture_Contents.html
Costermans, L., 1983. Native Trees and Shrubs of South Eastern Australia. Weldon Publishing, Sydney Australia.
Department of Primary Industries. 2004. Surface soil pH. Obtainable at www.dpi.vic.gov.au/dpi/vro/vrosite.nsf/pages/surface-soil-pH
Department of Primary Industries, 2005. Sustainable Soil Management. A reference manual to the major agricultural soils of the Bairnsdale and Dargo Region. State of Victoria. Also available online at www.dpi.vic.gov.au/dpi/vro
Eckert, D.J., 1987, 'Soil test interpretations: basic cation saturation ratios and sufficiency levels', in JR Brown (ed), Soil testing: sampling, correlation, calibration, and interpretation, Soil Science Society of America, Madison, pp. 53-64.
Hazelton, P. and Murphy, B., 2007. Interpreting soil test results: What do all the numbers mean? CSIRO Publishing. Melbourne.
Hamilton, L.J. and Mahoney, G.P., (1985) Sulphur in Victorian Pastures, a Review of Research Conducted by the Department of Agriculture, Victoria. Pasture Branch Bulletin No 5. Department of Agriculture Victoria.
Hollier, C., 2003. Small farm: what is a healthy soil? Agriculture Note. Available from www.dpi.vic.gov.au.
Hughes, B,. 2001. Current Practices and Extension on Acid Soils in Victoria. Report attached to (COA 2001 – see above).
Isbell, R.F,. 1996. The Australian Soil Classification. CSIRO Publishing, Melbourne, Australia.
Land Conservation Council, 1977 Report on the Alpine Study Area. Land Conservation Council, Melbourne.
Land Conservation Council ,1982. Report of the Gippsland Lakes Hinterland Area. Land Conservation Council, Melbourne.
Landcare Victoria 1992 Victoria’s Decade of Landcare Plan. Landcare Victoria.
Leper, G.W., 1986. Introduction to Soil Science 4th ed. Melbourne University Press, Melbourne.
Lines-Kelly, R. ,1994. Soil Sense Soil Management for NSW North Coast Farmers. NSW Agriculture, Wollongbar, NSW, Australia.
Lorimer, M.S. and Rowan, J.N. TC. 15. Soil Conservation Authority, Vic., Australia. 1982. Study of the Land in the Catchment of the Avoca River.
McDonald R.C., Isbell R.F., Speight J.G., Walker J. and Hopkins M.S., 1990. Handbook of Australian Soils – Field Handbook. 2nd Ed., Inkata Press, Melbourne.
Munsell Color Company .1975. Munsell Soil Color Charts. Macbeth - Division of Kollmorgen Instruments Corp. Distributed by: Frank McCarthy Color P/L, 38 Marshall Ave. Kew. Vic. Australia.
Natural Resources and Environment (Dept of). 2002. Drought Preparation and Survival Guides. DNRE, Victoria.
NSW Agriculture and Fisheries, 1989. Soil Testing Methods and Interpretation. Biological and Chemical Research Institute, NSW Agriculture and Fisheries, Rydalmere.
Northcote, K.H. ,1979. A Factual Key for the Recognition of Australian Soils. 4th edn. Rellim Tech. Pubs, Adelaide, SA, Australia.
Northcote, K.H. and Skene J.K.M., 1972. Australian soils with saline and sodic properties. CSIRO Soil Publication 27.
Peverill, K. I, Margetts, S. W., Brown, A. J., Greenhill, N. B., and Munro, G. R., 1987. The analytical and interpretive service provided by Ag-Plus.
Rees, D., 1995. A Land Capability Study of the Cassilis Valley, Swifts Creek. Technical Report No. 27. Centre for Land Protection Research, Department of Conservation and Natural Resources, Victoria.
Rees, D. ,2000. Land Systems of Victoria (3rd edition). Technical report No. 56, Centre for Land Protection Research, Department of Natural Resources and Environment, Victoria.
Rowe, R.K., 1967. A study of the land in the Victorian catchment of Lake Hume. Soil Conservation Authority, Victoria.
Rowe, R. K., 1984. Geomorpholgy of the Lake Omeo Basin, Victoria. Proc. Roy. Soc. Vic. 96 No 2 99-112.
Sargeant, I. J. and Imhof, M. P., 2000. Major agricultural soils of the Maffra Region. DNRE.
Sargeant, I. J. and Sargant, J., 2005 Sustainable Soil Management – a reference manual to the major agricultural soils of the Bairnsdale and Dargo regions. Department of Primary Industries, Bairnsdale, Victoria.
Soil Erosion Committee. 1938. Erosion in Victoria. Department of Lands and Survey, Melbourne. Online report available at www.dpi.vic.gov.au
Slattery, B. and Hollier C., 2002. The impact of acid soils in Victoria. State of Victoria. Department of Natural Resources and Environment. (available at www.dpi.vic.gov.au)
Stace, H.C.T., Hubble, G.D., Brewer, R., Northcote, K.H., Sleeman, J.R., Mulcahy, M.J., and Hallsworth, E.G., 1968. A Handbook of Australian Soils. Rellim, Glenside, SA, Australia.
Willman, C.E., Morand, V.J., Hendrick, M.A., VandenBerg, A.H.M., Haydon, S.J., Carney, C., 1999. Omeo 1:100 000 map area geological report. Geological Survey of Victoria Report 118.
© State of Victoria (Agriculture Victoria) 1996 - .

This work, Victorian Resources Online, is licensed under a Creative Commons Attribution 4.0 licence. You are free to re-use the work under that licence, on the condition that you credit the State of Victoria (Agriculture Victoria) as author, indicate if changes were made and comply with the other licence terms.
The licence does not apply to ‘branding’ or some ‘images or photographs’ that may be owned by third parties. We ask you to seek prior approval to use images using the VRO feedback form. Access to higher quality images can also be provided on request.
This page was last updated on .