
Profile Number 62
| Laboratory number: | 0957 | 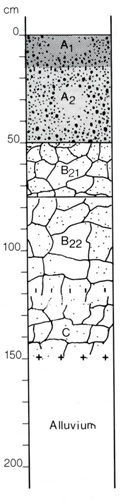 | Profile Description | ||
| Site number: | 404 | A1 | 0-15 cm | Very dark greyish brown (10YR 3/2) sandy loam; moderate crumb structure; earthy fabric; friable when moist; 40% quartz gravel up to 20 mm; abundant fine roots; pH 5.5-6.0; diffuse boundary | |
| Classification: | Northcote (1979) – Dy3.21 Stace et al (1972) - Soloth | A2 | 15-50 cm | Yellowish brown (10YR 5/4) loamy sand; apedal; earthy fabric; soft when dry; 60% quartz gravel up to 30 mm; abundant fine roots; pH 6.0; abrupt smooth boundary | |
| Location: | Bairnsdale 8422, grid ref. 528108 2 km S of Bairnsdale | B21 | 50-75 cm | Yellowish brown (10YR 5/6) heavy clay; common distinct reddish brown (>15 mm) mottles; strong coarse (30 mm) angular blocky structure; smooth-ped fabric; extremely hard when dry; 5% fine quartz gravel up to 3 mm; pH 7.0; clear smooth boundary | |
| Land system, component: | Salt Creek 2 | B22 | 75-120 cm | Yellowish brown (10YR 5/5) heavy clay; common distinct reddish brown (>15 mm) mottles; moderate very coarse (80 mm) angular blocky structure; smooth-ped fabric; extremely hard when dry; 5% fine quartz gravel up to 5 mm; pH 7.5; diffuse wavy boundary | |
| Topography: | 5% slope on Pleistocene terrace, NW aspect | C | 120+ cm | Brownish yellow (10YR 6/6) light medium to light clay; common prominent yellowish brown (>15 mm) mottles; strong coarse (30 mm) angular blocky structure; smooth-ped fabric very firm when moist; 2% fine quartz gravel up to 5 mm’ pH 6.0 | |
| Elevation: | 20 m | ||||
| Drainage: | Good | ||||
| Parent material: | Tertiary and Pleistocene alluvium of mixed texture | ||||
| Vegetation: | Cleared; grassland with Themeda australis, Plantago lanceolata, Holcua lanatus and Briza maxima | ||||
| LABORATORY ANALYSES 957 | |||||||||||||||||||
Horizon | Sample Depth cm | Lab. texture | Particle size distribution | Atterberg limits | 1:5 soil water suspension | Clay mineralogy by x-ray diffraction | |||||||||||||
Gravel % | Coarse sand % f.e. | fine sand % f.e. | Silt % f.e. | Clay % f.e. | liquid limit % | plastic limit % | plasticity index % | linear shrinkage % | pH | EC 25°C µS/cm | Cl- % | Depth cm | Composition % | ||||||
A1 | 0-10 | LS | 16 | 24 | 49 | 16 | 9 | 4.8 | 51 | 0.004 | |||||||||
A2 | 30-50 | LS | 57 | 28 | 51 | 13 | 6 | 13.9 | 13.5 | 0.4 | 0.6 | 5.6 | 22 | 0.002 | |||||
B21 | 60-75 | C | 7 | 8 | 17 | 4 | 70 | 73 | 21 | 52 | 15 | 6.4 | 150 | 0.013 | |||||
B22 | 90-120 | C | 7 | 11 | 24 | 8 | 56 | 5.5 | 170 | 0.013 | |||||||||
C | 150-180 | SiC | 20 | 1 | 13 | 34 | 52 | 4.9 | 240 | 0.026 | |||||||||
Horizon | Sample Depth cm | Org. C % | Total N % | 1.3C N | Free Fe2O3 % | Available | HCl extract | Exchangeable cations | |||||||||||
P ppm | K ppm | P % | K % | Ca | Mg | K | Na | CEC | Ca % of CEC | Mg | K | Na | H | ||||||
Milliequivalents/100g | |||||||||||||||||||
A1 | 0-10 | 1.88 | 0.16 | 15 | 0.9 | 15 | 60 | 0.012 | 0.068 | 1.7 | 0.8 | 0.2 | 0.1 | 12.5 | 14 | 6 | 2 | 1 | 77 |
A2 | 30-50 | 0.5 | 0.005 | 0.047 | 1.0 | 0.4 | 0.1 | 0.1 | 2.9 | 34 | 14 | 3 | 3 | 46 | |||||
B21 | 60-75 | 5.5 | 0.013 | 0.39 | 2.9 | 8.2 | 0.2 | 3.1 | 23.7 | 12 | 35 | 1 | 13 | 39 | |||||
B22 | 90-120 | 4.3 | 0.007 | 0.38 | 1.2 | 6.9 | 0.2 | 3.0 | 18.7 | 6 | 37 | 1 | 16 | 40 | |||||
C | 150-180 | 5.4 | 0.012 | 0.49 | 0.5 | 7.4 | 0.2 | 4.7 | 20.0 | 3 | 37 | 1 | 24 | 35 | |||||
© State of Victoria (Agriculture Victoria) 1996 - .

This work, Victorian Resources Online, is licensed under a Creative Commons Attribution 4.0 licence. You are free to re-use the work under that licence, on the condition that you credit the State of Victoria (Agriculture Victoria) as author, indicate if changes were made and comply with the other licence terms.
The licence does not apply to ‘branding’ or some ‘images or photographs’ that may be owned by third parties. We ask you to seek prior approval to use images using the VRO feedback form. Access to higher quality images can also be provided on request.
This page was last updated on .