
Profile Number 36
| Laboratory number: | 1002 | 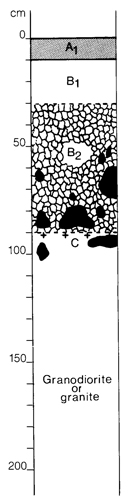 | Profile Description | ||
| Site number: | 522 | A1 | 0 - 8 cm | Dark reddish brown (5YR 2/2) loam; strong crumb structure; rough-ped fabric; hard when dry; abundant roots; pH 4.0; clear wavy boundary | |
| Classification: | Northcote (1979) - Gn4.11 Stace et al. (1972) – Krasnozem | B21 | 8 - 44 cm | Dark reddish brown (5YR 3/3) clay loam; moderate fine (8 mm) subangular blocky structure; rough-ped fabric; slightly hard when dry; common roots; pH 5.0; gradual wavy boundary | |
| Location: | Omeo 8423, grid ref. 564578 20 km SW of Swifts Creek | B22 | 44 - 180+ cm | Dark red (2.5YR 3/6) light clay; moderate fine (8 mm) angular blocky structure; rough-ped fabric; slightly hard when dry; common roots to 90 cm depth, few between 90 - 180 cm; 5% small fragments of parent rock (about 3 mm); pH 6.0 | |
| Land system, component: | Jamieson, 3 | ||||
| Topography: | Upper slope of ridge, 8% gradient | ||||
| Elevation: | 880 m | ||||
| Drainage: | Good | ||||
| Parent material: | Ordovician mudstone and sandstone | ||||
| Vegetation: | Layered open forest III: Eucalyptus obliqua, E. delegatensis and Acacia dealbata. Olearia argophylla, Bedfordia arborescens, Pteridium esculentum, Tetrarrhena juncea and Poa sp. predominant in understorey | ||||
| LABORATORY ANALYSES 1002 | |||||||||||||||||||
Sample Depth cm | Lab. texture | Particle size distribution | Atterberg limits | 1:5 soil water suspension | Clay mineralogy by x-ray diffraction | ||||||||||||||
Gravel % | Coarse sand % f.e. | fine sand % f.e. | Silt % f.e. | Clay % f.e. | liquid limit % | plastic limit % | plasticity index % | linear shrinkage % | pH | EC 25°C uS/cm | Cl- % | Depth cm | Composition % | ||||||
0 - 8 10 - 20 30 - 44 60 - 90 120 - 150 | SiL SiL SiL C C | 18 4 5 18 14 | 11 8 5 4 5 | 32 39 36 25 26 | 30 28 36 22 23 | 19 22 21 46 44 | 59 | 30 | 29 | 16 | 5.0 5.2 5.3 5.2 5.2 | 37 17 14 13 12 | 0.005 0.003 0.003 0.002 0.002 | ||||||
Sample Depth cm | Org. C % | Total N % | 1.3C N | Free Fe2O3 % | Available | HCl extract | Exchangeable cations | ||||||||||||
P ppm | K ppm | P % | K % | Ca | Mg | K | Na | CEC | Ca % of CEC | Mg | K | Na | H | ||||||
Milliequivalents/100g | |||||||||||||||||||
0 - 8 10 - 20 30 - 44 60 - 90 120 - 150 | 10.6 6.5 | 0.63 0.41 | 22 21 | 4.1 4.6 4.5 4.6 4.9 | 16 10 | 200 120 | 0.035 0.025 0.023 0.021 0.021 | 0.22 0.17 0.18 0.20 0.17 | 0.4 <0.05 0.1 0.1 0.07 | 0.2 0.08 0.01 0.07 0.01 | 0.7 0.6 0.5 0.4 0.4 | 0.09 0.1 0.09 0.04 0.05 | 81.5 68.1 53.5 29.3 23.3 | 1 <1 <1 <1 <1 | <1 <1 <1 <1 <1 | 1 1 1 1 2 | <1 1 <1 <1 <1 | 98 98 99 99 98 | |
© State of Victoria (Agriculture Victoria) 1996 - .

This work, Victorian Resources Online, is licensed under a Creative Commons Attribution 4.0 licence. You are free to re-use the work under that licence, on the condition that you credit the State of Victoria (Agriculture Victoria) as author, indicate if changes were made and comply with the other licence terms.
The licence does not apply to ‘branding’ or some ‘images or photographs’ that may be owned by third parties. We ask you to seek prior approval to use images using the VRO feedback form. Access to higher quality images can also be provided on request.
This page was last updated on .