
Profile Number 29
| Laboratory number: | 0983 | 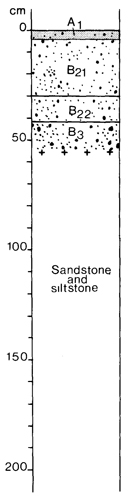 | Profile Description | ||
| Site number: | 573 | A1 | 0 - 4 cm | Dark reddish brown (5YR 3/3) stony loam; weak crumb structure; rough-ped fabric; slightly hard when dry; 15% bedrock fragments (10 mm); pH 5.0, clear boundary | |
| Classification: | Northcote (1979) - Gn2.11 Stace et al. (1972) - Lithosol - RedEarth intergrade | B21 | 4 - 30 cm | Yellowish red (5YR 4/6) stony clay loam; apedal; earthy fabric; slightly hard when dry; 15% bedrock fragments (10 mm); pH 5.5; clear boundary | |
| Location: | Maffra 8222, grid ref. 686450 5 kmSE of Sugarloaf | B22 | 30 - 42 cm | Dark red (2.5YR 3/6) stony light clay; apedal; earthy fabric; slightly hard when dry; 15% bedrock fragments (10 mm); pH 5.0; clear boundary | |
| Land system, component: | Bulltown Spur, 1 | B3 | 42 - 55 cm | Red (2.5YR 4/6) stony light clay; apedal earthy fabric; slightly hard when dry; 30% bedrock fragments (20 mm); pH 5.0 | |
| Topography: | Upper slope of ridge, 30% gradient, SW aspect | ||||
| Elevation: | 1020 m | ||||
| Drainage: | Good | ||||
| Parent material: | Sandstone and siltstone | ||||
| Vegetation: | Woodland I: Eucalyptus macrorhyncha, E. divesand E. mannifera with Cassinia longifolia, Prostanthera sp.and Platylobium formosum common in shrub layers. Herb layer sparse — Poa sp., Stylidium graminifolium and Helichrysum semipapposum predominant | ||||
| LABORATORY ANALYSES 983 | |||||||||||||||||||
Sample Depth cm | Lab. texture | Particle size distribution | Atterberg limits | 1:5 soil water suspension | Clay mineralogy by x-ray diffraction | ||||||||||||||
Gravel % | Coarse sand % f.e. | fine sand % f.e. | Silt % f.e. | Clay % f.e. | liquid limit % | plastic limit % | plasticity index % | linear shrinkage % | pH | EC 25°C uS/cm | Cl- % | Depth cm | Composition % | ||||||
0 - 4 10 - 20 30 - 42 | SiL SiL C | 47 43 43 | 13 12 11 | 30 30 24 | 29 30 22 | 17 20 43 | 4.4 4.6 4.7 | 110 35 26 | 0.003 0.002 0.001 | ||||||||||
Sample Depth cm | Org. C % | Total N % | 1.3C N | Free Fe2O3 % | Available | HCl extract | Exchangeable cations | ||||||||||||
P ppm | K ppm | P % | K % | Ca | Mg | K | Na | CEC | Ca % of CEC | Mg | K | Na | H | ||||||
Milliequivalents/100g | |||||||||||||||||||
0 - 4 | 6.1 | 0.25 | 32 | 2.2 | 11 | 280 | 0.018 | 0.19 | 0.2 | 0.2 | 0.8 | 0.2 | 43.0 | <1 | <1 | 2 | <1 | 98 | |
10 - 20 | 2.3 | 0.095 | 31 | 2.5 | 7 | 80 | 0.011 | 0.14 | 0.07 | 0.05 | 0.3 | 0.05 | 33.0 | <1 | <1 | 1 | <1 | 99 | |
30 - 42 | 3.6 | 6 | 60 | 0.017 | 0.24 | 0.07 | 0.3 | 0.3 | 0.08 | 24.7 | <1 | 1 | 1 | <1 | 98 | ||||
© State of Victoria (Agriculture Victoria) 1996 - .

This work, Victorian Resources Online, is licensed under a Creative Commons Attribution 4.0 licence. You are free to re-use the work under that licence, on the condition that you credit the State of Victoria (Agriculture Victoria) as author, indicate if changes were made and comply with the other licence terms.
The licence does not apply to ‘branding’ or some ‘images or photographs’ that may be owned by third parties. We ask you to seek prior approval to use images using the VRO feedback form. Access to higher quality images can also be provided on request.
This page was last updated on .