
SW90
Location: Mount Pollock
Australian Soil Classification: Calcic, Mottled-Mesonatric, Black SODOSOL
General Landscape Description: Undulating low hills/rolling low hills.
Site Description: Simple slope.
Geology: Quaternary-Newer Volcanics.
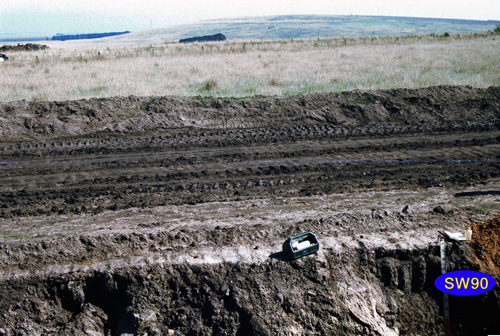 SW90 Landscape |
Soil Profile Morphology:
Surface Soil
| A1 | 0-15 cm | Very dark grey (10YR3/1 moist); fine sandy loam; pH 5.5: |  SW90 Profile - Note: Surface (A1) horizon has been stripped from soil profile. |
| A2 | 15-25 cm | Dark greyish brown (10YR4/2 moist), light brownish grey (10YR6/2 dry); fine sandy loam; weakly pedal; common fine buckshot; pH 6.2; sharp change (thin discontinuous bleached contact) to: | |
| Subsoil | |||
| B21t | 25-60/70 cm | Very dark grey (10YR3/1 moist); heavy clay; few small yellowish brown (10YR5/8 moist) mottling; very coarse (200 mm) prismatic to columnar (200 mm), parting to coarse prismatic and blocky structure; strong consistence dry; pH 6.6; abrupt boundary to: | |
| B22g | 60/70+ cm | Dark greyish brown (10YR4/2 moist) with common (~20%), diffuse, yellowish brown (10YR5/4-5/6 moist) mottles; heavy clay; apedal; common amount of buckshot; large irregular rounded basalt boulders (>60 cm) at unusual angles (possibly colluvial); pH 8.5. |
Key Profile Features:
- Strong texture contrast between surface (A) horizons and subsoil (B21) horizon.
- Very coarse prismatic to columnar structure in upper subsoil.
Soil Profile Characteristics:
pH | Salinity Rating | |||
Surface (A1 horizon) | Strongly Acid | Low | Non Sodic | None |
Subsoil (B21 horizon) | Slightly Acid | Low | Strongly Sodic | Complete |
Deeper Subsoil (at 75-90 cm) | Moderately Alkaline | Low - Moderate | Strongly Sodic | Complete |
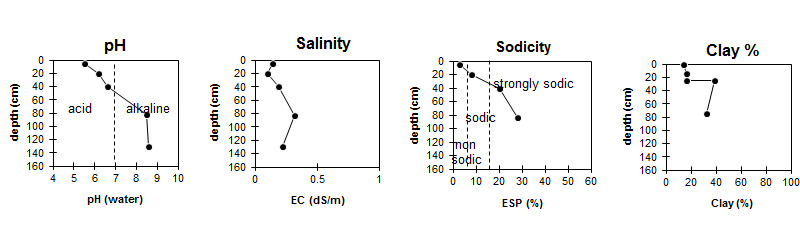
| The surface is strongly acid. The subsoil is slightly acid becoming moderately alkaline at depth. | Salinity rating is low in the surface and upper subsoil becoming low to moderate in the deeper subsoil. | The soil is non sodic in the surface and strongly sodic in the subsoil. | The clay content increases markedly at the A/B boundary. |
Horizon | Sample Depth (cm) | pH (water) | pH (CaCl2) | EC 1:5 | NaCl % | Exchangeable Cations | |||
Ca | Mg | K | Na | ||||||
meq/100g | |||||||||
A1 | 0-5 | 5.5 | 4.7 | 0.14 | 3.4 | 3 | 0.5 | 0.59 | |
A2 | 15-25 | 6.2 | 5.1 | 0.1 | 3 | 3.3 | 0.21 | 1.1 | |
B21t | 30-50 | 6.6 | 5.5 | 0.19 | 4.3 | 10 | 0.47 | 3.6 | |
B22g | 75-90 | 8.5 | 7.4 | 0.32 | 0.03 | 3.8 | 9.7 | 0.3 | 5.2 |
120+ | 8.6 | 7.4 | 0.22 | 0.03 | |||||
Horizon | Sample Depth (cm) | Exchangeable Aluminium mg/kg | Exchangeable Acidity meq/100g | Organic Carbon % | Nitrogen % | Field Capacity pF2.5 | Wilting Point pF4.2 | Coarse Sand (0.2- 2.0 mm) | Fine Sand (0.02- 0.2 mm) | Silt (0.002- 0.02 mm) | Clay (<0.002 mm) |
A1 | 0-5 | <10 | 11 | 3.6 | 0.27 | 26.6 | 9.7 | 25 | 38 | 17 | 14 |
A2 | 15-25 | <10 | 6.1 | 22.7 | 7.2 | 25 | 39 | 17 | 16 | ||
B21t | 30-50 | 40.2 | 19.6 | 18 | 27 | 11 | 39 | ||||
B22g | 75-90 | 35.9 | 16.2 | 21 | 32 | 11 | 32 | ||||
120+ |
Management Considerations:
Subsoil (B) Horizons
- The subsoil displays vertic features (i.e. slickensides) which indicates that significant shrinking and swelling occurs during wetting and drying cycles. This may have engineering implications and is likely to explain the variability in surface horizon depth across the trench.
- The dense and coarsely structured subsoil is strongly sodic and disperses completely in water. This will result in restricted root and water movement into the subsoil.
Profile Described By: Richard McEwan (March1999).
© State of Victoria (Agriculture Victoria) 1996 - .

This work, Victorian Resources Online, is licensed under a Creative Commons Attribution 4.0 licence. You are free to re-use the work under that licence, on the condition that you credit the State of Victoria (Agriculture Victoria) as author, indicate if changes were made and comply with the other licence terms.
The licence does not apply to ‘branding’ or some ‘images or photographs’ that may be owned by third parties. We ask you to seek prior approval to use images using the VRO feedback form. Access to higher quality images can also be provided on request.
This page was last updated on .